Abstract
A sodium channel is composed of four similar domains, each containing a highly charged S4 helix that is driven outward (activates) in response to a depolarization. Functionally, the channel has two gates, called activation gate (a gate) and inactivation gate (I gate), both of which must be open for conduction to occur. The cytoplasmically located a gate opens after a depolarization has activated the S4s of (probably) all four domains. The I gate consists of a cytoplasmically located inactivation “particle” and a receptor for it in the channel. The receptor becomes available after some degree of S4 activation, and the particle diffuses in to inactivate the channel. The I gate usually closes when the a gate is open [open-state inactivation (Osi)] but also can close before the channel reaches the conducting state. This “closed-state inactivation” (Csi) is studied quantitatively in this paper to determine the degree of S4 activation required for (i) opening the a gate, and (ii) permitting the I gate to close. Csi is most prominent for small depolarizations, during which occupancy of the partially activated closed states is prolonged. Large depolarizations drive the S4s outward quickly, minimizing the duration of closed-state occupancy and making Csi small and Osi large. Based on these data and evidence in the literature, it is concluded that opening the a gate requires S4 activation in domains 1–3, with partial activation of the S4 of domain 4. Csi requires only S4 activation of domains 3 and 4, which does not open the a gate.
Keywords: activation
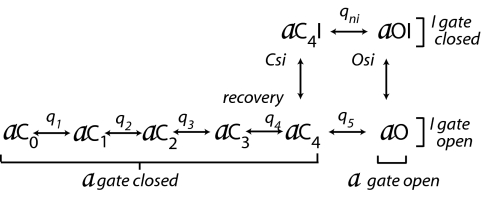
During an action potential, sodium channels first activate, driving the upstroke, and then inactivate, facilitating repolarization to the resting potential. The channel's a gate (activation gate) is closed at rest and activates in several steps to an open state after depolarization. The inactivation gate (I gate) is open at rest and closes relatively slowly after depolarization in a single step. Hodgkin and Huxley's highly successful empirical model (1) attributed the behavior of what are now called gates to a voltage sensor/effector belonging to each gate, which sensed the voltage and opened or closed the attached gate. Later work showed that only the a gate has a voltage sensor/effector (2, 3). The apparent voltage sensitivity of inactivation comes from the fact that a receptor for an “inactivation particle” becomes available only when the activation gate is partially or fully activated (2–5). These ideas, which preceded cloning of the channel, were summarized in the following state diagram (4), with the states renamed here for clarity (Scheme 1).
Scheme 1.
Inactivation model, 1977.
At the resting potential, the preferred state is aC0 (gate a closed and fully deactivated). After depolarization, several sequential steps are required to move the activation gate from aC0 through the partially activated states (aC1–4) to aO (gate a open). Each of these steps is voltage-dependent and involves the movement of gating charge (Ig) through the membrane, as indicated by q1–5. Increasingly positive voltage alters the rate constants of these steps and drives the channels to the right in the diagram. In the single conducting state (aO), both a and I gates are open, and the channel is conducting.
Inactivation from aO occurs mainly in the step aO > aOI, with rate constants κ and λ. λ is small compared with κ, with the result that most channels inactivate. κ and λ are unaffected by membrane voltage (Vm), so no gating current is generated by this step. On repolarization, the channels recover from inactivation in a few milliseconds and return to state aC0. If the channels were frozen in aOI, there could be no gating current at the instant of repolarization, because none of the steps that involve gating charge movement (aOI → aC0) could occur: All gating charge would be temporarily immobilized. In fact, a third of the charge is not immobilized (qni), and its movement produces a fast tail of inward Ig, which is associated with step aOI → aC4I (3). This step closes the a gate, whereas the I gate remains closed, and the channel subsequently can recover from inactivation without passing through the conducting state, aO (6, 7). Because λ is small, very few channels move from aOI to aO, and recovery from inactivation mainly follows the path aOI → aC4I → aC4 →→ aC0, thus bypassing aO. This is important functionally, because recovery occurs at negative voltage, where influx of Na+ through any conducting channels would be large and would have a strong depolarizing influence.
As first shown by Bean (8), the channel can inactivate without fully opening, as definitively confirmed by Aldrich and Stevens by using single-channel analysis (9). After some thought, we realized this possibility is inherent in the diagram above, via the path from aC4 to aC4I. Significant inactivation via this path [closed-state inactivation (Csi)] would occur only during prolonged occupancy of state aC4.
The purpose of this paper is to modernize the scheme and to associate the individual domains of the Na channel (10) with the transitions in the diagram. Some features in the structure and behavior of the domains that must be taken into account are detailed in the Table 1, where the last two rows are based on the fluorescence data of Bezanilla and colleagues (11, 12).
Table 1.
Properties of Na channel domains
| Finding | Domain |
|||
|---|---|---|---|---|
| D1 | D2 | D3 | D4 | |
| Positive residues in S4 | 4 | 5 | 6 | 8 |
| Kinetics | Fast | Fast | Fast | Slow |
| Immobilized by inactivation? | No | No | Yes | Yes |
A quantitative study of Csi is presented here to determine which domains are related to activation of the channel and the minimum S4 motion that must occur before a channel can inactivate. A revised model is proposed that requires that only domains 3 and 4 activate before inactivation can occur. The revised model incorporates the information in Table 1, accounts for the special relation (13–16) between inactivation and domain 4, and provides an explanation for the voltage dependence of recovery from inactivation.
Results
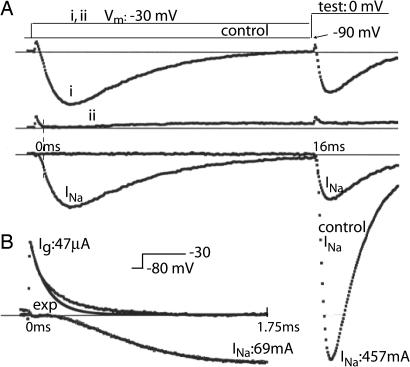
Inactivation was measured with a two pulse sequence (Fig. 1A). Membrane voltage (Vm) was clamped at −90 mV, where steady-state inactivation is near zero, and a conditioning pulse was applied to −30 mV for 16 ms in the example shown. At −30 mV, some of the Na channels open and then inactivate; a second pulse (test) to 0 mV was used to see how many Na channels were not inactivated (Trace i). Trace i contains not only INa, but also a small gating current (Ig) and a small potassium current (IK) that resisted suppression (see Methods). To measure and subtract out these components, Trace ii was recorded by using the same protocol after adding Tetrodotoxin, which completely blocked INa, leaving Ig and IK. Trace INa is the difference between ii and i. Comparing INa in the test pulse with and without (control) a prepulse shows that after 16 ms at −30 mV, 22% of the channels were openable and 78% were inactivated.
Fig. 1.
Measuring inactivation and the slow component of activation. (A) (i) With IK largely suppressed, Ig and INa were measured during a 16-ms conditioning pulse from −90 to −30 mV, followed by a test pulse to 0 mV. (ii) After adding Tetrodotoxin, Ig and a small residual IK are visible. (i–ii) Subtracting ii from i leaves INa. Comparing i and ii during the test pulse to “control” (no conditioning pulse) shows that 78% of the channels inactivated during the pulse to −30 mV. The vertical dashed line shows that the fast component of Ig in trace ii is largely over before INa rises significantly (trace i-ii). (B) Ig and INa at higher resolution in a different experiment. The early part of the Ig trace is fitted with an exponential to elucidate a slower phase of Ig that temporally correlates with the rise of INa.
The gating current (Ig) transient in trace ii is largely ended early in the rising phase of INa (compare at the dashed vertical line). The rising phase of INa is kinetically voltage-dependent and must have associated gating current. The required current can be seen at higher resolution in Fig. 1b, where Ig has two distinct components, made clear by fitting an exponential to the faster one. The slower component is temporally correlated with the rise of INa to its peak (cf. ref. 4) and is the gating current generated by the opening step. This information is combined below with the fluorescence evidence (11) to show that the S4 helix of domain (D)4 must move before the channel can open (Discussion).
Returning to the I gate, how much of the inactivation in Fig. 1a is from closed states (Csi) and how much from the open-state inactivation (Osi)? Osi occurs in the step
 |
where κ and λ are independent of voltage (see Discussion). During a pulse, the total inactivation that occurs via the open state is always proportional to the integral
during the pulse (see Methods for Θpen definition). To find the fraction of all channels that inactivate from the open state, the integral for a given pulse must be divided by [∫Θpen·dt]max, the value of the integral when all channels inactivate through the open state. This value is approximated with a large pulse that drives all channels through the closed states very rapidly, making Csi negligible. Thus, ∫Θpen·dt should reach a saturating value, which is the “openness” required for complete inactivation via the Open state.
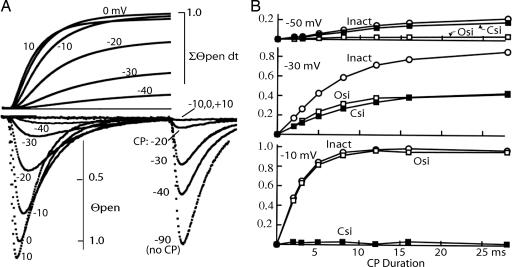
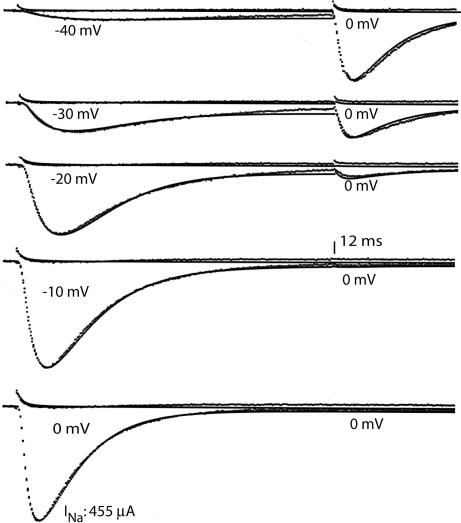
An experimental determination of the maximum integral is shown in Fig. 2. The lower traces show Θpen for prepulses to −40 through +10 mV superimposed and the noninactivated current after these prepulses. Test pulse current is negligible after conditioning pulses of −10, 0, and +10 mV, showing that inactivation is complete. The upper traces are the integral ∫Θpen·dt for each of these depolarizations. The integral rises to a maximum value in the range −10 to +10 mV. Given this value, Osi and Csi are calculated as
where Inact is total inactivation, measured as in Fig. 1A.
Fig. 2.
Measuring open- and closed-state inactivation. (A Lower) The lower traces show the fraction of Θpen channels (see Methods) for a 16-ms conditioning pulse (CP) to the indicated voltage. The peaks at the right show Θpen at 0 mV after a CP to the indicated voltage (see Fig. 1A for protocol). CP to −10, 0, or +10 mV causes complete inactivation. (A Upper) Time integrals of Θpen during the CP (lower left traces). The integral reaches a maximum in the range −10 to + 10 mV. This maximum is assigned the value 1.0 and is the Θpen-time integral required for all channels to inactivate via the open state. This value is used to calculate Osi and Csi (see Results). (B) Osi, Csi, and total (Inact) inactivation at three voltages as a function of CP duration.
The time course of Csi, Osi, and inactivation are shown for three values of Vm in Fig. 2B. At −50 mV, total inactivation after 28 ms is ≈22%. Of this total, Osi is 3% and ≈14% is Csi. The curves of total inactivation and Csi almost superimpose and they rise slowly, reflecting prolonged occupancy of one or more partially activated states. Few channels open, so Osi is small. At −30 mV, ≈75% of the channels are inactivated after 28 ms. Approximately half of this total inactivation is Osi, and the remaining half is Csi. At −10 mV, ≈95% of the channels are inactivated, most of them by way of the open state. Only a small amount of Csi occurs, and it is quickly completed because the channels move briskly out of the closed states to open.
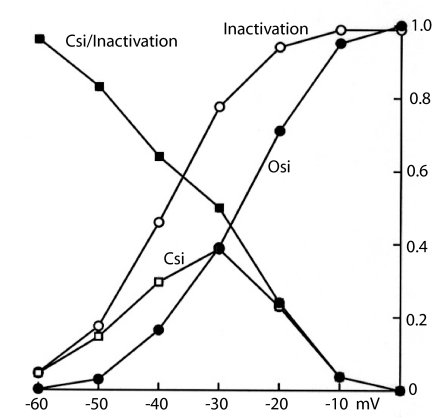
Inactivation and its components are plotted in Fig. 3 as a function of voltage for a 16-ms conditioning pulse. Total inactivation (the sum of Osi and Csi) follows the usual sigmoid curve, becoming significant at −50 mV and reaching a value near 1.0 at ≈−10 mV. Csi is detectable near −50 mV, because increasing voltage drives channels from the fully deactivated state into the partially activated states. It reaches a maximum near −30 mV and then declines as higher voltage forces the channels to move progressively more quickly to conducting and inactivated states. The fraction of total inactivation that results from Csi is plotted as Csi/Inactivation. At −60 mV, nearly all inactivation results from Csi: Voltage is sufficient to partially activate some channels, but few of them reach aO. Csi/inactivation decreases with Vm, and near 0 mV, it is very small: The channels are driven through the partially activated states too quickly for significant Csi. At 0 mV, nearly all inactivation is by way of the open state, as shown by the convergence of the Osi and inactivation curves.
Fig. 3.
Dividing inactivation into Osi and Csi. Osi was calculated by using the Θpen-time integral (Fig. 2A) for a 16-ms CP. Csi is the difference between Inactivation (total) and Osi. Csi/inactivation plots the fraction of total inactivation that results from Csi, near 1.0 at −60 mV and near 0 at 0 mV.
Discussion
Separating Osi and Csi.
The method for separating Osi from Csi depends on the voltage independence of the rate constants κ and λ that link the open and the inactivated states. Because of the importance of this point, it is useful to summarize the evidence supporting it. (i) For small depolarizations, opening of the activation gate is slow, and overlaps, in time, the closing of the inactivation gate. The decay of INa thus does not give a good measure of the intrinsic inactivation rate: INa decay is slowed by late-opening channels (2, 5, 9). For large depolarizations, the a gate opens much faster, overlap with the slower I gate is minimized, and the decay of INa is a good measure of inactivation rate. So, the rate measured changes very little for Vm > +10 or 20 mV (3, 5, 17). (ii) From analysis of single channels, Aldrich and Stevens (18) concluded that inactivation rate changes little with voltage from –60 to –30 mV, consistent with an apparent charge of only 0.1 to 0.5 e−. (iii) The decay rate of INa tails on repolarization is a mixture of activation gate closing and inactivation, which continues as long as channels are open. The contribution of inactivation to the tail decay rate has been determined in clonal pituitary cells by measuring INa tails before and after removal of inactivation by papain (17). The rate of the inactivation step does not change over the range + 60 to −40 mV, and from −40 to −80 mV increases at most by a factor of 1.1–1.8; i.e., an apparent charge of 0.4 e− at most. (iv) The absence of a component of gating current that has the time course of inactivation (4) shows that the inactivation step has little, if any, voltage dependence.
A Model for Activation–Inactivation.
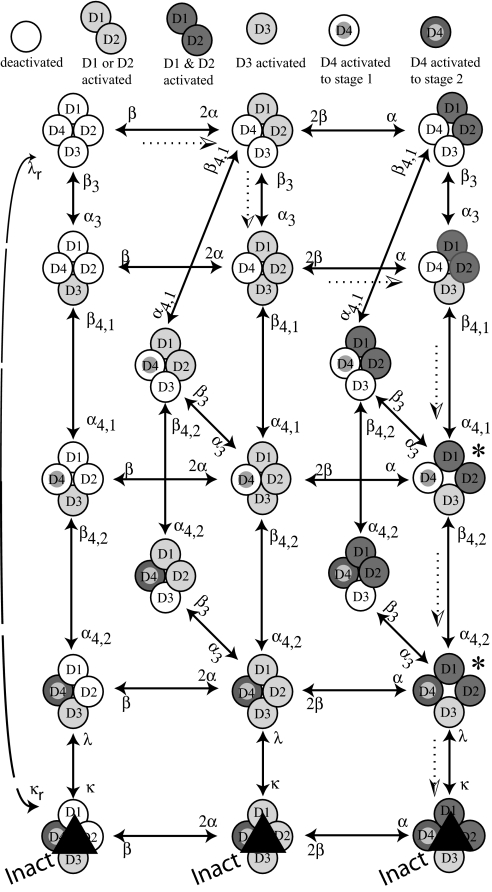
Fig. 4 is a revision of the model in the introduction to incorporate the Csi data, the fluorescence data (11, 12), scorpion toxin studies (14, 15), and evidence from mutations (13, 16). The four domains of an Na channel are indicated by circles, with shading to indicate activation of their S4 segments. For D1, D2, and D3, activation of S4 occurs in a single step (or in multiple steps that so far cannot be kinetically distinguished from a single step). Horizontal steps in the diagram indicate activation/deactivation of (the S4 of) D1 or D2. For simplicity, D1 and D2 are regarded as indistinguishable. Light gray means that either D1 or D2 is activated, and dark gray means that both are activated. In a step from the left to the middle column, α is multiplied by two because both D1 and D2 are available to activate. From the middle to the right column, only one of the two remains to be activated, so the rate constant is α × 1. The same logic applies in the reverse direction. The lowest vertical step represents closing/opening of the I gate, with rate constants κ/λ. The other vertical steps and the oblique steps represent activation/deactivation of D3 (rate constants α3/β3) or D4. D4 activates in two steps, as suggested by Horn et al. (13), with rate constants α4,1/β4,1 and α4,2/β4,2. Completion of stage 1 activation for D4 is represented by a gray dot; stage 2 by a gray dot and dark annulus. Opening the channel requires activation of D1&D2&D3 and step 1 activation of D4. Inactivation can occur after activation of D3 and full activation of D4 (to D42), the latter requiring two steps, as noted. Activation of D1 and D2 is not necessary for inactivation to occur. S4s of the domains are independent of each other, with the simplifying exceptions that D4 cannot activate until either D3 or D1‖D2 is activated, and the first step of D4 activation must precede the second.
Fig. 4.
State diagram for activation and inactivation. A horizontal step represents activation (rightward movement) or deactivation (leftward movement) of D1 or D2, which are kinetically indistinguishable. A vertical step represents activation/deactivation of D3 (rate constants α3/β3), first-stage activation of D4 (α4,1/β4,1), second-stage activation of D4 (α4,2/β4,2), or closing of the inactivation gate (κ/λ). The dotted arrows indicate the most probable path from fully deactivated (upper left corner) to inactivated at 0 mV. Conducting states are marked with asterisks.
Many paths are possible from the deactivated state (upper left) to the two conducting states (*) and to the three inactivated states (Inact, bottom row). For illustration, the most likely path for a depolarization to 0 mV is as follows. At rest (upper left) the S4s of all domains are deactivated as indicated by the empty circles. (i) On depolarization, the channel is most likely to jump to the right rather than downward, because 2α > α3. (ii) The next most likely step is downward to D1‖D2&D3 (α3 > α). (iii) Next, a step to the right is most probable (α > α4,1) to D1&D2&D3. (iv) The next step is downward (α4,1 > β3 at 0 mV), resulting in the first stage of D4 activation (gray dot, D41) and opening of the channel. Note that from fully deactivated to open, the channel has passed through three closed states, consistent with sigmoid kinetics. (v) Next is another downward step (α4,2 > 2β at 0 mV) to the second open state, in which D4 is fully activated (gray dot and dark annulus, D42). (vi) In the final step, the channel inactivates (κ > 2β at 0 mV), entering the bottom right state, where it remains until repolarization. (vii) Upon repolarization, there are two rapid steps to the left (both 2β and β are large compared with λ), as D1 and D2 deactivate, closing the channel and preventing conduction during recovery from inactivation. These two steps generate the fast component of gating current that is not immobilized by inactivation (4). (viii) There follows a slow return to rest from the leftmost inactivated state. This lumped step (empirical rate constant λr) represents removal of the inactivating particle from the channel and deactivation of D3 and D4. S4 motion in these steps generates the slow component of gating current that parallels recovery from inactivation (3, 4). κr is very small.
Fitting.
The model was fit to both Ig and INa. Ig was fit first because it gives a clear indication of the movement of the fast domains, D1–D3 (11, 12). After fitting Ig, it was easy to adjust the steps in which D4 is activated to fit the rise of the conductance (the unweighted sum of the two conducting states). The rate constants κ/λ then were fit to the inactivating phase of INa. Sample fits of Ig and INa are shown in Fig. 5, using the rate constants given in the legend. The fits reproduce the two pulse experiment (Fig. 2) with good fidelity, except for slightly too much predicted INa at the ends of some conditioning pulses. This could probably be resolved by putting more closed states in the model, e.g., including two stage activation for the S4s of D1–D3. Fitting open kinetics and total inactivation at each voltage is sufficient to assure good fits of Osi and Csi (data not shown).
Fig. 5.
The state diagram of Fig. 4 was fitted to Ig and INa, using rate constants in Table 2.
Physical Interpretation.
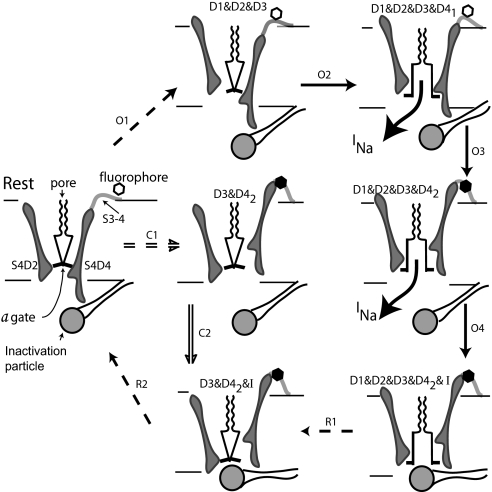
The cartoon in Fig. 6 shows a cross-section of the channel, including the S4 helices of D2 and D4. At rest, all of the S4s are pushed firmly inward by negative voltage, physically interfering with the opening of the activation gate that is formed by the convergence of the S6 helices. The S4 of D4 is longer than that of D2 and has eight charges rather than five. After a depolarization to 0 mV, the likely path (Steps O1) is up and right as the S4s of D1,2,3 activate (only D2 shown). From state D1&D2&D3 (Step O2), there follows the first stage of D4 activation, which opens the a gate allowing ion conduction (→D1&D2&D3&D41). After the second stage of S4D4 activation (Step O3), the a gate remains open, but the inactivation particle is free to move into blocking position. The hexagon represents a fluorophore attached to C1436 (a site-directed mutation) in the S3–4 linker (12). The fluorophore is quenched (blacked out) by D41 → D42. Consistent with the fluorescence results, the fluorescence change thus lags opening of the activation gate, which occurs in the preceding step (O2). The inactivation particle moves into blocking position (Step O4).
Fig. 6.
Channel activation and inactivation. At rest, the S4s of all domains are fully deactivated, forced inward by negative Vm. This pinches closed the a gate at the inner end of the pore. The scallops represent the selectivity filter. Path O: On depolarizing to 0 mV, the most likely path is shown by arrows O1–O4, with dashed arrows indicating multiple steps. Conduction begins when all four domains are activated, with D4 activated to stage 1. Stage 2 activation of D4 removes the steric hindrance that prevents closing of the inactivation gate and quenches fluorescence of the tag attached to the S3–4 linker of D4. Path C: At −30 mV, paths C and O are equally probable. After step C1, the a gate is held closed by D1 and D2, which are not activated, but inactivation is possible because D3 and D4 are activated, the latter to stage 2. The inactivation gate closes in step C2. Recovery: Steps R1 close the a gate as D1 and D2 deactivate, generating the inactivation resistant component of Ig. During step R2, negative Vm drives the S4s of D3 and D4 inward, the latter forcing the inactivation particle out of blocking position.
For a depolarization to −50 mV, the Csi path is most likely; i.e., steps C1 followed by C2. After C1, D3 and D4 are activated, the latter to stage 2, whereas D1 and/or D2 remain deactivated. The a gate thus remains closed, but the I gate can close, as it does in step C2 (D3&D42 → D3&D42&I). Although inactivation is slight, almost all of it is Csi. For a depolarization to −30 mV, the steps C1 and O1 are about equally probable: Almost 80% of the channels inactivate (Fig. 3), with Osi and Csi each accounting for ≈40%. At −10 mV or more, the Osi path is most likely as noted above, and the channels move through the closed states so rapidly that there is little chance for Csi.
Recovery from inactivation after repolarization is shown in the bottom row. After Osi, the initial events on repolarization are the inward movement of the S4s of D1 and D2, which forces the a gate to close (steps R1 and D2 shown). These steps generate the gating current that resists inactivation, and, functionally, they close the channel so that it will not leak during recovery from inactivation. Next in recovery are three lumped steps, labeled R2. In the first of these, S4D4 moves inward (D42→D41), displacing the inactivation particle from blocking position. Without this push to dislocate the inactivation particle, recovery would have to occur from spontaneous dissociation of the particle, with rate constant λ, making it very slow. After removal of the inactivation particle, the second and third of the R2 steps can occur; D3 and D4 deactivate completely, and the channel returns to fully deactivated. Together, steps R1 and R2 determine the rate of recovery after Osi, which is faster when the voltage driving S4D4 inward is more negative.
This model also explains other data acquired since the 1977 model. Particularly fascinating are phenomena that involve the S3–4 region of D4, the binding region of the fluorophore mentioned above. α scorpion toxin (14, 15) binds to this region, and mutation of the outermost arginine of S4D4 causes paramyotonia (16) by altering inactivation. Both toxin and certain mutations slow inactivation without appreciably affecting opening of the channel. In terms of the model given here, toxin and mutation interfere with the second stage of S4D4 activation (13). Interestingly, toxin is displaced by depolarization, presumably because outward movement of D4S4 decreases the affinity of its binding site. This action is similar but opposite to the one proposed here for recovery from inactivation, in which inward motion of D4S4 drives the inactivating particle from its blocking site. The model also explains the voltage dependence of the Csi rate noted by Aldrich and Stevens (9). The rate is given by the product of κ and the summed occupancy of the three states in the next to bottom row of Fig. 4, where D3 and D4 are activated, the latter to stage 2. Although κ is independent of Vm, occupancy of these three states strongly depends on Vm.
S4D4 activation is posited in the model to be necessary for a gate opening for the following reason. Fig. 1 shows that Ig has fast and slow components and that a slow component correlates with the opening of the channel. From the fluoresence data, only fast components are generated by D1, D2, and D3 (11, 12), all too fast to explain channel opening. Using the existing data, the problem can be solved if a first stage of S4D4 activation correlates with channel opening and a second stage prepares the receptor for the inactivation particle.
Methods
Experiments were performed on squid giant axons (at 10°C) subjected to voltage clamp and internal perfusion by using standard methods (3). Electronic compensation was provided to prevent series resistance errors. Leakage current and capacitive current were removed by subtraction.
Solutions.
Solutions were designed to (i) minimize space-clamp problems, by substituting tetramethyl ammonium ion for most external sodium (Na+: 100 mM). (ii) Maximize steady-state inactivation: In some conditions, inactivation is substantially incomplete in the steady state. To ameliorate this, the internal solution contained 275 mM K+, with 100 mM Ca2+ externally. (iii) Minimize K+ conductance. The axon was initially perfused for 1,000 s with 40 mM TEA+ in the absence of external K+ to kill most K channels (19). TEA+ was removed, and 10 mM Ba2+ was added internally and 5 mM Ba2+ externally to block remaining K+ channels. Residual K+ current was removed by subtraction after adding Tetrodotoxin.
Estimation of the Fraction of Open Channels.
Because of overlap between activation and inactivation, there is no easy way to determine the absolute fraction of channels open. Θpen, which is used here, is proportional to the open fraction. It is calculated at any instant by dividing INa by maximum INa at 0 mV, with a correction for the nonlinearity of the instantaneous IV curve. The correction factor is fIV.
Table 2.
Rate constants used in Fig. 5
| Vm, mV | α/β | α3/β3 | α4,1/β4,1 | α4,2/β4,2 | κ/λ | κr/λr |
|---|---|---|---|---|---|---|
| −40 | 2.4/3.5 | 2.6/3.9 | 0.5/0.6 | 0.9/0.2 | 0.7/0 | 0.65 |
| −30 | 2.9/2.2 | 3.2/2.3 | 0.8/0.25 | 1.2/0.1 | 0.7/0 | 0.45 |
| −20 | 3.8/1.1 | 4.2/1.2 | 1.2/0.1 | 1.4/0.08 | 0.7/0 | 0.4 |
| −10 | 5.7/0.55 | 6.3/0.61 | 1.7/0.1 | 1.5/0.05 | 0.7/0.01 | 0.3 |
| 0 | 6.0/0.17 | 6.6/0.2 | 2.9/0.1 | 2.0/0.05 | 0.7/0.01 | 0 |
Glossary
Abbreviations
- Vm
membrane voltage
- a gate
activation gate
- CP
conditioning pulse
- Csi
closed-state inactivation
- D
domain
- I gate
inactivation gate
- Osi
open-state inactivation.
Footnotes
The author declares no conflict of interest.
References
- 1.Hodgkin AL, Huxley AF. J Physiol (London) 1952;117:500–544. doi: 10.1113/jphysiol.1952.sp004764. [DOI] [PMC free article] [PubMed] [Google Scholar]
- 2.Bezanilla F, Armstrong CM. J Gen Physiol. 1977;70:549–566. doi: 10.1085/jgp.70.5.549. [DOI] [PMC free article] [PubMed] [Google Scholar]
- 3.Armstrong CM, Bezanilla F. J Gen Physiol. 1977;70:567–590. doi: 10.1085/jgp.70.5.567. [DOI] [PMC free article] [PubMed] [Google Scholar]
- 4.Armstrong CM, Gilly WF, editors. J Gen Physiol. 1979;74:691–711. doi: 10.1085/jgp.74.6.691. [DOI] [PMC free article] [PubMed] [Google Scholar]
- 5.Aldrich RW, Corey DP, Stevens CF. Nature. 1983;306:436–441. doi: 10.1038/306436a0. [DOI] [PubMed] [Google Scholar]
- 6.Armstrong CM, Croop RS. J Gen Physiol. 1982;80:641–662. doi: 10.1085/jgp.80.5.641. [DOI] [PMC free article] [PubMed] [Google Scholar]
- 7.Kuo CC, Bean BP. Neuron. 1994;12:819–829. doi: 10.1016/0896-6273(94)90335-2. [DOI] [PubMed] [Google Scholar]
- 8.Bean BP. Biophys J. 1980;35:595–614. doi: 10.1016/S0006-3495(81)84815-1. [DOI] [PMC free article] [PubMed] [Google Scholar]
- 9.Aldrich RW, Stevens CF. Cold Spring Harbor Symp Quant Biol. 1983;48:147–153. doi: 10.1101/sqb.1983.048.01.017. [DOI] [PubMed] [Google Scholar]
- 10.Noda M, Shimuzu S, Tanabe T, Takai T, Kayano T, Ikeda T, Takahashi H, Nakayama H, Kanaoka Y, Minamino N, Numa S. Nature. 1984;312:121–127. doi: 10.1038/312121a0. [DOI] [PubMed] [Google Scholar]
- 11.Cha A, Ruben PC, George AL, Fujimori E, Bezanilla F. Neuron. 1999;22:73–87. doi: 10.1016/s0896-6273(00)80680-7. [DOI] [PubMed] [Google Scholar]
- 12.Chanda B, Bezanilla F. J Gen Physiol. 2002;120:629–645. doi: 10.1085/jgp.20028679. [DOI] [PMC free article] [PubMed] [Google Scholar]
- 13.Horn R, Ding S, Gruber HJ. J Gen Physiol. 2000;116:461–476. doi: 10.1085/jgp.116.3.461. [DOI] [PMC free article] [PubMed] [Google Scholar]
- 14.Catterall WA. J Gen Physiol. 1979;74:375–391. doi: 10.1085/jgp.74.3.375. [DOI] [PMC free article] [PubMed] [Google Scholar]
- 15.Rogers JC, Qu Y, Tanada TN, Scheuer T, Catterall WA. J Biol Chem. 1996;271:15950–15962. doi: 10.1074/jbc.271.27.15950. [DOI] [PubMed] [Google Scholar]
- 16.Ji S, George AL, Jr, Horn R, Barchi RL. J Gen Physiol. 1996;107:183–194. doi: 10.1085/jgp.107.2.183. [DOI] [PMC free article] [PubMed] [Google Scholar]
- 17.Cota G, Armstrong CM. J Gen Physiol. 1989;94:213–232. doi: 10.1085/jgp.94.2.213. [DOI] [PMC free article] [PubMed] [Google Scholar]
- 18.Aldrich RW, Stevens CF. J Neurosci. 1987;7:418–431. doi: 10.1523/JNEUROSCI.07-02-00418.1987. [DOI] [PMC free article] [PubMed] [Google Scholar]
- 19.Khodakhah K, Melishchuk A, Armstrong CM. Proc Natl Acad Sci USA. 1997;94:13335–13338. doi: 10.1073/pnas.94.24.13335. [DOI] [PMC free article] [PubMed] [Google Scholar]


