

Abstract
Methanotrophs have been widely investigated for in situ bioremediation due to their ubiquity and their ability to degrade halogenated hydrocarbons through the activity of methane monooxygenase (MMO). It has been speculated that cells expressing the soluble form of MMO (sMMO) are more efficient in cleaning up sites polluted with halogenated hydrocarbons due to its broader substrate range and relatively fast degradation rates compared cells expressing the other form of MMO, the particulate MMO (pMMO). To examine this issue, the biodegradation of mixtures of chlorinated solvents, i.e., trichloroethylene (TCE), trans-dichloroethylene (t-DCE), and vinyl chloride (VC), by Methylosinus trichosporium OB3b in the presence of methane using either form of MMO was investigated over longer time frames than those commonly used, i.e., days instead of hours. Growth of M. trichosporium OB3b along with pollutant degradation were monitored and analyzed using a simple comparative model developed from the Ω model created for analysis of the competitive binding of oxygen and carbon dioxide by ribulose bisphosphate carboxylase. From these findings, it appears that at concentrations of VC, t-DCE, and TCE greater than 10 μM each, methanotrophs expressing pMMO have a competitive advantage over cells expressing sMMO due to higher growth rates. Despite such an apparent growth advantage, pMMO-expressing cells degraded less of these substrates at these concentrations than sMMO-expressing cells during active growth. If the concentrations were increased to 100 μM, however, not only did pMMO-expressing cells grow faster, they degraded more of these pollutants and did so in a shorter amount of time. These findings suggest that the relative rates of growth substrate and pollutant degradation are important factors in determining which form of MMO should be considered for pollutant degradation.
Chlorinated hydrocarbons are used for a variety of uses, including degreasing of metal parts, scouring of textiles, and the production of organic chemicals and pharmaceuticals. Due to their extensive uses coupled with both accidental and purposeful releases, these compounds are commonly found in subsurface soils and groundwater (38, 45). Although these compounds are refractory, they have been shown to be degraded through a variety of microbially mediated processes. Specifically, under anaerobic conditions, many of these compounds have been shown to be reductively dechlorinated (6, 15, 25, 33, 34, 42). Under aerobic conditions, some of these compounds can be utilized as growth substrates (12, 24) or more commonly cooxidized in conjunction with a growth substrate such as methane, ammonia, toluene, or phenol (3, 4, 17-21, 30, 32, 36, 37, 41, 43, 44). Of the cells capable of growth on these substrates, methanotrophs are often used for the degradation of chlorinated hydrocarbons due to their ubiquity (23).
In methanotrophs, the enzyme responsible for chlorinated solvent degradation, methane monooxygenase (MMO), is also responsible for the initial oxidation of the sole growth substrate of these cells, i.e., methane. As such, the use of methanotrophs for the in situ remediation of chlorinated ethenes is problematic due to the competition of both the pollutant(s) and the obligate growth substrate for binding to MMO (21, 31, 36). To further complicate matters, some methanotrophs can express two forms of MMO. One form, the soluble methane monooxygenase (sMMO), is found in the cytoplasm, and the particulate methane monooxygenase (pMMO) is found in the intracytoplasmic membrane. The substrate specificities for these two enzymes are different, with sMMO having a broader range of substrates than pMMO (11, 23). It has also been found that sMMO-expressing cells degrade chlorinated ethenes at much faster initial rates than pMMO-expressing cells (30, 36). For these reasons, a great deal of attention has been given to using sMMO-expressing cells for enhanced bioremediation.
It should be noted, however, that most known methanotrophs cannot express sMMO and can express only pMMO. Of those methanotrophs that have the genes encoding polypeptides of the sMMO, these genes are expressed only when the level of copper is very low (10, 23). Furthermore, regardless of the form of MMO expressed, not only does competition exist between methane and chlorinated ethenes for binding, the product and substrate toxicity associated with these pollutants can and does occur (21, 31, 36, 37).
Thus, one must be aware of the possibility that although sMMO-expressing methanotrophs can degrade individual chlorinated ethenes at high rates, such degradation may ultimately be limited due to the greater product toxicity associated with sMMO activity compared to the same cell expressing pMMO. To characterize such effects, the concept of transformation capacity, defined as the amount of solvent degraded per amount of cells inactivated, has been created (1, 2).
From these and other studies, it is well accepted that the oxidation of chlorinated solvents has a negative effect on the growth of methanotrophs, but there have been no extensive studies of how mixtures of these compounds affect methanotrophs expressing either sMMO or pMMO. It can be hypothesized that since pMMO has a narrower substrate range than sMMO, pMMO-expressing cells will grow more rapidly than sMMO-expressing cells at high concentrations of mixtures of solvents due to reduced competition for binding sites and reduced product toxicity (assuming for the moment that substrate toxicity is the same regardless of what form of MMO is expressed by these cells). By extension, as growth decreases, the overall degradation of the solvent will also decrease due to reduced cell numbers over time. If this hypothesis is valid, the generally accepted idea that sMMO-expressing cells will outperform pMMO-expressing cells may need to be modified. It may be that at above a certain concentration threshold, pMMO-expressing cells may be a better choice, whereas sMMO-expressing cells could be preferred at low concentrations, particularly if product toxicity and reduced binding of methane by MMO limit the overall methanotrophic growth.
Here, we report a new concept based on substrate specificity to compare pMMO- and sMMO-expressing cells to determine which enzyme is more effective in mixed pollutant degradation. This study is based on the concept of specificity, Ω, which was first developed to describe CO2 and O2 binding by ribulose bisphosphate carboxylase, or rubisco (29). Dimensionless numbers similar to Ω are presented here based on the kinetics of degradation of several chlorinated solvents for sMMO and pMMO (32, 36). By using this kinetic information, these dimensionless numbers can be compared to data on the growth of methanotrophs in the presence of multiple chlorinated solvents as well as the amount of the degradation of these compounds. From our results, it appears that simple calculations of these dimensionless numbers can prove useful for deciding which cells and specific enzymes to use at different concentrations of chlorinated solvents and growth substrates.
MATERIALS AND METHODS
Culture conditions.
Methylosinus trichosporium OB3b was grown on nitrate mineral salt medium (46) at 30°C in Erlenmeyer side-arm flasks shaken at 260 rpm in a methane-to-air ratio of 1:2 at 1 atm of pressure. The culture medium was 30% of the total flask volume. For pMMO-expressing conditions, 20 μM copper was added aseptically in the form of CuCl2 after autoclaving and was equilibrated for at least 1 day before the media were inoculated. This concentration was used to prevent any limitations of copper during the entire growth period and also because it has been shown that pMMO-expressing cells degraded trichloroethylene (TCE) at this concentration of copper (32). For sMMO-expressing conditions, no copper was added.
Chemicals.
Highest-purity methane (>99.99%) and acetylene (99.6%) were obtained from Matheson Gas Company, Newark, NJ. TCE (>99.5%) and methanol (peroxide free, >99.9%) were purchased from Fisher Scientific Company, Fair Lawn, NJ. trans-Dichloroethylene (t-DCE) (>98%) and vinyl chloride (VC) (>99.5%) were purchased from Aldrich, Milwaukee, WI. Distilled deionized water from a Corning Millipore D2 system was used for all experiments. All glassware was washed with detergent and then acid washed in 2 N HNO3 for 24 h to remove trace metals, including copper. Nitric acid was removed by repetitive rinses with distilled deionized water.
For chlorinated solvents that are liquid at room temperature, i.e., TCE and t-DCE, saturated stock solutions were prepared according to a method described previously by Chang and Alvarez-Cohen (8). Water saturated with either TCE or t-DCE was added to sample vials by using Hamilton (Reno, NV) 1700 series gas-tight syringes, with care taken to exclude any non-aqueous-phase liquids. For compounds that are gaseous at room temperature, i.e., methane, acetylene, and VC, samples were added to vials using Precision Lok gas-tight syringes (Precision Sampling Corp., Baton Rouge, LA). Formate was added in the form of sodium formate to an initial concentration of 20 mM from a stock solution of 500 mM. The appropriate amount of chlorinated solvents to add was calculated using following dimensionless Henry's constants: VC, 1.262 (35); t-DCE, 0.474; and TCE, 0.458 (40). For methane and acetylene, dimensionless Henry's constants of 27.02 and 0.87, respectively, were used (26, 35).
Measurement of Michaelis-Menten parameters of vinyl chloride and trans-dichloroethylene degradation.
A procedure described previously (21) was used to measure Vmax and Ks for the degradation of vinyl chloride and t-DCE by M. trichosporium OB3b cells expressing pMMO and vinyl chloride by M. trichosporium OB3b cells expressing sMMO. Specifically, M. trichosporium OB3b was grown to mid-exponential phase (optical density at 600 nm [OD600] of 0.75 to 0.8) and then diluted to an OD600 of ∼0.25 with prewarmed nitrate mineral salt medium with the same amount of copper as the initial growth medium. The cells were then allowed to grow to an OD600 of 0.3. To normalize rates to biomass, the protein concentrations were measured using the Bio-Rad protein assay kit with bovine serum albumin as a standard. After methane was removed from the growth flasks by evacuating and reequilibrating the flasks with air at least 10 times, 3-ml aliquots were then transferred to 20-ml serum vials, and 20 mM formate was added as sodium formate. The vials were then capped with Teflon-coated rubber butyl stoppers (National Scientific Co., Duluth, GA) and crimp sealed with aluminum caps. Triplicate samples were prepared for all degradation assays. For analysis of t-DCE degradation, aqueous concentrations from 28 to 222 μM were used for both pMMO- and sMMO-expressing cells. For the analysis of VC degradation, aqueous concentrations from 8 to 153 μM and 8 to 383 μM were used for pMMO- and sMMO-expressing cells, respectively. After adding either VC or t-DCE, the vials were incubated at 30°C with shaking at 270 rpm. The initial rates of degradation were determined by using a time interval from 0 to 3 min for VC degradation by M. trichosporium OB3b cells expressing sMMO and from 0 to 40 min for VC degradation by M. trichosporium OB3b cells expressing pMMO. Furthermore, a 30-min time frame from 0 to 30 min was used to measure the initial rates of t-DCE degradation by M. trichosporium OB3b cells expressing pMMO. An automated headspace sampler (Tekmar 7000; Tekmak Co., Cincinnati, OH) was used to inject samples onto an HP 5890 Series II gas chromatograph with a flame ionization detector and a 75 m DB-624 column with a 0.53-mm internal diameter (J&W Scientific Co.). The temperatures of the injector, oven, and detector were 160, 210, and 250°C, respectively, with an N2 carrier gas rate of 39 ml · min−1. Nonlinear regression analysis of whole-cell kinetics was performed using KaleidaGraph v.4.0 (Synergy Software).
Effect of chlorinated solvents on cell growth.
M. trichosporium OB3b cells were grown to the late exponential growth phase (OD600 of ∼0.8 as measured using a Spec20 apparatus [Milton Roy, Co., Ivyland, PA]) and then diluted to an OD600 of 0.04 to 0.05 with the appropriate prewarmed fresh medium (i.e., either not amended with copper or with 20 μM copper as CuCl2). The cells were then allowed to grow to an OD600 of 0.06 to ensure active growth before chlorinated ethenes were added. Methane was then removed from the flasks by evacuating the flasks 10 times and allowing air to reequilibrate after each evacuation. Five-milliliter aliquots were then aseptically transferred into specially constructed 32.5-ml serum vials created by attaching a 12-ml Pyrex test tube to 20-ml GC headspace analysis serum vials. The design enabled the continuous noninvasive measurement of growth using a Spec20 apparatus and ensured gas-tight systems for the measurement of methane and chlorinated solvents when capped with Teflon-coated butyl-rubber stoppers (National Scientific Co., Duluth, GA). Formate was then added as sodium formate to achieve an initial concentration of 20 mM, and the vials were capped with Teflon-coated butyl-rubber stoppers and crimp sealed. Using a gas-tight Dynatech A-2 syringe, 5 ml of the headspace was then removed and replaced with 5 ml of methane to achieve an initial concentration of 270 μM in solution. Various amounts of VC, t-DCE, and TCE were then added to achieve aqueous concentrations ranging from 10 to 100 μM.
Experimental measurement of methane and chlorinated ethene concentrations.
Immediately after the addition of chlorinated ethenes, 100-μl headspace samples were taken using Precision Lok gas-tight syringes for confirmation of initial concentrations of all substrates using the following GC configuration: HP 5890 series II gas chromatograph with a flame ionization detector with a 75 m DB-624 0.53-mm-internal-diameter column, with injector, oven, and detector temperatures set at 160, 80, and 250°C, respectively, and an N2 carrier gas rate of 39 ml · min−1. The vials were then incubated at 30°C with shaking (260 rpm) until the stationary growth phase, as measured using a Spec20 apparatus, was reached. Methane and chlorinated ethene concentrations in the sample vials were then determined by again taking 100-μl headspace samples using Precision Lok gas-tight syringes and analyzed as described above using an HP 5890 gas chromatograph. Before and after each experiment, a naphthalene assay specific for sMMO activity (7) was performed on all samples to verify what form of MMO was active.
Analysis of substrate and product toxicity associated with VC, t-DCE, and TCE.
To determine if substrate and/or product toxicity occurred during the incubation with mixtures of VC, t-DCE, and TCE, 5 mM methanol was used as a growth substrate to avoid competition for binding to pMMO and sMMO. Five-milliliter aliquots of cells were prepared using the same methods as those used for growth experiments, and 20 mM formate was added. The vials were then capped with Teflon-coated butyl-rubber stoppers and crimp sealed, and 100 μM each of the chlorinated solvents was added. In some vials, 100 μM acetylene was also added as a general inactivator of MMO to monitor the possibility of substrate toxicity associated with these concentrations of chlorinated ethenes. Acetylene (100 μM) was chosen, as complete inactivation of both sMMO and pMMO expressed by M. trichosporium OB3b cells was observed at this level in previous studies (30). Growth was monitored via OD600 measurements, as described above, for 30 h.
Modeling of simultaneous pollutant and growth substrate binding.
In the study of rubisco, it is common to characterize the ratio of carbon dioxide and oxygen turnover by different forms of rubisco with the substrate specificity factor, or Ω:
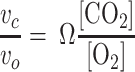 |
(1) |
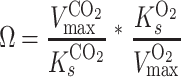 |
(2) |
where  and
and  represent the maximum velocity of carbon dioxide and oxygen turnover, respectively, and
  and
and  are the half-saturation constants for the binding of carbon dioxide and oxygen by rubisco, respectively. Equation 1 is useful when one considers pseudo-first-order rates to be applicable (i.e., both carbon dioxide and oxygen concentrations are much less than
  and
and  , respectively).
This can be extended to situations where pollutants compete for binding with an obligate growth substrate during bioremediation. In the case of a single pollutant or nongrowth substrate, equation 1 can simply be rewritten as follows:
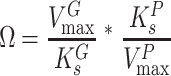 |
(3) |
where  and
and  are the maximum velocities of growth substrate and pollutant transformation, respectively, and
  and
and  are the half-saturation constants for binding of growth substrate and pollutant. This equation can also be easily broadened to consider mixtures of n pollutants all bound by the same enzyme in the presence of the growth substrate as follows:
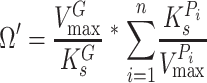 |
(4) |
This concept of specificity for pollutant degradation can be very useful, as it is a simple methodology that can provide some useful preliminary information as to how specific different enzymatic systems might behave/respond in any given pollution situation.
The concept of Ω and Ω′, although useful, does not explicitly consider the growth of cells during long time periods, which is imperative for continued pollutant degradation. Such growth will depend on the relative rate of growth substrate versus pollutant turnover, which will be a function of the relative concentration of growth substrates and pollutants. One method to do this would be to consider the relative ratio of growth versus pollutant transformation, as is implied in equation 1 for rubisco. This equation, however, is limited to low substrate concentrations. A broader model would be based on simple Michaelis-Menten kinetics:
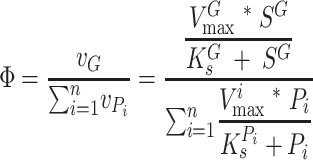 |
(5) |
Here, the dimensionless values of Φ can range from near zero (in the near absence of growth substrate) to near infinity (in the near absence of pollutant). Finally, a third model giving a dimensionless number that is potentially useful as a predictive tool that considers the net rate of growth substrate turnover in the presence of pollutants competing for binding can be constructed as follows:
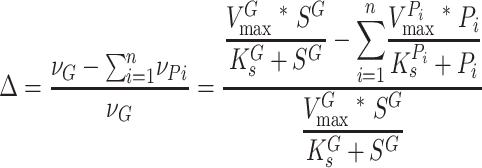 |
(6) |
The values of Δ can vary from 1 (i.e., no pollutants present) to less than zero (i.e., the rates of pollutant turnover are greater than that of growth substrate turnover).
RESULTS
Calculation of Ω′, Φ, and Δ for mixtures of chlorinated solvents for Methylosinus trichosporium OB3b cells expressing either sMMO or pMMO.
To determine the effects of mixtures of pollutants on methanotrophic growth, the kinetic parameters shown in Table 1 were used for evaluating M. trichosporium OB3b cells expressing either pMMO or sMMO. These values were determined in the presence of formate, as it is well-known that reductant limitation can affect chlorinated ethylene degradation by methanotrophs expressing either form of MMO. Using these values, if one assumes that M. trichosporium OB3b is exposed to a mixture of methane, VC, t-DCE, and TCE, an Ω′ value of 32 is calculated for these cells when expressing pMMO, and a value of 5.3 is calculated for these cells when expressing sMMO. Such a large difference suggests that M. trichosporium OB3b cells expressing pMMO would be able to grow better in the presence of these solvents than when expressing sMMO due to a higher affinity for methane.
TABLE 1.
Michaelis-Menten kinetics of chlorinated ethylene degradation by M. trichosporium OB3b cells expressing either pMMO or sMMO
| Enzyme | Substrate | Vmax (nmol · min−1 · mg protein−1) | Ks (μM) | Reference or source |
|---|---|---|---|---|
| pMMO | CH4 | 82 | 8.3 | 32 |
| VC | 42 | 26 | This study | |
| t-DCE | 61 | 42 | This study | |
| TCE | 4.1 | 7.9 | 32 | |
| sMMO | CH4 | 726a | 92 | 36 |
| VC | 2,100 | 160 | This study | |
| t-DCE | 662a | 148 | 36 | |
| TCE | 580a | 145 | 36 |
Converted from reported units of nmol · min−1 · mg cells−1 assuming that the cell dry weight is 50% protein.
To consider the effect of pollutant concentration on the specificity of M. trichosporium OB3b for binding methane, one can calculate values of Φ and/or Δ. If one assumes the maximal rate of methane oxidation (i.e., very high concentrations of methane) with various equimolar amounts of VC, t-DCE, and TCE ranging from 0 to 100 μM, the trends in Fig. 1A and B can be generated for Φ and Δ, respectively. As can be seen in Fig. 1, a greater difference is seen between sMMO- and pMMO-expressing cells when Δ is calculated. For this reason, further discussion will focus on this model to compare the ability of M. trichosporium OB3b cells to grow in the presence of various amounts of VC, t-DCE, and TCE as well as how much of these compounds is degraded during active growth.
FIG. 1.

Selectivity of M. trichosporium OB3b cells expressing either pMMO and sMMO for methane in the presence of various equimolar amounts of vinyl chloride, trans-dichloroethylene, and trichloroethylene. (A) Predicted specificity for cells expressing either pMMO (solid lines) or sMMO (dashed lines) using the Φ model (i.e., the ratio of the predicted methane oxidation rate and the sum of chlorinated ethene oxidation rates). (B) Predicted specificity for cells expressing either pMMO (solid lines) or sMMO (dashed lines) using the Δ model (i.e., the rate of predicted methane oxidation less the sum of chlorinated ethene oxidation rates normalized to the rate of methane oxidation).
Growth of M. trichosporium OB3b cells in the presence of chlorinated solvents, VC, t-DCE, and TCE.
Growth of M. trichosporium OB3b cells expressing either MMO in the presence of various concentrations of chlorinated solvents is shown in Fig. 2A and B and is summarized in Table 2. For initial development and validation of the Δ model proposed here, equimolar amounts of VC, t-DCE, and TCE were used, although the Δ model allows the use of any combination of growth substrate and cometabolic pollutant concentrations. In these experiments, formate was also added at an initial level of 20 mM to prevent any limitation of reducing equivalents from affecting the turnover of VC, t-DCE, and TCE. From these experiments, it is apparent and expected that the growth of both pMMO- and sMMO-expressing cells decreased with increased concentrations of each chlorinated solvent. It should be stressed that the relative growth rates, defined as μ/μ0, where μ is the specific growth rate measured during active growth as observed in Fig. 2 and μ0 is the specific growth rate in the absence of solvents, were always higher for M. trichosporium OB3b cells expressing pMMO regardless of the amount of solvents added. It is also interesting that in the presence of either 10 or 30 μM VC, t-DCE, and TCE, the maximal cell densities for both sMMO- and pMMO-expressing cells were equivalent, although at higher concentrations, cells expressing sMMO grew to significantly lower densities.
FIG. 2.

Growth of M. trichosporium OB3b cells expressing either (A) pMMO or (B) sMMO in the presence of various equimolar amounts of VC, t-DCE, and TCE. Symbols: ×, methane only (positive control); ▴, 10 μM each of VC, t-DCE, and TCE; ⧫, 30 μM each of VC, t-DCE, and TCE; ▪, 50 μM each of VC, t-DCE, and TCE; •, 100 μM each of VC, t-DCE, and TCE. Error bars represent the ranges of duplicate samples. Where error bars are not visible, the symbol size is greater than the measured range.
TABLE 2.
Growth and extent of pollutant degradation by M. trichosporium OB3b cells expressing either pMMO or sMMO in the presence of various amounts of VC, t-DCE, and TCE
| Enzyme | Substrate(s) | μ (h−1) (SD)a | μ/μ0 (SD)a | Max OD600 |
|---|---|---|---|---|
| pMMO | CH4 | 0.052 (0.005) | 1.0 | 0.51 |
| CH4 + 10 μM each VC, t-DCE, and TCE | 0.030 (0.002) | 0.58 (0.07) | 0.43 | |
| CH4 + 30 μM each VC, t-DCE, and TCE | 0.036 (0.001) | 0.69 (0.07) | 0.50 | |
| CH4 + 50 μM each VC, t-DCE, and TCE | 0.018 (0.0005) | 0.35 (0.04) | 0.42 | |
| CH4 + 100 μM each VC, t-DCE, and TCE | 0.014 (0.0005) | 0.27 (0.03) | 0.27 | |
| sMMO | CH4 | 0.064 (0.004) | 1.0 | 0.49 |
| CH4 + 10 μM each VC, t-DCE, and TCE | 0.025 (0.001) | 0.39 (0.03) | 0.40 | |
| CH4 + 30 μM each VC, t-DCE, and TCE | 0.031 (0.001) | 0.48 (0.03) | 0.42 | |
| CH4 + 50 μM each VC, t-DCE, and TCE | 0.016 (0.001) | 0.25 (0.02) | 0.20 | |
| CH4 + 100 μM each VC, t-DCE, and TCE | 0.007 (0.001) | 0.11 (0.02) | 0.14 |
Numbers in parentheses represent the standard deviations of collected samples.
Degradation of VC, t-DCE, and TCE during growth of M. trichosporium OB3b.
The slower growth rates exhibited by sMMO-expressing cells are likely due to the faster oxidation rates for VC, t-DCE, and VC by these cells during growth. As shown in Table 3, each of these compounds was completely degraded by sMMO-expressing cells when initial concentrations were either 10 or 30 μM. At these concentrations, pMMO-expressing cells degraded only VC and t-DCE completely, with a significant amount of TCE remaining (60 to 70%). The broader substrate range and reduced competition with methane apparently enabled sMMO-expressing cells to degrade a larger fraction of the added solvents than pMMO-expressing cells at these initial values.
TABLE 3.
Extent of pollutant degradation by M. trichosporium OB3b cells expressing either pMMO or sMMO in the presence of various amounts of VC, t-DCE, and TCE during active growth
| Enzyme | Substrate(s) | % Pollutant degraded (range)a |
Degradation time (h) | ||
|---|---|---|---|---|---|
| VC | t-DCE | TCE | |||
| pMMO | CH4 | ||||
| CH4 + 10 μM each VC, t-DCE, and TCE | 100 (0) | 100 (0) | 31 (3) | 65 | |
| CH4 + 30 μM each VC, t-DCE, and TCE | 100 (0) | 100 (0) | 39 (1) | 60 | |
| CH4 + 50 μM each VC, t-DCE, and TCE | 97 (1) | 98 (1) | 35 (9) | 110 | |
| CH4 + 100 μM each VC, t-DCE, and TCE | 79 (1) | 74 (1) | 33 (4) | 100 | |
| sMMO | CH4 | ||||
| CH4 + 10 μM each VC, t-DCE, and TCE | 100 (0) | 100 (0) | 100 (0) | 80 | |
| CH4 + 30 μM each VC, t-DCE, and TCE | 100 (0) | 100 (0) | 100 (0) | 80 | |
| CH4 + 50 μM each VC, t-DCE, and TCE | 97 (0) | 97 (0) | 74 (1) | 100 | |
| CH4 + 100 μM each VC, t-DCE, and TCE | 60 (4) | 63 (4) | 39 (6) | 150 | |
Numbers in parentheses represent the range from duplicate samples.
At initial concentrations of either 50 or 100 μM of these chlorinated ethylenes, neither pMMO- nor sMMO-expressing cells completely degraded these compounds during active growth. In the presence of 100 μM VC, t-DCE, and TCE, pMMO-expressing cells actually degraded more of the compounds than sMMO-expressing cells and did so over a shorter time frame. It appears that the greater specificity of pMMO-expressing cells for methane allowed a faster growth rate, which, over time, resulted in more pollutant degradation.
Substrate and product toxicity.
To determine if either substrate or product toxicity associated with chlorinated ethylenes may have been affecting the growth of pMMO- and sMMO-expressing cells of M. trichosporium OB3b, a series of experiments was performed to monitor the growth of such cells in the presence and absence of acetylene, a known potent inhibitor of MMO activity. In these experiments, methanol was added as the growth substrate instead of methane to prevent any competitive binding to either pMMO or sMMO that could obfuscate the findings. Furthermore, formate was added to prevent any limitation of reducing equivalents occurring during the oxidation of the chlorinated ethylenes.
As can be seen in Fig. 3, in the presence of 100 μM each of VC, t-DCE, and TCE, no growth over 30 h was observed in cells with active pMMO (i.e., not acetylene treated). If these cells were treated with acetylene, however, they did grow in the presence of these chlorinated ethylenes but to a lesser degree than if the cells were grown in the presence of methanol and acetylene only (significant at a 95% level using a Student's t test). Collectively, these results indicate that the growth of M. trichosporium OB3b cells expressing pMMO in the presence of these chlorinated ethylenes was significantly reduced from toxic products generated from the oxidation of these compounds but that the compounds were also toxic at these concentrations.
FIG. 3.

Analysis of effects of product versus substrate toxicity on growth of M. trichosporium OB3b cells expressing either pMMO or sMMO while exposed to 100 μM each of VC, t-DCE, and TCE. Methanol (5 mM) was added as the growth substrate to avoid competition for binding to either MMO, and 20 mM formate was also added to prevent reductant limitation affecting turnover rates of chlorinated ethenes. Acetylene (100 μM) was added in some cases to inactivate the MMOs. Growth was measured after 30 h. □, initial OD600; ▧, methanol only; ▨, methanol plus acetylene; ░⃞, methanol plus VC, t-DCE, and TCE; ▪, methanol plus VC, t-DCE, TCE, and acetylene. Error bars represent the ranges of duplicate samples.
For sMMO-expressing cells of M. trichosporium OB3b, it is again clear that product toxicity was a major factor in limiting growth in the presence of 100 μM each of VC, t-DCE, and TCE. Specifically, as shown in Fig. 3, no growth was seen after 30 h in the presence of these compounds in the absence of acetylene. Growth was observed, however, following the addition of acetylene to inactivate sMMO. Also, as found for pMMO-expressing cells, substrate toxicity observed as growth in the presence of these solvents and acetylene was less than that in the presence of methanol and acetylene (significant at a 95% level using a Student's t test). It is also interesting that the addition of acetylene to sMMO-expressing cells without chlorinated solvents enhanced growth on methanol. This indicates that the sMMO can effectively bind methanol and oxidize it as previously observed (11), possibly to formaldehyde, which inhibits cell growth.
DISCUSSION
When one considers the broad range of substrates oxidized by methanotrophs expressing sMMO and the relatively fast kinetics of pollutant degradation (Table 1), it may appear that methanotroph-mediated bioremediation should emphasize the use of sMMO. Although a great deal of research has examined how cells, when grown under sMMO-expressing conditions (i.e., no added copper), degrade a wide range of halogenated hydrocarbons both separately and in mixtures (5, 8, 9, 36, 37), there have been no empirical data showing how methanotrophs, when expressing either sMMO or pMMO, grow in the presence of mixtures of chlorinated solvents and if degradation is limited over time due to poor growth. From the growth and degradation studies presented here, it is clear that pMMO-expressing cells can actually grow faster in the presence of high concentrations of chlorinated ethylenes and degrade more of these compounds than cells expressing sMMO, most likely due to such greater growth. Such inhibition of growth is due to the greater ability of sMMO-expressing cells to bind and transform cometabolic substrates, which not only is of no benefit to the cells but also results in the consumption of reducing equivalents and the formation of toxic products.
Collectively, these data suggest that in mixed waste systems where methanotroph-mediated biodegradation is being stimulated, those cells expressing pMMO may actually be predominant, as they are better able to tolerate the presence of cometabolites, and may play a significant role in remediating such sites, particularly if the initial concentrations of cometabolic pollutants are high. This hypothesis, if true, would also imply that remediation strategies for sites with high pollutant concentrations should purposefully stimulate pMMO expression until the pollutant concentrations are reduced to the point whereby sMMO-expressing cells can effectively bind methane to support their growth. In this approach, the “tortoise,” or pMMO-expressing cell, is initially used, as the “hare,” or sMMO-expressing cell, exhausts itself from its quick, yet counterproductive, oxidation of the cometabolic pollutants.
The question that then arises is when is it better to utilize a kinetically slow process that enables prolonged degradation versus a faster yet shorter-lived process that can result in less pollutant degradation overall? A methodology based on Δ analysis can provide at least a preliminary assessment. As discussed above and as shown in Fig. 1B, when one considers the net rate of growth substrate turnover in the presence of pollutants, different enzymatic systems will have different profiles, and at some point, negative values are predicted, depending on the amount of cometabolic substances present. For the analysis shown in Fig. 1B, this occurs when M. trichosporium OB3b cells expressing sMMO or pMMO are exposed to either 30 or 97 μM each of VC, t-DCE, and TCE. As shown in Fig. 2 and Tables 2 and 3, although growth of M. trichosporium OB3b cells expressing sMMO was significantly reduced in the presence of as little as 10 μM each of VC, t-DCE, and TCE, these compounds were completely degraded when as much as 30 μM each was provided. If the initial concentration of each solvent was increased to 50 μM, however, not only was growth affected, but so was the degradation of the cometabolites. The growth of M. trichosporium OB3b cells expressing pMMO was also significantly impacted by the presence of as little as 10 μM each of VC, t-DCE, and TCE, but the degradation of these compounds during growth was not significantly affected until at least 100 μM of each solvent was added. Thus, it appears that a simple analysis based on Michaelis-Menten kinetics can provide useful information as to what microbial process can be expected to be more effective for pollutant removal in specific situations.
A general question that cannot be adequately addressed here, but that is worthy of discussion, is what does the differential specificity for methane between pMMO- and sMMO-expressing cells mean for the temporal and spatial distribution and activity of these cells? It has been argued that neither system can support growth under ambient conditions given the laboratory measurement of Michaelis-Menten kinetic parameters (16). This can be implied as meaning that other sources are utilized for growth, as suggested previously (22, 27, 28). Recently, one methanotroph, Methylocella silvestris BL2, has been identified as being facultative (13), indicating that a “sloppy” metabolism may be advantageous. It is also interesting that this cell, as well as other Methylocella species, appears to possess the sMMO only (13, 14, 39). Alternatively, it may be that a more specific system that is able to generate the most energy for anabolic reactions would be more beneficial. In these studies, this question was not addressed, as the focus was on pollutant degradation by methanotrophs, but these findings suggest that similar issues may be important in more pristine environments and may be a reason for the apparent redundancy in the MMO systems found in some methanotrophs.
Acknowledgments
Support from the Horace H. Rackham Graduate School and the Office of Vice President for Research (University of Michigan) is gratefully acknowledged.
Footnotes
Published ahead of print on 29 September 2006.
REFERENCES
- 1.Alvarez-Cohen, L., and P. L. McCarty. 1991. Product toxicity and cometabolic competitive inhibition modeling of chloroform and trichloroethylene transformation by methanotrophic resting cells. Appl. Environ. Microbiol. 57:1031-1037. [DOI] [PMC free article] [PubMed] [Google Scholar]
- 2.Alvarez-Cohen, L., and P. L. McCarty. 1991. A cometabolic biotransformation model for halogenated aliphatic compounds exhibiting product toxicity. Environ. Sci. Technol. 25:228-235. [Google Scholar]
- 3.Arp, D. J., C. M. Yeager, and M. R. Hyman. 2001. Molecular and cellular fundamentals of aerobic cometabolism of trichloroethylene. Biodegradation 12:81-103. [DOI] [PubMed] [Google Scholar]
- 4.Ayoubi, P. J., and A. R. Harker. 1998. Whole-cell kinetics of trichloroethylene degradation by phenol hydroxylase in a Ralstonia eutropha JMP134 derivative. Appl. Environ. Microbiol. 64:4353-4356. [DOI] [PMC free article] [PubMed] [Google Scholar]
- 5.Aziz, C. E., G. Georgiou, and G. E. Speitel. 1999. Cometabolism of chlorinated solvents and binary chlorinated solvent mixtures using M. trichosporium OB3b PP358. Biotechnol. Bioeng. 65:100-107. [DOI] [PubMed] [Google Scholar]
- 6.Bouwer, E. J., and P. L. McCarty. 1983. Transformations of 1- and 2-carbon halogenated organic compounds under methanogenic conditions. Appl. Environ. Microbiol. 45:1286-1294. [DOI] [PMC free article] [PubMed] [Google Scholar]
- 7.Brusseau, G. A., H. C. Tsien, R. S. Hanson, and L. P. Wackett. 1990. Optimization of trichloroethylene oxidation by methanotrophs and the use of a colorimetric assay to detect soluble methane monooxygenase activity. Biodegradation 1:19-29. [DOI] [PubMed] [Google Scholar]
- 8.Chang, H. L., and L. Alvarez-Cohen. 1996. Biodegradation of individual and multiple chlorinated aliphatic hydrocarbons by methane-oxidizing cultures. Appl. Environ. Microbiol. 62:3371-3377. [DOI] [PMC free article] [PubMed] [Google Scholar]
- 9.Chang, W.-K., and C. S. Criddle. 1997. Experimental evaluation of a model for cometabolism: prediction of simultaneous degradation of trichloroethylene and methane by a methanotrophic mixed culture. Biotechnol. Bioeng. 56:492-501. [DOI] [PubMed] [Google Scholar]
- 10.Choi, D. W., R. C. Kunz, E. S. Boyd, J. D. Semrau, W. E. Antholine, J.-I. Han, J. A. Zahn, J. M. Boyd, A. M. de la Mora, and A. A. DiSpirito. 2003. The membrane-associated methane monooxygenase (pMMO) and pMMO-NADH:quinone oxidoreductase complex from Methylococcus capsulatus Bath. J. Bacteriol. 185:5755-5764. [DOI] [PMC free article] [PubMed] [Google Scholar]
- 11.Colby, J., D. I. Stirling, and H. Dalton. 1977. Soluble methane mono-oxygenase of Methylococcus capsulatus (Bath): its ability to oxygenate n-alkanes, n-alkenes, ethers, and alicyclic, aromatic and heterocyclic compounds. Biochem. J. 165:395-402. [DOI] [PMC free article] [PubMed] [Google Scholar]
- 12.Coleman, N. V., T. E. Mattes, J. M. Gossett, and J. C. Spain. 2002. Biodegradation of cis-dichloroethene as the sole carbon source by a β-proteobacterium. Appl. Environ. Microbiol. 68:2726-2730. [DOI] [PMC free article] [PubMed] [Google Scholar]
- 13.Dedysh, S. N., C. Knief, and P. F. Dunfield. 2005. Methylocella species are facultatively methanotrophic. J. Bacteriol. 187:4665-4670. [DOI] [PMC free article] [PubMed] [Google Scholar]
- 14.Dedysh, S. N., W. Liesack, V. N. Khmelenina, N. E. Suzina, Y. A. Trotsenko, J. D. Semrau, A. M. Bares, N. S. Panikov, and J. M. Tiedje. 2000. Methylocella palustris gen. nov., sp. nov., a new methane-oxidizing bacterium from peat bogs representing a novel subtype of serine pathway methanotrophs. Int. J. Syst. Evol. Microbiol. 50:955-969. [DOI] [PubMed] [Google Scholar]
- 15.DiStefano, T. D., J. M. Gossett, and S. H. Zinder. 1991. Reductive dechlorination of high concentrations of tetrachloroethene to ethene by an anaerobic enrichment culture in the absence of methanogenesis. Appl. Environ. Microbiol. 57:2287-2292. [DOI] [PMC free article] [PubMed] [Google Scholar]
- 16.Dunfield, P. F., W. Liesack, T. Henckel, R. Knowles, and R. Conrad. 1999. High-affinity methane oxidation by a soil enrichment culture containing a type II methanotroph. Appl. Environ. Microbiol. 65:1009-1114. [DOI] [PMC free article] [PubMed] [Google Scholar]
- 17.Ely, R. L., K. J. Williamson, M. R. Hyman, and D. J. Arp. 1997. Cometabolism of chlorinated solvents by nitrifying bacteria: kinetics, substrate interactions, toxicity effects, and bacterial response. Biotechnol. Bioeng. 54:520-534. [DOI] [PubMed] [Google Scholar]
- 18.Ensley, B. D. 1991. Biochemical diversity of trichloroethylene metabolism. Annu. Rev. Microbiol. 45:283-299. [DOI] [PubMed] [Google Scholar]
- 19.Fries, M. E., L. J. Forney, and J. M. Tiedje. 1997. Phenol- and toluene-degrading microbial populations from an aquifer in which successful trichloroethylene cometabolism occurred. Appl. Environ. Microbiol. 63:1523-1530. [DOI] [PMC free article] [PubMed] [Google Scholar]
- 20.Futamata, H., S. Harayama, and K. Watanabe. 2001. Group-specific monitoring of phenol hydroxylase genes for a functional assessment of phenol-stimulated trichloroethylene bioremediation. Appl. Environ. Microbiol. 67:4671-4677. [DOI] [PMC free article] [PubMed] [Google Scholar]
- 21.Han, J. I., S. Lontoh, and J. D. Semrau. 1999. Degradation of chlorinated and brominated hydrocarbons by Methylomicrobium album BG8. Arch. Microbiol. 172:393-400. [DOI] [PubMed] [Google Scholar]
- 22.Han, J. I., and J. D. Semrau. 2000. Chloromethane stimulates growth of Methylomicrobium album BG8 on methanol. FEMS Microbiol. Lett. 187:77-81. [DOI] [PubMed] [Google Scholar]
- 23.Hanson, R. S., and T. E. Hanson. 1996. Methanotrophic bacteria. Microbiol. Rev. 60:439-471. [DOI] [PMC free article] [PubMed] [Google Scholar]
- 24.Hartmans, S., and J. A. M. deBont. 1992. Aerobic vinyl chloride metabolism in Mycobacterium aurum L1. Appl. Environ. Microbiol. 58:1220-1226. [DOI] [PMC free article] [PubMed] [Google Scholar]
- 25.Holliger, C., G. Wohlfarth, and G. Diekert. 1998. Reductive dechlorination in the energy metabolism of anaerobic bacteria. FEMS Microbiol. Rev. 22:383-398. [Google Scholar]
- 26.Howard, P. H., and W. H. Meylan. 1997. Handbook of physical properties of organic chemicals. CRC Lewis, Boca Raton, Fla.
- 27.Jensen, S., A. Priemé, and L. Bakken. 1998. Methanol improves methane uptake in starved methanotrophic bacteria. FEMS Microbiol. Lett. 20:331-335. [DOI] [PMC free article] [PubMed] [Google Scholar]
- 28.Knief, C., and P. F. Dunfield. 2005. Response and adaptation of different methanotrophic bacteria to low methane mixing ratios. Environ. Microbiol. 7:1307-1317. [DOI] [PubMed] [Google Scholar]
- 29.Laing, W. A., W. L. Ogren, and, R. H. Hageman. 1974. Regulation of soybean net photosynthetic CO2 fixation by interaction of CO2, O2, and ribulose 1,5-diphosphate carboxylase. Plant Physiol. 54:678-685. [DOI] [PMC free article] [PubMed] [Google Scholar]
- 30.Lontoh, S. 2000. Substrate oxidation by methanotrophs expressing particulate methane monooxygenase (pMMO): a study of whole-cell oxidation of trichloroethylene and its potential use for environmental remediation. Ph.D. thesis. University of Michigan, Ann Arbor.
- 31.Lontoh, S., A. A. DiSpirito, and J. D. Semrau. 1999. Dichloromethane and trichloroethylene inhibition of methane oxidation by the membrane-associated methane monooxygenase of Methylosinus trichosporium OB3b. Arch. Microbiol. 171:301-308. [Google Scholar]
- 32.Lontoh, S., and J. D. Semrau. 1998. Methane and trichloroethylene degradation by Methylosinus trichosporium OB3b expressing particulate methane monooxygenase. Appl. Environ. Microbiol. 64:1106-1114. [DOI] [PMC free article] [PubMed] [Google Scholar]
- 33.Maymó-Gatell, X., T. Anguish, and S. H. Zinder. 1999. Reductive dechlorination of chlorinated ethenes and 1,2-dichloroethane by “Dehalococcides ethenogenes” 195. Appl. Environ. Microbiol. 65:3108-3113. [DOI] [PMC free article] [PubMed] [Google Scholar]
- 34.Maymó-Gatell, X., I. Nijenhuis, and S. H. Zinder. 2001. Reductive dechlorination of cis-1,2-dichloroethene and vinyl chloride by “Dehalococcides ethenogenes”. Environ. Sci. Technol. 35:516-521. [DOI] [PubMed] [Google Scholar]
- 35.Morel, F. M., and J. G. Hering. 1991. Principles and applications of aquatic chemistry. John Wiley & Sons, New York, N.Y.
- 36.Oldenhuis, R., J. Y. Oedzes, J. J. Van der Waarde, and D. B. Janssen. 1991. Kinetics of chlorinated hydrocarbon degradation by Methylosinus trichosporium OB3b and toxicity of trichloroethylene. Appl. Environ. Microbiol. 57:7-14. [DOI] [PMC free article] [PubMed] [Google Scholar]
- 37.Oldenhuis, R., R. L. Vink, D. B. Janssen, and B. Witholt. 1989. Degradation of chlorinated aliphatic hydrocarbons by Methylosinus trichosporium OB3b expressing soluble methane monooxygenase. Appl. Environ. Microbiol. 55:2819-2826. [DOI] [PMC free article] [PubMed] [Google Scholar]
- 38.Semprini, L. 1997. In situ transformation of halogenated aliphatic compounds under anaerobic conditions, p. 429-450. In C. H. Ward, J. A. Cherry, and M. R. Scalf (ed.), Subsurface restoration. Ann Arbor Press, Chelsea, Mich.
- 39.Theisen, A. R., M. H. Ali, S. Radajewski, M. G. Dumont, P. F. Dunfield, I. R. McDonald, S. N. Dedysh, C. B. Miguez, and J. C. Murrell. 2005. Regulation of methane oxidation in the facultative methanotroph, Methylocella silvestris BL2. Mol. Microbiol. 58:682-692. [DOI] [PubMed] [Google Scholar]
- 40.Tse, G., H. Orbey, and S. I. Sandler. 1992. Infinite dilution activity coefficients and Henry's law coefficients of some priority water pollutants determined by a relative gas chromatographic method. Environ. Sci. Technol. 26:2017-2022. [Google Scholar]
- 41.Vannelli, T., M. Logan, D. M. Arciero, and A. B. Hooper. 1990. Degradation of halogenated aliphatic compounds by the ammonia-oxidizing bacterium Nitrosomonas europaea. Appl. Environ. Microbiol. 56:1169-1171. [DOI] [PMC free article] [PubMed] [Google Scholar]
- 42.Vogel, T. M., and P. L. McCarty. 1985. Biotransformation of tetrachloroethylene, dichloroethylene, vinyl chloride, and carbon dioxide under methanogenic conditions. Appl. Environ. Microbiol. 49:1080-1083. [DOI] [PMC free article] [PubMed] [Google Scholar]
- 43.Wackett, L. P., and S. R. Householder. 1989. Toxicity of trichloroethylene to Pseudomonas putida F1 is mediated by toluene dioxygenase. Appl. Environ. Microbiol. 55:2723-2725. [DOI] [PMC free article] [PubMed] [Google Scholar]
- 44.Wackett, L. P. 1995. Bacterial co-metabolism of halogenated organic compounds, p. 217-241. In Y. L. Young and C. L. Cerniglia (ed.), Microbial transformation and degradation of toxic organic compounds. Wily-Liss, New York, N.Y.
- 45.Westrick, J. J., K. D. Phillips, and J. F. Wilkinson. 1984. The groundwater supply survey. J. Am. Water Works Assoc. 76:52-59. [Google Scholar]
- 46.Whittenbury, R. K., K. D. Philips, and J. F. Wilkinson. 1970. Enrichment, isolation, and characterization of methane-utilizing bacteria. J. Gen. Microbiol. 61:205-218. [DOI] [PubMed] [Google Scholar]