

Abstract
Genotyping methods for Plasmodium falciparum drug efficacy trials have not been standardized and may fail to accurately distinguish recrudescence from new infection, especially in high transmission areas where polyclonal infections are common. We developed a simple method for genotyping using previously identified microsatellites and capillary electrophoresis, validated this method using mixtures of laboratory clones, and applied the method to field samples. Two microsatellite markers produced accurate results for single-clone but not polyclonal samples. Four other microsatellite markers were as sensitive as, and more specific than, commonly used genotyping techniques based on merozoite surface proteins 1 and 2. When applied to samples from 15 patients in Burkina Faso with recurrent parasitemia after treatment with sulphadoxine-pyrimethamine, the addition of these four microsatellite markers to msp1 and msp2 genotyping resulted in a reclassification of outcomes that strengthened the association between dhfr 59R, an anti-folate resistance mutation, and recrudescence (P = 0.31 versus P = 0.03). Four microsatellite markers performed well on polyclonal samples and may provide a valuable addition to genotyping for clinical drug efficacy studies in high transmission areas.
INTRODUCTION
Clinical trials of anti-malarial drug efficacy against Plasmodium falciparum often require genotyping techniques to differentiate whether recurrent parasitemia after therapy is caused by recrudescence of the original infection or to newly infecting parasites. The distinction is important, because recrudescence implies failure of the drug treatment, whereas a new infection does not. Diversity within the P. falciparum genome enables useful comparison of genotypes from pretreatment samples with samples collected at the time of recurrent parasitemia. If paired samples have the same geno-types, the treatment outcome is classified as a recrudescence. If they have different genotypes, the outcome is classified as a new infection. Different methods have been used to classify outcomes when paired samples have both the same and different alleles. No standardized approach to genotyping exists, and different strategies may have a large effect on the results of efficacy trials.1
The most commonly used genotyping method involves amplifying family-specific alleles of the polymorphic genes merozoite surface protein 1 (msp1) and merozoite surface protein 2 (msp2) using nested polymerase chain reaction (PCR) and gel electrophoresis.2 Interpretation of agarose gels has been shown to vary significantly even when performed repeatedly by the same individual.3 When pretreatment and recurrent parasitemia samples are compared with each other, genotypes of two unrelated strains may appear the same by chance alone, leading to the misclassification of a new infection as a recrudescence. Such misclassification is dependent on the number of molecular markers used in genotyping, the population diversity of the molecular markers, and the number of strains present in an individual infection. Misclassification may also occur when minority strains are not detected or when false-positive alleles are detected. Compared with low transmission areas such as Southeast Asia, where genotyping techniques were first developed, and patients are typically infected with one or a few strains, misclassification is more likely to occur in areas of high transmission intensity where infections with multiple strains are common.1 Misclassification of genotyping outcomes will lead to inaccurate estimates of drug efficacy, compromise the ability to compare results from different studies, and limit studies aimed at identifying risk factors for drug resistance.
The accuracy of genotyping may be improved by increasing the number of molecular markers assessed. Other polymorphic genes with large repeats that have been evaluated for this purpose, such as circumsporozoite protein and glutamine-rich protein, can be characterized with gel electrophoresis, but show less diversity then msp1 and msp2. Microsatellites, or simple sequence repeats, have been used for studies of population structure4 and are good candidates for additional markers. Hundreds have been described,5 they are generally not under immune selection, and the sizes of alleles fall at predictable, discrete lengths that may enable easy comparison across multiple samples and laboratories. By measuring the size of microsatellites with capillary electrophoresis, which has a resolution of one nucleotide and is highly reproducible, the full diversity of length polymorphisms present in a population can be used. The use of microsatellite markers has been explored in two drug efficacy trials,6,7 but has not, to our knowledge, been validated using polyclonal controls.
We designed a new method for genotyping P. falciparum microsatellites, including an automated algorithm for interpreting results, and optimized the technique for conditions likely to be encountered in clinical samples from highly endemic areas. We validated this method on genomic DNA samples of P. falciparum laboratory clones prepared from dried blood spots on filter paper and compared the results to a commonly used genotyping method using msp1 and msp2. Finally, we applied this method to a small set of field samples and showed that adding microsatellite genotyping to msp1 and msp2 alone strengthened the association between a known molecular marker of drug resistance and recrudescence.
MATERIALS AND METHODS
Controls containing mixtures of laboratory clones
Six P. falciparum clones (3D7, FCR3, HB3, K1, W2, and V1/S) were cultured using standard methods and synchronized at the ring stage with 5% D-sorbitol.8 Parasitemia was determined using flow cytometry,9 and the concentration of red blood cells was measured with a hemocytometer. Red blood cells from cultures were mixed with uninfected whole blood to yield standardized parasite densities for each clone. Samples (35 μL) containing single clones or mixtures of up to six clones at various parasite densities (50–50,000 parasites/μL) were spotted onto filter paper (Whatman 3MM; Whatman, Clifton, NJ) and allowed to air dry. After 1 month of storage at ambient temperature, the center of each spot was removed using a 6-mm hole punch. DNA was extracted with Chelex 100 Resin (Bio-Rad Laboratories, Hercules, CA) as previously described.10
Genotyping of msp1 and msp2.
The surface antigen loci msp1 and msp2 were amplified using previously described primers.11 Briefly, 2 μL of template DNA was amplified using nested polymerase chain reaction (PCR), with second round primers specific to allelic families: K1, MAD20, and RO33 for msp1 and IC3D7 and FC27 for msp2. PCR products were separated on a 2.5% agarose gel (UltraPure Agarose; Invitrogen, Carlsbad, CA) and stained with ethidium bromide. A technician blinded to the composition of the samples used GelCompar II software (Applied Maths, Sint-Martens-Latem, Belgium) to select alleles and estimate the size of PCR products using a standardized approach.12
Genotyping of microsatellites
Twelve trinucleotide repeat microsatellite loci have been previously described for use in genotyping filter-paper blood samples.13 Of these, the six loci located on separate chromosomes with the largest heterozygosity were chosen. Primers were designed for single-round PCR using Primer3 software14 (Table 1). Forward primers were labeled at the 5′ end with either a HEX or 6-FAM fluorophore, and a 5′ GTGTCTT “tail” was added to the reverse primers to promote addition of an extra adenosine base for more uniform PCR product size.15 Reaction and cycling conditions were optimized to minimize formation of stutter peaks and maximize detection of minor alleles. Annealing temperatures were varied from 55°C to 70°C, extension temperatures were varied from 62°C to 72°C, the lengths of the denaturing, annealing, and extension steps were varied, the number of cycles was varied, different concentrations of Mg2+ and dNTP were tested, and three different polymerases were evaluated. Final reactions contained 1 μL of template DNA, 200 nmol/L of each primer, 40 μmol/L of each dNTP, 1.5 mmol/L Mg2+, 50 mmol/L KCl, 10 mmol/L Tris-HCl, and 0.4 U of AmpliTaq Gold DNA Polymerase (Applied Biosystems, Foster City, CA) in a total volume of 10 μL. PCR was performed in a Dyad thermal cycler (MJ Research, Waltham, MA) under the following conditions: 5 minutes at 94°C, 10 cycles of 20 seconds at 94°C, 30 seconds at 60°C, decreasing 0.5°/cycle, 25 seconds at 68°C, 30 cycles of 20 seconds at 94°C, 30 seconds at 55°C, 25 seconds at 68°C, and 10 minutes at 68°C.
Table 1.
Primers used to amplify microsatellites
| Marker | Forward primer (5′-3′) | Reverse primer (5′-3′)* |
|---|---|---|
| TA40 | 6FAM-TTTTGGTTTCCAAGGGATTG | gtgtcttTTAAGGCCACGAGGAAATTG |
| TA60 | HEX-CCAAGAGAAAGCGATCCTCA | gtgtcttTTTTTCCATCATATAAATTGGTATCT |
| TA81 | HEX-AGGGAAGGTGAGGAAAAGGA | gtgtcttTTCATACATTTCACACAACACAGG |
| TA87 | 6FAM-AATGGCAACACCATTCAACC | gtgtcttTTTATCGCCGAAGGGATGTA |
| PfPK2 | HEX-TCCTCAGACTGAAATGCATGA | gtgtcttCCTTTCATCGATACTACGATTATTTG |
| Polyα | HEX-TTGGGTCCATCGTCAGAAAT | gtgtcttGAACAGACCAGCCCAAAAAT |
Lowercase letters indicate 5′ sequence added to promote addition of a non-templated adenosine.
Products of the PCR reactions were diluted in water and pooled for electrophoresis. Two microliters of pooled sample was mixed with 10 μL Hi-Di formamide and 0.2 μL Genescan 400HD ROX size standard (Applied Biosystems) and denatured for 5 minutes at 95°C. Capillary electrophoresis was performed using an Applied Biosystems 3730×1 DNA Analyzer, and alleles were sized with GeneMapper software (Applied Biosystems). Only peaks that were spaced at intervals corresponding to the trinucleotide repeats (present in all six microsatellites studied) were considered as possible alleles.
In addition to the primary peak for each allele, distinct patterns of “stutter” peaks were observed for each microsatellite marker. Stutter peak formation is common during amplification of microsatellites and is primarily caused by DNA slippage during PCR at intervals equal to the size of the repeat.16 To create an objective algorithm for filtering out stutter peaks, the height ratio and relative location of observed stutter peaks to true peaks was calculated for each microsatellite. Thresholds were determined to minimize both background noise and stutter peaks while maintaining sensitivity (Appendix 1). These thresholds were automatically applied to data exported from GeneMapper using Microsoft Access (Microsoft Corp., Redmond, WA); peaks with heights below the thresholds were removed, and the remaining peaks were considered alleles. Because thresholds were set relative to the height of other peaks present in the sample, the filtering algorithm does not depend on knowledge of the sample composition and was applied independently of known sample composition.
Interpretation of alleles
Allele sizes for single-clone samples were used to guide the interpretation of alleles in polyclonal samples. For msp1 and msp2, size ranges were used for each clone, taking into account variation within and between gels. A range of 1 base was used for microsatellite alleles because sizes varied by < 0.5 base across all samples. A laboratory clone present in a sample was classified as detected if an allele of the correct size (and correct allelic family for msp1 and msp2) was recorded for that sample. Any alleles recorded for a sample that did not correspond to clones present were designated false-positive alleles.
Genotyping of field samples
To evaluate these methods on clinical isolates, we genotyped filter-paper blood samples from a previously completed clinical trial in Burkina Faso.17 Paired samples from patients with recurrent parasitemia within 28 days after therapy with sulphadoxine-pyrimethamine were extracted and genotyped using the methods described above for msp1, msp2, and microsatellites. For msp1 and msp2, alleles from original and recrudescent samples were considered a match if they were within 10 bp in size. For microsatellites, alleles were considered a match if they were within 1 base in size. A recurrent parasitemia sample was considered a recrudescence if at least one allele matched at every locus tested, and a new infection if no allele matched in at least one locus tested. Outcomes were classified using msp1 and msp2 alone and also with the addition of microsatellites. In addition, all pretreatment samples were evaluated for the presence of the dhfr 59R mutation using previously published methods.18 The association between dhfr 59R and recrudescence was measured using Fisher exact test.
RESULTS
Performance on polyclonal controls
All six microsatellite markers worked well in identifying the correct alleles in samples containing a single laboratory clone. However, two of the six markers were unreliable in situations where more than one clone was present. The marker Polyα was often unable to detect more than two alleles present in a sample; TA87 frequently produced false-positive alleles when multiple clones were present (data not shown). These two markers were therefore discarded, and the data are presented are for msp1, msp2, and the remaining four microsatellite markers (TA40, TA60, TA81, and PfPK2).
Ability to detect clones in controls
For each DNA sample, observed alleles were compared with the known composition of laboratory clones using two methods: 1) nested amplification of msp1 and msp2 followed by gel electrophoresis of amplified fragments and 2) amplification of four microsatellites followed by capillary electrophoresis (Table 2; more detailed results are available in Appendix 2).
Table 2.
Ability to detect alleles of laboratory clones
| Correct laboratory clones detected per sample* |
|||||||
|---|---|---|---|---|---|---|---|
| Sample composition | Total parasite density | msp1 | msp2 | TA40 | TA60 | TA81 | PfPK2 |
| Single clone | 50–50,000 parasites/μL | 1 | 1 | 1 | 1 | 1 | 1 |
| Three clones, ratio of 1:2:7 | 10,000 parasites/μL | 2–3 | 3 | 3 | 3 | 3 | 2–3 |
| 50,000 parasites/μL | 2–3 | 3 | 3 | 3 | 2–3 | 2–3 | |
| Six clones, equal ratios | 300 parasites/μL | 5 | 5 | 6 | 6 | 6 | 6 |
| 3,000 parasites/μL | 6 | 5 | 6 | 6 | 6 | 6 | |
| 30,000 parasites/μL | 6 | 5 | 6 | 6 | 6 | 6 | |
| Six clones, various ratios (individual clones present at 5% to 60% of total parasite density) | 30,000–50,000 parasites/μL | 5–6 | 4–6 | 5–6 | 5–6 | 5–6 | 5–6 |
Bold, all clones present were detected in samples in that category.
msp1 and msp2
When only one clone was present per sample, genotypes of both msp1 and msp2 detected the correct allele in all samples at concentrations as low as 50 parasites/μL (0.001% parasitemia). When multiples clones were present, msp1 genotyping sometimes missed one allele, whereas msp2 genotyping sometimes missed one to two alleles. Missed alleles frequently corresponded to clones at the lowest density relative to others of the same allelic family. Alleles with smaller sizes were preferentially detected. Thus, larger alleles present at low proportions were the most likely to be missed (Figure 1). Samples containing the same ratios of clones but different parasite densities generally gave similar results.
Figure 1.
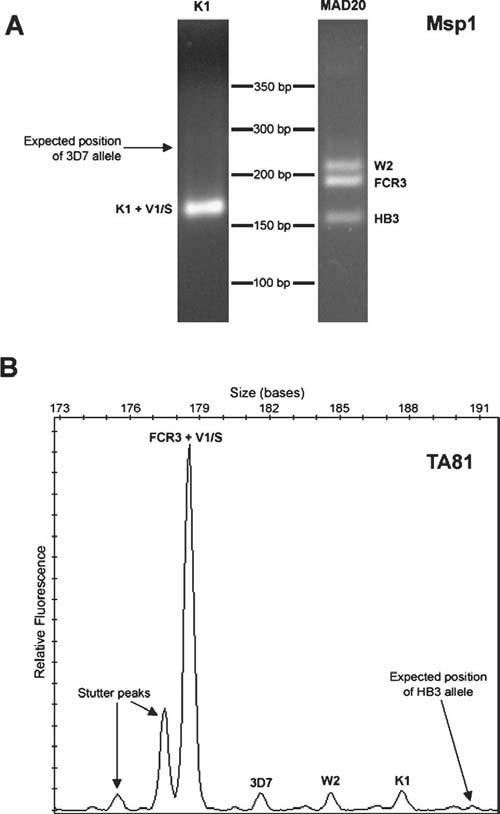
Examples of missed alleles for msp1 and a microsatellite marker from a sample containing all six clones at the following parasite densities (parasites/μL): 3D7 (2,500), FCR3 (2,500), HB3 (2,500), K1 (10,000), W2 (2,500), V1/S (30,000). (A) Agarose gel images of K1- and MAD20-type family-specific PCR products for msp1. An arrow indicates the expected position of the missed 3D7 allele. (B) Electropherogram for microsatellite TA81. An arrow indicates the expected position of the missed HB3 allele. The stutter peaks were correctly filtered by the allele detection algorithm.
Microsatellites
The correct alleles of all single-clone samples were detected by all four microsatellite markers. When multiple clones were present, all four markers occasionally missed one allele (Table 2). A similar number of alleles were missed by the microsatellite markers and by msp1 and msp2 genotyping. The factors contributing to missed alleles were similar for the microsatellites as for msp1 and msp2: a low proportion of parasites and larger allele size were associated with missing an allele (Figure 1).
Detection of false-positive alleles in controls
Observed alleles not expected based on the known composition of laboratory clones were designated false-positive alleles.
msp1 and msp2
False-positive alleles were frequently detected using msp1 and msp2 genotyping (Table 3; Figure 2; more detailed results are in Appendix 3). In single-clone samples, msp1 genotyping detected no false-positive alleles, and msp2 genotyping detected zero to two false-positive alleles. When multiple clones were present, msp1 genotypes contained up to one false-positive allele, and msp2 genotypes always contained one to three false-positive alleles. No pattern was detected that could reliably predict the occurrence of false-positive alleles.
Table 3.
Detection of alleles not corresponding to clones present in samples
| False-positive alleles detected per sample* |
|||||||
|---|---|---|---|---|---|---|---|
| Sample composition | Total parasite density | msp1 | msp2 | TA40 | TA60 | TA81 | PfPK2 |
| Single clone | 50–50,000 parasites/μL | 0 | 0–2 | 0–1 | 0 | 0 | 0 |
| Three clones, ratio of 1:2:7 | 10,000 parasites/μL | 0–1 | 1–3 | 0–1 | 0 | 0 | 0–3 |
| 50,000 parasites/μL | 0–1 | 3 | 0–1 | 0 | 0 | 0–3 | |
| Six clones, equal ratios | 300 parasites/μL | 0 | 3 | 0 | 0 | 0 | 1 |
| 3,000 parasites/μL | 1 | 3 | 0 | 0 | 0 | 0 | |
| 30,000 parasites/μL | 1 | 3 | 0 | 0 | 0 | 0 | |
| Six clones, various ratios (individual clones present at 5% to 60% of total parasite density) | 30,000–50,000 parasites/μL | 0–1 | 1–2 | 0–2 | 0 | 0 | 0–4 |
Bold, no false-positive alleles were detected in samples in that category.
Figure 2.
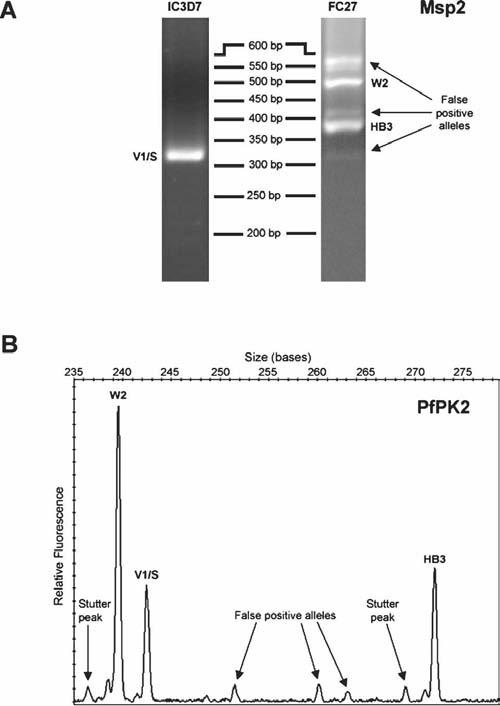
Examples of false positive alleles for msp2 and a microsatellite marker from a sample containing three clones at the following parasite densities (parasites/μL): HB3 (35,000), W2 (10,000), V1/S (5,000). (A) Agarose gel images of IC3D7- and FC27-type family-specific PCR products for msp2. (B) Electropherogram for microsatellite PfPK2. The stutter peaks were correctly filtered by the allele detection algorithm. Arrows in both A and B indicate PCR products identified as false-positive alleles that did not correspond to any clones present in the sample.
Microsatellites
Fewer false-positive alleles were detected by the four microsatellite markers than by msp1 and msp2 genotyping. TA60 and TA81 produced no false-positive alleles in any sample. In single-clone samples, TA40 occasionally produced one false-positive allele. In samples containing multiple clones, TA40 occasionally detected one to two and PfPK2 detected one to four false-positive alleles. False-positive alleles included small random peaks and rare stutter peaks above defined thresholds (Figure 2).
Field samples
In Burkina Faso, dhfr 59R is the primary mutation associated with resistance to sulphadoxinepyrimethamine. Patients without this mutation would not be expected to fail therapy. Classifying outcomes based on the results of msp1 and msp2 alone, four of seven patients presenting with parasites containing the dhfr 59R mutation experienced recrudescence versus two of eight patients presenting without the mutation (57% versus 25%, P = 0.31). When outcomes were reclassified adding microsatellite data, four of seven patients with dhfr 59R were considered recrudescent versus zero of eight patients without the mutation (57% versus 0%, P = 0.03).
DISCUSSION
Genotyping P. falciparum using surface antigen loci and agarose gel electrophoresis may be inadequate to accurately distinguish recrudescence from new infection in high transmission areas where polyclonal infections are common. Additional methods are needed and require validation under conditions similar to those encountered in field studies. In this study, msp1, msp2, and new methods for genotyping six microsatellite markers correctly detected the alleles of singleclone samples. Two of the microsatellite markers (Polyα and TA87) were inaccurate for polyclonal samples, showing the importance of validating new genotyping techniques on these types of samples. The other four microsatellite markers performed at least as well as msp1 and msp2 in correctly identifying alleles present in filter-paper blood samples containing multiple strains of P. falciparum and produced fewer false-positive alleles. Finally, we showed that the addition of these four microsatellites to msp1 and msp2 genotyping in a small number of field samples strengthened the association between a known molecular marker of drug resistance and recrudescence.
Because our control samples were artificial mixtures of laboratory clones, we observed trends but cannot precisely estimate the probability of failing to detect alleles for field isolates collected from a clinical trial. Missed alleles occurred at a similar frequency for the four microsatellite markers as for msp1 and msp2, suggesting that these microsatellite methods are as sensitive for detecting minority alleles in polyclonal samples. As seen previously,3,19 relative densities of clones strongly influenced detection at all six loci, and larger alleles were more likely to be missed.20 The greater size differences between msp1 and msp2 alleles than those of microsatellites may have counterbalanced the sensitivity advantage of family-specific PCR,21 resulting in similar rates of detection overall. Although not observed in this study, it is also possible that our microsatellite genotyping method may miss a strain by inappropriately filtering out a minority allele that is at the same size as a stutter peak.
False-positive alleles were detected at msp1, msp2, and two of the four microsatellites (TA40 and PfPK2), with msp2 producing more false-positive alleles than other loci. For msp1 and msp2, false-positive alleles may have been caused by primer or product carry-over from the first round of PCR, heteroduplex formations detected as additional bands,22 recombination during PCR resulting in formation of chimeric products,23 DNA strand slippage during PCR, or PCR contamination. False-positive alleles at TA40 and PfPK2 could have been created by the same factors except for carry-over, because our microsatellite PCR was not nested, and hetero-duplex formation, because capillary electrophoresis was performed under denaturing conditions. Some or all of these factors are likely to influence the accuracy of any PCR-based genotyping system.
In choosing the most appropriate methods for genotyping a clinical drug efficacy trial, characteristics of both the genotyping techniques and the study site need to be considered. The probability of two independent strains having the same geno-type depends on the diversity of the genetic loci assessed and the ability of the genotyping technique to measure that diversity. When unrelated strains appear the same, new infections may be misclassified as recrudescence. When more strains are simultaneously present, such as in sub-Saharan Africa, the probability of this misclassification increases. One way we have attempted to adjust for this problem in the past has been to classify sample pairs containing both matched and unmatched alleles as new infections.12 However, the persistence of even one of a number of strains originally present may suggest drug failure and would ideally define recrudescence.2 When using multiple loci, a recrudescence should be defined as the presence of at least one matched allele at every locus; if at least one locus shows only unmatched alleles, the outcome should be classified as a new infection. By increasing both the resolution of the genotyping method and the number of loci assessed, discriminatory power may be increased enough to enable use of these definitions. Increased resolution enables the detection of small differences between strains at a given locus, and adding additional loci further increases the probability of detecting genetic differences between strains because they may have the same genotype at one locus but have detectable differences at another.
Using these definitions, missing alleles in genotypes from drug efficacy trials can lead to the misclassification of a recrudescence as a new infection. For example, a minority allele present in a pretreatment sample may be missed, especially if it is larger in size than the dominant allele(s). If the corresponding parasite strain is the only one able to survive drug therapy and causes recurrent parasitemia, the recurrence will be classified as a new infection, even if the allele is only missed at one locus. For this reason, the increase in discrimination afforded by adding additional loci needs to be balanced with the increased risk of misclassifying a recrudescence as a new infection if alleles are missed at those loci. False-positive alleles, on the other hand, can lead to misclassification of a new infection as a recrudescence at a particular locus. Adding an additional locus, however, will not increase the chance of misclassifying a new infection as a recrudescence, even if false-positive alleles are present at that locus.
By adding four microsatellite loci to msp1 and msp2 geno-typing in a small set of field samples, we reclassified two outcomes from recrudescence to new infection. Both patients with reclassified outcomes presented with wild-type alleles at the dhfr 59 locus and would not have been expected to fail therapy with sulphadoxine-pyrimethamine. The increase in strength of association between the mutant allele dhfr 59R and recrudescence after adding the microsatellite loci (P = 0.31 versus P = 0.03) shows that a change in even a small number of genotyping outcomes may improve the ability to identify risk factors for drug resistance.
Our microsatellite genotyping method offers a number of advantages over genotyping using surface antigen loci and agarose gel electrophoresis. Paired clinical samples genotyped using agarose gels need to be run in adjacent lanes on the same gel to make meaningful comparisons, given the large variability in size measurements across gels. The precise sizing of capillary electrophoresis and discrete allele sizes of microsatellites make comparisons between multiple samples evaluated at different times and across different laboratories possible. The high resolution of capillary electrophoresis also enables measurement of the full diversity present at these loci; in contrast, with agarose gels, a resolution of 6 bp7 limits the ability to measure allelic diversity. Analysis of agarose gel results is inherently subjective3; our method, relying on a simple algorithm for determining true alleles, is more objective and minimizes investigator bias. Finally, our method differs from most surface antigen and microsatellite genotyping techniques in that it does not depend on nested PCR. This decreases the probability of contamination, eliminates the problem of artifact from first-round primer or product carryover, and saves on time and reagent costs. Capillary electrophoresis has the disadvantage of not being available in many resource-poor settings. However, it is available in most research centers that perform automated DNA sequencing, and at our institution, the cost of analyzing four microsatellite loci is similar to that of genotyping msp1 and msp2 when all re-agent costs are considered. The additional cost we incurred in genotyping four microsatellites for our field samples was $1.51/sample.
Choosing the optimal method of genotyping samples from a P. falciparum clinical drug efficacy trial requires knowledge of the performance and limitations of genotyping techniques when applied to a particular setting. In areas where polyclonal infections are common, additional loci may need to be added to commonly used genotyping techniques to accurately distinguish recrudescence from new infection. We have proposed an efficient and objective method for genotyping four independent loci that compares favorably with existing techniques and may aid in the interpretation of results from drug efficacy trials, especially in regions of high endemicity where rates of both polyclonal infections and new infections during follow up are high. We are currently in the process of applying this method to a large number of field samples from different sites to determine the optimal combination of markers, including microsatellites, msp1, and msp2, for use in different epidemiologic settings.
Supplementary Material
Acknowledgments
The authors thank Jiri Gut, Jennifer Legac, and Sarah Baxter for culturing parasites and performing flow cytometry.
Footnotes
Note: Supplemental material appears online at www.ajtmh.org.
Financial support: Support was provided from the National Institutes of Allergy and Infectious Disease (AI052142), Fogarty International Center/National Institutes of Health (TW00007), and the Doris Duke Charitable Foundation. P.J.R. is a Doris Duke Charitable Foundation Distinguished Clinical Scientist.
REFERENCES
- 1.Slater M, Kiggundu M, Dokomajilar C, Kamya MR, Bakyaita N, Talisuna A, Rosenthal PJ, Dorsey G. Distinguishing recrudescences from new infections in antimalarial clinical trials: Major impact of interpretation of genotyping results on estimates of drug efficacy. Am J Trop Med Hyg. 2005;73:256–262. [PubMed] [Google Scholar]
- 2.Snounou G, Beck HP. The use of PCR genotyping in the assessment of recrudescence or reinfection after antimalarial drug treatment. Parasitol Today. 1998;14:462–467. doi: 10.1016/s0169-4758(98)01340-4. [DOI] [PubMed] [Google Scholar]
- 3.Farnert A, Arez AP, Babiker HA, Beck HP, Benito A, Bjorkman A, Bruce MC, Conway DJ, Day KP, Henning L, Mercereau-Puijalon O, Ranford-Cartwright LC, Rubio JM, Snounou G, Walliker D, Zwetyenga J, do Rosario VE. Genotyping of Plasmodium falciparum infections by PCR: A comparative multicentre study. Trans R Soc Trop Med Hyg. 2001;95:225–232. doi: 10.1016/s0035-9203(01)90175-0. [DOI] [PubMed] [Google Scholar]
- 4.Anderson TJ, Haubold B, Williams JT, Estrada-Franco JG, Richardson L, Mollinedo R, Bockarie M, Mokili J, Mharakurwa S, French N, Whitworth J, Velez ID, Brockman AH, Nosten F, Ferreira MU, Day KP. Microsatellite markers reveal a spectrum of population structures in the malaria parasite Plasmodium falciparum. Mol Biol Evol. 2000;17:1467–1482. doi: 10.1093/oxfordjournals.molbev.a026247. [DOI] [PubMed] [Google Scholar]
- 5.Su X, Wellems TE. Toward a high-resolution Plasmodium falciparum linkage map: polymorphic markers from hundreds of simple sequence repeats. Genomics. 1996;33:430–444. doi: 10.1006/geno.1996.0218. [DOI] [PubMed] [Google Scholar]
- 6.Nyachieo A, Van Overmeir C, Laurent T, Dujardin JC, D'Alessandro U. Plasmodium falciparum genotyping by microsatellites as a method to distinguish between recrudescent and new infections. Am J Trop Med Hyg. 2005;73:210–213. [PubMed] [Google Scholar]
- 7.Mwangi JM, Omar SA, Ranford-Cartwright LC. Comparison of microsatellite and antigen-coding loci for differentiating recrudescing Plasmodium falciparum infections from reinfections in Kenya. Int J Parasitol. 2006;36:329–336. doi: 10.1016/j.ijpara.2005.10.013. [DOI] [PubMed] [Google Scholar]
- 8.Jensen JB. In vitro culture of Plasmodium parasites. Methods Mol Med. 2002;72:477–488. doi: 10.1385/1-59259-271-6:477. [DOI] [PubMed] [Google Scholar]
- 9.Musonda CC, Taylor D, Lehman J, Gut J, Rosenthal PJ, Chibale K. Application of multi-component reactions to antimalarial drug discovery. Part 1: Parallel synthesis and antiplasmodial activity of new 4-aminoquinoline Ugi adducts. Bioorg Med Chem Lett. 2004;14:3901–3905. doi: 10.1016/j.bmcl.2004.05.063. [DOI] [PubMed] [Google Scholar]
- 10.Plowe CV, Djimde A, Bouare M, Doumbo O, Wellems TE. Pyrimethamine and proguanil resistance-conferring mutations in Plasmodium falciparum dihydrofolate reductase: Polymerase chain reaction methods for surveillance in Africa. Am J Trop Med Hyg. 1995;52:565–568. doi: 10.4269/ajtmh.1995.52.565. [DOI] [PubMed] [Google Scholar]
- 11.Zwetyenga J, Rogier C, Tall A, Fontenille D, Snounou G, Trape JF, Mercereau-Puijalon O. No influence of age on infection complexity and allelic distribution in Plasmodium falciparum infections in Ndiop, a Senegalese village with seasonal, mesoendemic malaria. Am J Trop Med Hyg. 1998;59:726–735. doi: 10.4269/ajtmh.1998.59.726. [DOI] [PubMed] [Google Scholar]
- 12.Cattamanchi A, Kyabayinze D, Hubbard A, Rosenthal PJ, Dorsey G. Distinguishing recrudescence from reinfection in a longitudinal antimalarial drug efficacy study: comparison of results based on genotyping of msp-1, msp-2, and glurp. Am J Trop Med Hyg. 2003;68:133–139. [PubMed] [Google Scholar]
- 13.Anderson TJ, Su XZ, Bockarie M, Lagog M, Day KP. Twelve microsatellite markers for characterization of Plasmodium falciparum from finger-prick blood samples. Parasitology. 1999;119:113–125. doi: 10.1017/s0031182099004552. [DOI] [PubMed] [Google Scholar]
- 14.Rozen S, Skaletsky H. Primer3 on the WWW for general users and for biologist programmers. Methods Mol Biol. 2000;132:365–386. doi: 10.1385/1-59259-192-2:365. [DOI] [PubMed] [Google Scholar]
- 15.Brownstein MJ, Carpten JD, Smith JR. Modulation of nontemplated nucleotide addition by Taq DNA polymerase: primer modifications that facilitate genotyping. Biotechniques. 1996;20:1004–1006. doi: 10.2144/96206st01. 1008–1010. [DOI] [PubMed] [Google Scholar]
- 16.Shinde D, Lai Y, Sun F, Arnheim N. Taq DNA polymerase slippage mutation rates measured by PCR and quasi-likelihood analysis: (CA/GT)n and (A/T)n microsatellites. Nucleic Acids Res. 2003;31:974–980. doi: 10.1093/nar/gkg178. [DOI] [PMC free article] [PubMed] [Google Scholar]
- 17.Zongo I, Dorsey G, Rouamba N, Dokomajilar C, Lankoande M, Ouedraogo JB, Rosenthal PJ. Amodiaquine, sulfadoxine-pyrimethamine, and combination therapy for uncomplicated falciparum malaria: A randomized controlled trial from burkina faso. Am J Trop Med Hyg. 2005;73:82–832. [PubMed] [Google Scholar]
- 18.Duraisingh MT, Curtis J, Warhurst DC. Plasmodium falciparum: Detection of polymorphisms in the dihydrofolate reductase and dihydropteroate synthetase genes by PCR and restriction digestion. Exp Parasitol. 1998;89:1–8. doi: 10.1006/expr.1998.4274. [DOI] [PubMed] [Google Scholar]
- 19.Jafari S, Le Bras J, Bouchaud O, Durand R. Plasmodium falciparum clonal population dynamics during malaria treatment. J Infect Dis. 2004;189:195–203. doi: 10.1086/380910. [DOI] [PubMed] [Google Scholar]
- 20.Walsh PS, Erlich HA, Higuchi R. Preferential PCR amplification of alleles: mechanisms and solutions. PCR Methods Appl. 1992;1:241–250. doi: 10.1101/gr.1.4.241. [DOI] [PubMed] [Google Scholar]
- 21.Snounou G, Zhu X, Siripoon N, Jarra W, Thaithong S, Brown KN, Viriyakosol S. Biased distribution of msp1 and msp2 allelic variants in Plasmodium falciparum populations in Thailand. Trans R Soc Trop Med Hyg. 1999;93:369–374. doi: 10.1016/s0035-9203(99)90120-7. [DOI] [PubMed] [Google Scholar]
- 22.Thompson JR, Marcelino LA, Polz MF. Heteroduplexes in mixed-template amplifications: Formation, consequence and elimination by ‘reconditioning PCR’. Nucleic Acids Res. 2002;30:2083–2088. doi: 10.1093/nar/30.9.2083. [DOI] [PMC free article] [PubMed] [Google Scholar]
- 23.Tanabe K, Sakihama N, Farnert A, Rooth I, Bjorkman A, Walliker D, Ranford-Cartwright L. In vitro recombination during PCR of Plasmodium falciparum DNA: A potential pitfall in molecular population genetic analysis. Mol Biochem Parasitol. 2002;122:211–216. doi: 10.1016/s0166-6851(02)00095-6. [DOI] [PubMed] [Google Scholar]
Associated Data
This section collects any data citations, data availability statements, or supplementary materials included in this article.