Abstract
Using real-time dual-color fluorescence detection, we have experimentally tracked individual target species during competitive DNA surface hybridization in a two-component sample. Our experimental results demonstrate displacement of the lower affinity species by the higher affinity species and corroborate recent theoretical models describing competitive DNA surface hybridization. Competition at probe sites complementary to one of the two DNA species was monitored in separate experiments for two different target pairs. Each pair differs in sequence by a single nucleotide polymorphism, and one pair includes a folding target. We propose a mechanistic interpretation of the differences between hybridization curves of targets in multi-component and single-component experiments.
Competitive surface hybridization has been implicated as a mechanism affecting the quantative interpretation of DNA microarray data, especially in the presence of single nucleotide polymorphism (1–3). Tawa et al. have analyzed composite hybridization curves (4) and suggested that errors in analysis originated from competition between two or more species. Recently, competitive hybridization between two DNA species has been modeled (5,6), demonstrating the nonlinear dynamic behavior of each species that is not observed in the composite signal.
Competition between different targets hybridizing to the same probe site produces two effects that adjust hybridization rates. The first is the reduction in binding sites due to hybridization of multiple targets, and the second is the displacement of lower affinity targets by higher affinity targets. In this Letter, we provide, to our knowledge, the first direct experimental evidence of the displacement of low affinity targets during surface hybridization by monitoring the individual components of a two-component hybridization for two model systems containing a 20 base wild-type sequence and an SNP sequence. In one of the systems used, the wild-type sequence folds. The experimental results clearly show the higher concentration species dominate the initial phase of hybridization, whereas during the second, competitive, phase, the match (i.e., higher affinity) species displaces the mismatch.
A detailed description of experimental methodology is presented in the Supplementary Material; here we provide a brief description. Hybridization experiments were carried out using quartz microscope slides with an epoxysilane surface vapor deposited in-house. Hybridization and control spots of ∼400 μm diameter were also spotted in-house. Hybridization experiments were performed at 40°C, with temperature control provided by a Peltier device. At the beginning of each experiment, a 50 μL of sample was injected into a coverslip provided by BioMicro Systems (Salt Lake City, UT). The temperature was then raised to melt any initial duplexes formed, and reduced to the hybridization temperature, at which point data collection was performed.
Real-time detection was realized using the quartz slide as an optical waveguide (7). The evanescent field produced by end-fire coupling 532 nm and 635 nm lasers allowed selective excitation of surface bound species with respect to solution fluorescence. In all experiments, the wild-type target (CGCGGGCCGCATTAATAAAC for Set 1 and CGAGGGCAGCATTAGTACAC for Set 2) was labeled with Cy-3 and the SNP target (CGCGGGCCGTATTAATAAAC for Set 1 and CGAGGGCAGCAATAGTACAC for Set 2) was labeled with Cy-5. Fluorescence was collected using a charge-coupled device camera with an attached filter wheel containing interference bandpass filters corresponding to the emission of Cy-3 and Cy-5. Intensity data obtained during hybridization experiments for Cy-3 and Cy-5 on the same spot were normalized using control spots. One control spot had labeled Cy-3 probe whereas the other had Cy-5 labeled probe; these probe sequence were not complementary to any of the sequences used for hybridization.
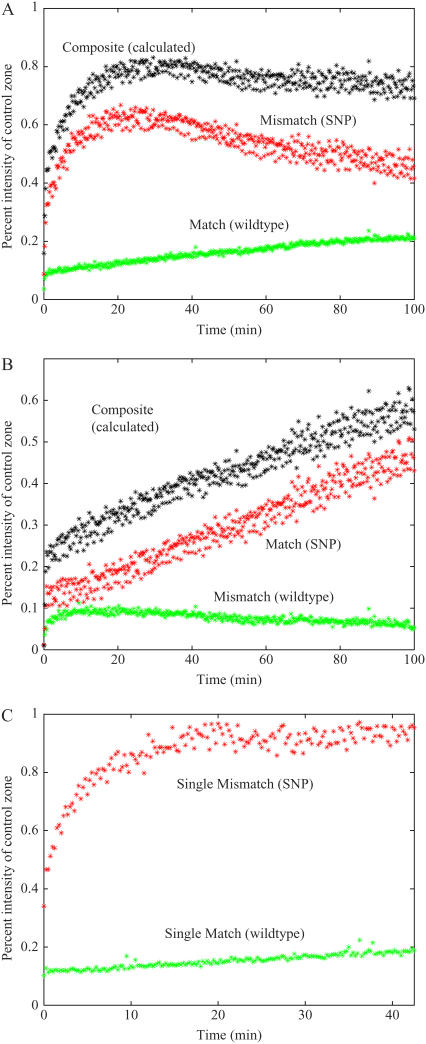
Initial experimental results were obtained from Set 1 with probe spot sequences fully complementary to either the wild-type or SNP target; equimolar concentrations of wild-type and SNP were used in a two-component sample. Note that the wild-type sequence (unlike the SNP) contains a stable folded state at 40°C, as determined by Quikfold (7), an effect that was not accounted for in our earlier modeling study (5). Fig. 1 A shows the measured individual and composite signals for hybridization to the wild-type spot. During the first phase of hybridization, the SNP dominates because of its higher “active” concentration with respect to the wild-type, as discussed below. However, when the total bound target concentration begins to approach the equilibrium value, there is a competitive regime during which the lower-affinity, SNP, is displaced by the higher-affinity, wild-type, species. This behavior was predicted from the modeling studies (5,6), and has not been observed before because only composite hybridization curves have been monitored. Similar results are obtained with a probe spot perfectly complementary for the SNP, shown in Fig. 1 B. In this case, the SNP sequence is the perfect match, and having higher “active” concentration than the folding wild-type sequence, the composite and match curves follow each other closely, whereas the displacement of the mismatch species is clearly evident.
FIGURE 1.
Real-time hybridization curves for a wild-type (30 nM, green), SNP (30 nM, red), calculated composite curve (A and B) consisting of wild-type plus SNP hybridization (black). (A) Two-component sample of wild-type (match) and SNP (mismatch) showing competitive hybridization on a spot matched to the wild-type target, the composite curve decreases slightly due to probe density difference between the control spots. (B) Two-component sample of SNP (match) and wild-type (mismatch) showing competitive hybridization on a spot matched to the SNP. (C) single component traces of match and mismatch hybridization on a spot matched to the wild-type target (overlay of two independent experiments).
An assumption sometimes is that multi-component DNA (i.e., mixed sample) hybridization can be treated as a superposition of single-component DNA hybridizations (8). Using the sequences from Set 1, we performed single-component experiments by allowing the wild-type and target SNP to hybridize to the wild type sensing zones independently. Our results demonstrate (Fig. 1 C) that there are differences in the hybridization curves between a multi-component experiment and single-component experiment. Most importantly, during the single-component experiment, the mismatch (SNP) species hybridizes to the wild-type spot with significant affinity and monotonically increases. (This result also shows that photobleaching is not the cause of signal reduction observed during two-component hybridization). During the two-component experiment, initial growth of the mismatch is followed by displacement due to competition. Therefore, interpreting the composite curve as a single component or as a superposition of single components leads to significant misquantification of the matched species and may result in false positive calls. Note, in single component experiments, the signals originate from individual hybridizations (Fig. 1 C); however, in multi-component samples, uniformly labeled by one fluorescent dye, only the composite signal is observed.
Another source of quantification error in DNA microarray experiments is the differences in folding patterns of the sequences in solution, as is common in SNP detection (9). Our experimental results show that, since the rate of folding is typically faster than hybridization (10), the effects of secondary structures can be described by a reduction in the “active” (unfolded) concentration of the folding species involved. As a result, the “active” concentration can be described as Ceff ∼ CoKeq/(1 + Keq), where Co is the total target concentration and Keq = kuf/kf = eΔG/RT. Using ΔG = −1.2 kcal/mol calculated using Quikfold (7), the “active” concentration at T = 40°C should be ∼3.8 nM if Co = 30 nM.
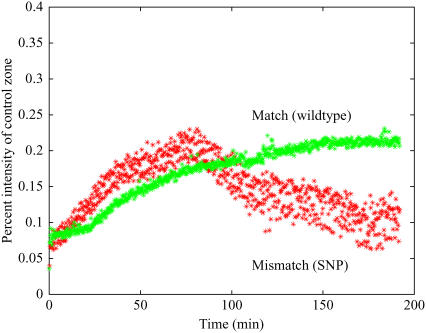
Fig. 2 shows results of two-component hybridization after accounting for the reduction of “active” wild-type concentration by decreasing the SNP concentration 10-fold. The competition appears to occur between two targets of nearly equal concentrations (5), suggesting that, due to folding, the “active” wild-type concentration is reduced by a factor of ∼10, agreeing well with the calculation.
FIGURE 2.
Individual hybridization curves for the wild-type (match 30 nM) and SNP (mismatch 3 nM) target showing competitive hybridization after compensation for the reduction of active wild-type concentration due to sequence folding. Probe was complementary to the wild-type.
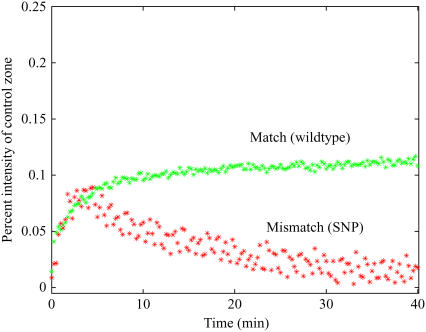
To investigate a system with no secondary structures at the experimental temperature of 40°C, we also performed experiments with Set 2. As shown in Fig. 3, for equimolar concentrations of wild-type and SNP species in a mixed sample, during the first phase of hybridization, the on rates are essentially the same, and during the second phase, competitive displacement of the mismatch occurs. However, the maximum surface concentration of the SNP remains lower than that of the wild-type target and during the displacement phase the SNP is nearly eliminated. These results further corroborate the published simulation data (5,6).
FIGURE 3.
Experimental traces of hybridization to a spot fully complementary to the wild-type sequence from Set 2 using a mixed sample of wild-type (match, green) and SNP (mismatch, red) target from Set 2 at equal concentrations of 30 nM for a system where no secondary structures are formed.
Using two-component, mixed samples we have presented the first direct experimental evidence of the kinetic competition by real-time monitoring of matched and mismatched targets at the sensing zone for two different model systems. Even though our experiments do not emulate a complete array, the effects of competitive DNA hybridization would only increase as the number of target species increases. However, our results prove that competitive displacement occurs, and is a mechanism that should be accounted for during the analysis of DNA microarray data. In cases of lower target concentrations, the trends shown would be the same, but the timescale would be elongated.
SUPPLEMENTARY MATERIAL
An online supplement to this article can be found by visiting BJ Online at http://www.biophysj.org.
Acknowledgments
This research was performed within the Center for Microarray Technology, which is supported in part by the Utah Centers of Excellence Program, National Science Foundation Career ECS-0134548, and University of Utah Technology Commercialization Project. J. Bishop is supported by a National Science Foundation fellowship (No. NSF IGERT:DGE 9987616).
References
- 1.Halperin, A., A. Buhot, and E. B. Zhulina. 2004. Sensitivity, specificity, and the hybridization isotherms of DNA chips. Biophys. J. 86:718–730. [DOI] [PMC free article] [PubMed] [Google Scholar]
- 2.Bhanot, G., Y. Louzoun, J. Zhu, and C. DeLisi. 2003. The importance of thermodynamic equilibrium for high throughput gene expression arrays. Biophys. J. 84:124–135. [DOI] [PMC free article] [PubMed] [Google Scholar]
- 3.Halperin, A., A. Buhot, and E. B. Zhulina. 2006. On the hybridization isotherms of DNA microarrays: the Langmuir model and its extensions. J. Phys. Condens. Matter. 18:S463–S490. [Google Scholar]
- 4.Tawa, K., D. Yao, and W. Knoll. 2005. Matching basepair number dependence of the kinetics of DNA-DNA hybridization studied by surface plasmon fluorescence spectroscopy. Biosens. Bioelectron. 21:322–329. [DOI] [PubMed] [Google Scholar]
- 5.Bishop, J., S. Blair, and A. M. Chagovetz. 2006. A competitive kinetic model of nucleic acid surface hybridization in the presence of point mutants. Biophys. J. 90:831–840. [DOI] [PMC free article] [PubMed] [Google Scholar]
- 6.Zhang, Y., D. A. Hammer, and D. J. Graves. 2005. Competitive hybridization kinetics reveals unexpected behavior patterns. Biophys. J. 89:2950–2959. [DOI] [PMC free article] [PubMed] [Google Scholar]
- 7.Markham, N. R., and M. Zuker. 2005. DINAMelt web server for nucleic acid melting prediction. Nucleic Acids Res. 33:W577–W581. [DOI] [PMC free article] [PubMed] [Google Scholar]
- 8.Dai, H., M. Meyer, S. Stepaniants, M. Ziman, and R. Stoughton. 2002. Use of hybridization kinetics for differentiating specific from non-specific binding to oligonucleotide microarrays. Nucleic Acids Res. 30:e86–1-8. [DOI] [PMC free article] [PubMed] [Google Scholar]
- 9.Plum, G. E., and K. J. Breslauer. 2002. Fluorescence energy transfer monitored competitive equilibria of nucleic acids: applications in thermodynamics and screening. Biopolymers. 61:214–223. [DOI] [PubMed] [Google Scholar]
- 10.Kim, J., S. Doose, H. Neuweiler, and M. Sauer. 2006. The initial step of DNA hairpin folding: a kinetic analysis using fluorescence correlation spectroscopy. Nucleic Acids Res. 34:2516–2527. [DOI] [PMC free article] [PubMed] [Google Scholar]


