Abstract
Soybean agglutinin (gSBA) is a tetrameric legume lectin, each of whose subunits are glycosylated. Earlier studies have shown that this protein shows exceptionally high stability in terms of free energy of unfolding when compared to other proteins from the same family. This article deals with the unfolding reactions of the nonglycosylated recombinant form of the protein rSBA and its comparison with the glycosylated counterpart gSBA. The nonglycosylated form features a lower stability when compared to the glycosylated form. Further, the unfolding pathways in the two are widely different. Although the glycosylated form undergoes a simple two-state unfolding, the nonglycosylated species unfolds via a compact monomeric intermediate that is not a molten globule. Representative isothermal and thermal denaturation profiles show that glycosylation accounts for a stabilization of ∼9 kcal/mol of the tetramer, whereas the difference in Tm between the two forms is 26°C. Computational studies on the glycan-protein interactions at the noncanonical interface of the protein show that quite a number of hydrogen bond and hydrophobic interactions stabilize the glycoprotein tetramer.
INTRODUCTION
Posttranslational modification is one of those events in biology that not only adorn a protein with variety but also impart it with different physicochemical properties. Protein glycosylation is more profuse and structurally more complex than all other types of posttranslational modifications taken together (1–3). Covalently bound sugars in proteins range from small monosaccharides, especially on nuclear and cytoplasmic proteins, to substantially complex molecules on extracellular N- or O-linked glycoproteins, including many lectins. Of the numerous roles credited to glycosylation the major ones are to facilitate proper folding, prevent protein aggregation, protect against proteolytic attack, and act as surface cell receptors and targeting signals (4,5). This modification involves a number of enzymes and substrates and implements numerous processing steps. A scan of the protein structure database has shown that >75% of the proteins are glycosylated in nature. Further, a statistical analysis of reported eukaryotic glycoproteins in the literature shows that the extent of N-glycosylation easily outnumbers O-glycosylation. The count of N-glycosylated proteins reported so far is 883, whereas O-glycosylated proteins only number 188. Furthermore, of these 188 proteins, 104 contain both forms of glycosylation (6). The observations that so many eukaryotic proteins are glycosylated and that N-linked glycosylation is more frequently observed in proteins suggest that N-linked glycans are a prime requisite for sustaining the structure-function equilibrium in many proteins (6). The role of glycosylation in relation to protein structure, form, and stability has been a topic of much interest for a long time. Extensive studies relating to the mechanism of glycosylation and its role in protein folding, stability, and function have been carried out by researchers in the field (7–9). In many instances, glycosylation is seen to have a remarkable effect in attaining the final functional fold of the protein, whereas in others it is seen to have little or no effect on the ultimate state of the protein. For example, the HIV 1 gp-120 protein fails to reach its final folded state in the absence of glycosylation, whereas the nonglycosylated RNase A has lower folding rates compared to its glycosylated counterpart, RNase B (10–12).Usually, glycans do not generate permanent secondary structure but trigger local conformational alterations close to the glycosylation site, particularly by inducing a β-turn at the site (13).
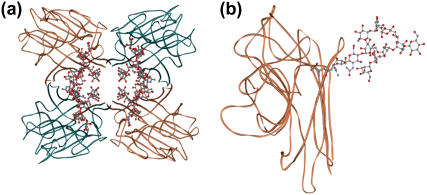
Soybean agglutinin (gSBA) is a tetrameric glycoprotein with a subunit molecular mass of 29,495 Da. The subunit has a “jelly roll” motif typical of all legume lectin monomers. This fold comprises a six-stranded back β-sheet, a curved seven-stranded front β-sheet and a five-stranded sheet that forms the roof of the molecule (14,15). Each of the subunits is glycosylated at the Asn-75 position (Fig. 1 a). The position of attachment of each of the glycans to a monomeric subunit is shown in Fig. 1 b. The glycosylation accounts for almost 6% (4.5% mannose and 1.0% glucosamine) of the mass of the lectin (16,17). Previously we have shown that the native glycoprotein exhibits unusual stability when compared to similar tetrameric legume lectins. For example, concanavalin A (Con A) shows a stability of 30–32 kcal/mol, and under identical conditions SBA shows a stability of 58 kcal/mol. It was suggested, with the help of some computational studies, that this enhanced stability of the tetramer is mainly due to glycosylation and some stabilizing ionic interactions at the oligomeric interface (18). The bacterially expressed protein (rSBA) has a molecular mass of 27,586 kDa and is devoid of covalently linked carbohydrates. A figure presenting the matrix-assisted laser desorption ionization mass spectra of the glycosylated and nonglycosylated form is shown in the Supplementary Material. However, the hemagglutinating activity and the carbohydrate specificity of rSBA are essentially identical to that of gSBA (19).
FIGURE 1.
Tertiary structure of the tetramer and monomer of soybean agglutinin. (a) The tetramer of SBA with the GlcNAc2Man9 attached showing the disposition of the glycans. (b) The monomer of SBA showing the origin of the N-linked glycans. Figures were generated using ViewerLite42.
This article reports isothermal and thermal denaturation studies on gSBA and rSBA. Although gSBA was seen to demonstrate very high conformational stability, rSBA exhibits comparatively much lower firmness to resist the structural perturbation induced by the denaturant guanidinium hydrochloride. We observe that the unfolding of gSBA is a two-state process. In contrast, the recombinant protein unfolds via an intermediate. There are significant differences in the thermal stabilities of the two forms. The recombinant form exhibits a 26°C lower Tm when compared to the glycosylated form.
MATERIALS AND METHODS
Materials
Tris (hydroxymethyl) aminomethane buffer, [N-[2-hydroxyethyl]piperazine-N'-[2-ethanesulphonic acid]] (HEPES), and guanidinium hydrochloride were from Sigma Chemical (St. Louis, MO). The other reagents used in this study were of the highest purity available. Stock solutions of guanidinium hydrochloride were prepared in 5 mM HEPES buffer, pH 7.4, and the molarity of guanidinium hydrochloride was determined by refractive index as described by Pace (20).
Protein
rSBA
The recombinant form of the lectin was prepared according to Adar et al. (19), with slight modifications. The rSBA clone that was in the pET 11b vector was transformed into Escherichia coli BL21 DE3 pLysS cells. The cells were grown and the inclusion bodies were separated out. The inclusion bodies thus obtained were precipitated using 65% ice-cold acetone. The precipitate was resuspended in 6 M guanidinium hydrochloride (in 10 mM Tris buffer (pH 7.8), 150 mM sodium chloride, 15% glycerol, 1 mM Ca2+/Mn2+, and 200 mM lactose) for 1 h with mild shaking in cold. This solution was then dialyzed against 1.5 M guanidinium hydrochloride (in 10 mM Tris buffer (pH 7.8), 150 mM sodium chloride, 15% glycerol, 1 mM Ca2+/Mn2+, and 200 mM lactose). Finally, the solution was dialyzed against TBS (Tris buffer (pH 7.8), 150 mM sodium chloride, 15% glycerol, 15 mM Ca2+/Mn2+) for 48 h to remove all the chaotrope and sugar present. An additional step of affinity purification was done using a lactosyl-Biogel column to ensure the presence of only the active, refolded molecules in the rSBA sample finally obtained (21). The protein was eventually eluted in 0.2 M lactose in 5 mM HEPES buffer, pH 7.4, containing 1 mM Ca2+/Mn2+.
gSBA
In a typical preparation, 250 g of soybean seeds were homogenized and defatted. The defatted dry meal was extracted with 20 mM phosphate buffer, pH 7.4, containing 150 mM sodium chloride (PBS) for 12 h at 4°C under constant stirring. Then it was subjected to ammonium sulfate fractionation of 30%. The precipitate was removed by centrifugation at 8000 rpm for 30 min. The supernatant was again subjected to 65% ammonium sulfate fractionation. The precipitate was collected this time by centrifugation at 8000 rpm for 45 min. The precipitate was dissolved in a minimum amount of the buffer and extensively dialyzed against the same buffer. The dialyzed solution was centrifuged at 8000 rpm for 15 min and the clear supernatant was loaded on a lactosylamine Biogel P-150 column preequilibrated with buffer (21). The column was then washed extensively with PBS till the washings had A280 < 0.005. Elution was carried out in 0.2 M lactose in PBS. The concentration of the protein solution was determined from a specific extinction coefficient of  ∼ 12.8 for SBA (22).
Isothermal guanidinium-hydrochloride-induced denaturation
Equilibrium unfolding as a function of guanidinium hydrochloride (GdnCl) concentration was monitored by fluorescence spectroscopy. Fluorescence measurements were done on a Jobin Yvon Horiba fluorometer (Jobin Yvon Spex, Cedex, France) in a 1-cm cell connected to a circulation water bath (Julabo, Seelbach, Germany). The excitation and emission wavelengths were fixed at 280 nm and 370 nm, respectively. The slit widths were 3 and 5 nm for emission and excitation, respectively. Each measurement was an average of three readings. Protein concentration used for isothermal melts in the fluorimeter was 0.8 μM. The Mn2+ and Ca2+ concentrations used were 5 mM in all the experiments unless specified otherwise.
Far-ultraviolet (UV) circular dichroism (CD) measurements were made in a 0.1-cm path length cuvette on a Jasco spectropolarimeter 715 (Jasco, Tokyo, Japan) attached to a Peltier PTC-348 WI. The spectra were collected at a scan speed of 50 nm min−1. Each data point was an average of four accumulations. The protein concentration used for far-UV CD was 13 μM.
Dynamic light-scattering studies
The dynamic light scattering measurements were done using a DynaPro-MS800 dynamic light scattering instrument (Protein Solutions, Lakewood, NJ). The protein concentration used was 0.5 mg/ml. The readings were obtained at pH 7.00 in 5 mM HEPES containing 5 mM Ca2+/Mn2+ and 154 mM NaCl) at 25°C.
ANS binding studies
ANS (1-anilino-8-naphthalene sulfonate) binding experiments were executed with both the native and recombinant protein. All the experiments were done in a Jobin Yvon Horiba fluorometer (Jobin Yvon Spex, Cedex, France) in a 1-cm water- jacketed cell using a protein concentration of 1 μM and ANS concentration of 50 μM. The samples were excited at 370 nm and emission scan was obtained from 420–520 nm.
RESULTS
Biophysical characterization of the rSBA
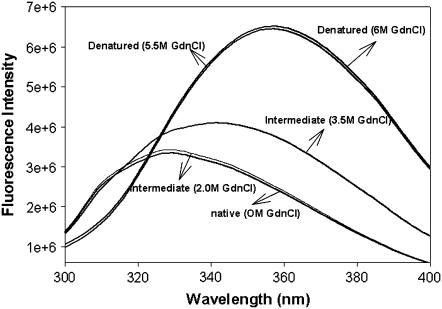
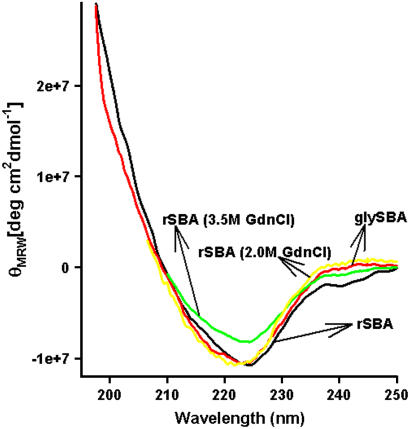
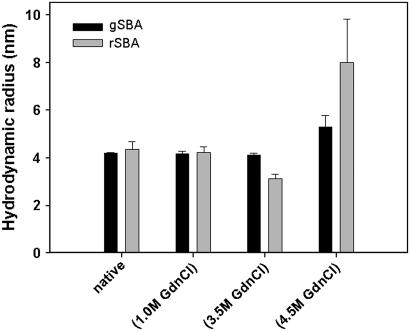
The biophysical characteristics of the rSBA are very much similar to that of the native SBA obtained from the seeds of Glycine max. When excited at 280 nm, gSBA shows a fluorescence emission maximum at 328 nm, which is red-shifted to 354 nm on denaturation with 7.5 M GdnCl, as described previously (18). The recombinant form also shows emission maxima at 327 nm for the native state and 357 nm in the completely denatured state (Fig. 2). The mean residue ellipticity of the recombinant protein was similar to that of the wild-type, suggesting that there are no major structural changes between the native glycosylated and recombinant nonglycosylated proteins (Fig. 3). The hydrodynamic radius of rSBA as obtained from dynamic light scattering studies is ∼4.35 ± 0.31nm and that of gSBA is ∼4.17 ± 0.05 nm, suggesting that there are no gross variations in the compactness of the protein and the glycans are well embedded on the protein surface (Fig. 4). Hence, combining the observations made by Adar et al. and those made by us, we may conclude that rSBA and gSBA are similar in all other respects (secondary and tertiary structure, size, and function) except for glycosylation (as shown by the difference in the matrix-assisted laser desorption ionization mass spectra in Supplementary Material, Fig. S1).
FIGURE 2.
Fluorescence emission spectra of rSBA at different denaturant concentrations. The native protein shows a λmax of 326nm, which is unchanged until 2 M GdnCl. The intermediate (at 3.5 M GdnCl) has a λmax of 336 nm with an enhanced intensity. The denatured state has a λmax of 356 nm.
FIGURE 3.
Far-UV circular dichroism spectra of rSBA and gSBA.
FIGURE 4.
Variation of hydrodynamic radii (Rh) with denaturant concentration in rSBA and gSBA. The hydrodynamic radii of both the forms is ∼4.1 nm in the native form and is retained until 1 M denaturant. At 3.5 M, GdnCl the recombinant form profiles a lower Rh of ∼3.0 nm, suggesting the formation of an intermediate, whereas that for gSBA still remains at 4.1 nm. Increasing the denaturant concentration further results in the formation of larger species, indicating denaturation of the proteins.
GdnCl-induced denaturation of rSBA and gSBA
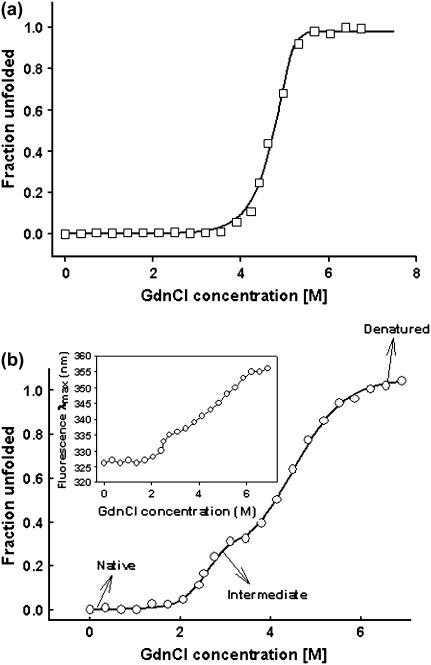
Chaotropic equilibrium denaturation profiles in which the concentration of GdnCl was increased from 0 M to 7.5 M were monitored using tryptophan fluorescence. Both the native and the recombinant forms show a difference spectrum with maxima at 370 nm, and hence this wavelength was chosen as the emission wavelength for the isothermal denaturation melts. The protein concentration used for the studies is 0.8 μM. Unlike gSBA, the refolding efficiency after unfolding rSBA with GdnCl was much less, as monitored from fluorescence emission scans. Even after increasing the metal ion concentration to as high as 30 mM, the refolding yields remain unchanged. Hence an isothermal melt at one temperature only was executed for rSBA, and for the sake of demonstration the data were fitted to a three-state unfolding model as described in the analysis section to have a quantitative idea of the thermodynamic parameters accompanying the unfolding of the recombinant nonglycosylated protein. Although gSBA unfolded via a two-state process without the formation of any unfolding intermediates, the denaturation profile of rSBA was populated with an intermediate (Fig. 5,a and b). Until 2 M denaturant concentration, rSBA showed no change in either the fluorescence emission profile or the secondary CD profile. However, on increasing the denaturant concentration further, to 3.5 M, an increase in intensity of the fluorescence emission, along with a red shift from 327 to 336 nm was observed (Fig. 2). The intermediate at 3.5 M denaturant concentration also exibits a loss in the value of the mean residue ellipticity, suggesting that there is a loss in the secondary structure of the protein (Fig. 3). However, it may also happen that at this denaturant concentration, some amount of protein has reached the completely denatured state and the loss in the ellipticity value is due to the contribution from that fraction of the denatured protein.
FIGURE 5.
Representative unfolding isotherms monitored by fluorescence of the two forms of soybean agglutinin. (a) Two-state denaturation of gSBA at a protein concentration of 0.8 μM at 20°C. (b) Three-state denaturation of rSBA at a protein concentration of 0.8 μM at 20°C. The fluorescence intensity at 370 nm was used as a probe to monitor the denaturation. (Inset) The change in fluorescence emission (λmax) of rSBA with increase in the denaturant concentration.
Dynamic light scattering studies with rSBA and gSBA
To determine the oligomeric state of the intermediate, we measured the hydrodynamic radii of rSBA at different concentrations of the denaturant. Fig. 4 shows the variation of the hydrodynamic radii of the protein at different denaturant concentrations. The polydispersity was <20% throughout the experiment. It is observed that at unperturbed condition, rSBA has a size of ∼4.35 nm and this size is retained till 1 M GdnCl. After this denaturant concentration, two peaks appear in the profile, one at ∼3.0 nm and the other at >6.0 nm. The former corresponds to that of the intermediate, whereas the latter peak represents the partially denatured population. In a previous study from the laboratory, we reported that the monomer of gSBA has a hydrodynamic radius of ∼3.0 nm (23). Hence, we can conclude that the intermediate obtained in the chaotrope-induced denaturation of rSBA is also monomeric in nature. Conversely, gSBA showed the same hydrodynamic radii until 3.5 M GdnCl, which then increased at a higher concentration of the denaturant without the appearance of any intermediate.
Thermal denaturation of rSBA and gSBA
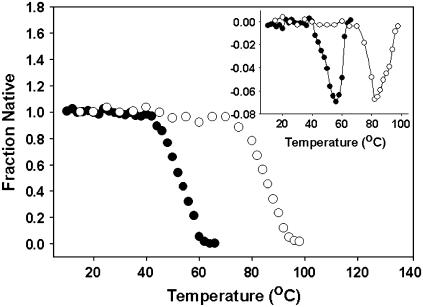
Thermal unfolding profiles of both nonglycosylated and glycosylated SBA were monitored by the change in molar ellipticity value at 218 nm at a protein concentration of 13 μM. In contrast to chaotrope-induced denaturation, thermal denaturation of both rSBA and gSBA outlined a two-state process (Fig. 6), although isothermal melt done with rSBA at this protein concentration still shows a three-state unfolding profile. Interestingly, the difference in Tm of the two forms is ∼26°C, and this estimates the extent of stability imparted by the oligosaccharide chains to the stability of gSBA. The inset in Fig. 6 shows the derivative plot of the respective thermal melts. In the case of rSBA, the derivative plot shows a minimum at 58°C, whereas in the case of gSBA the minimum is at 84°C. Thermal melts done with both rSBA and gSBA were found to be irreversible in nature, and visible aggregates were noticed at the end of the scans in either case. Hence, these scans were not employed for the calculation of the thermodynamic parameters for the unfolding of proteins.
FIGURE 6.
Thermal denaturation of rSBA and gSBA. Thermal denaturation profiles for rSBA (•) and gSBA (○) as monitored by the change in ellipticity value at 218 nm upon thermal perturbation. (Inset) The derivative plots of the representative thermal unfolding plots to derive the actual value of Tm. The Tm for rSBA is 58°C and that for gSBA is 84°C.
Molecular modeling of the SBA glycoprotein
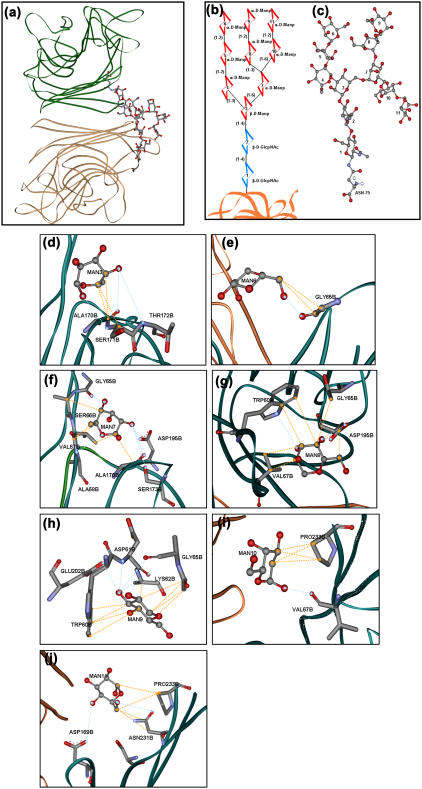
In the Protein Data Bank, none of the representative structures of soybean agglutinin show the entire covalently linked glycans. Only the 1g9f entry shows up the two proximal GlcNAc residues. To have an overall picture of the glycoprotein, the high mannose GlcNAc2Man9 glycan chain was attached with Asn-75 (Nδ2) of the protein (Protein Data Bank code 2SBA) using MOE (Molecular Operating Environment) software, and energy was minimized using a force field of AMBER99. Fig. 7 a demonstrates the dimer of the modeled glycoprotein with one covalently attached oligomannose chain. A schematic diagram with the primary structure of the glycan is shown in Fig. 7 b (16,17). This structure was modeled in SweetII (glycosciences.de) to obtain the tertiary structure of the entire glycan (Fig. 7 c). The tertiary structure thus obtained was covalently linked to the Nδ2 of Asn-75 of each of the subunits in the protein. The solvent accessibility of the Asn-75 in the tetramer is only 48% as assessed by NACCESS. Hence, not many orientations of the glycan chain upon attachment to the protein are possible and we assume that upon energy minimization, the structure obtained mimics the real situation.
FIGURE 7.
Glycans-protein interactions. (a) A dimer of gSBA showing the mutual disposition of the glycans chain with respect to the subunits. (b) Primary sequence of the oligomannose in gSBA. (c) Tertiary structure of the oligomannose chain. (d–j) Interactions of the individual mannose residues (as per the numbering in Fig. 7 a) with the protein. The interactions were assessed using the LPC software and figures were made in ViewerLite42 software. The blue dashed lines represent hydrogen-bonding interactions, whereas the orange dashed lines represent hydrophobic interactions.
The interactions between the attached glycans and the protein were assessed using the online LPC server (24). The favorable interactions between the protein and the glycans thus obtained were grouped in two categories, hydrogen-bonding and hydrophobic. A dominance of hydrophobic interactions was observed over hydrogen-bonding interactions. The glycan was interacting with the protein via 27 hydrogen bonds and 53 hydrophobic interactions (Fig. 7, d–j). A table listing all the intersubunit glycan-protein interactions is given in the Supplementary Material.
DATA ANALYSIS
The values of ΔG° (the free energy change upon protein unfolding at zero denaturant concentration) and m (the linear dependence of free energy upon protein unfolding on denaturant) at a given temperature were estimated according to the linear free energy model (25). According to the linear free energy model, the changes in free energy and enthalpy upon unfolding depend linearly on denaturant concentration,
 |
(1) |
where  is the Gibb's free energy of the process, m is the slope of the transition, and
  corresponds to the difference in free energy between the unfolded and the folded states in the absence of any denaturant (D). For the native protein, the isothermal data were fitted according to the equations described elsewhere (18).
The chaotrope-induced denaturation of tetrameric rSBA can be best described as a three-state model where the tetramer (A4) is in equilibrium with a monomeric intermediate (I) and the denatured state (U).
 |
(1a) |
 |
(2) |
 |
(3) |
The total protein concentration, Pt, in terms of the monomeric subunit can be expressed as
 |
(4) |
The sum fraction of native (FN), intermediate monomer (FI), and unfolded monomer (FU) is equal to 1.
 |
(5) |
Hence, combining Eqs. 2–4, we get
 |
(6) |
 |
(7) |
 |
(8) |
 |
(9) |
Substituting the expressions FN and FU in Eq. 5, FI can be solved in terms of K1, K2, Pt. The software Mathematica is used to solve the roots of FI. Among the four roots, only the real root is taken into consideration. Now the fluorescence signal (Y) may be described as
 |
(10) |
Equation 6 can be expressed in terms of K1, K2, and FI.
 |
(11) |
The equilibrium constant is related to Gibbs free energy by the following equation:
 |
(12) |
According to the LEM model ΔG, the free energy of unfolding is considered linearly dependent on denaturant concentration, where m is the LEM coefficient.
 |
(13) |
Combining Eqs. 12 and 13, we define K1 and K2 as
 |
(14a) |
 |
(14b) |
K1 and K2 in Eq. 11 were replaced by Eqs. 14a and 14b, respectively. The baselines YN and YU are linearly dependent on denaturant concentration. YI is independent of denaturant concentration. The other two baselines were treated as local adjustable parameters and all the thermodynamic parameters along with YI were calculated by global fit. First, the data was normalized to fraction unfolded by  and then, combining Eqs. 1–13, all the transition thermodynamic parameters (ΔGn, ΔGu, mn, mu, and YI) were calculated. YI forms the physical basis of the intermediate.
DISCUSSION
It is reasonably clear that the presence of glycosylation does affect the expression of the protein into its final mature form. The native form of the protein when extracted from seeds of Glycine max yielded high quantities of the protein, 250 mg from 250 g of the seeds. However, the bacterially expressed recombinant form of the same protein gave very low yields (19). There may be several factors ascribed to the lower yield of the protein, including the oligomeric nature of the protein and its glycosylation.
Since gSBA and rSBA both exist as tetramers with identical ligand binding specificities and macromolecular properties, the change of the mode of unfolding from a two-state process to a three-state process and the decrease of Tm by 26°C for the thermal unfolding of the protein of the latter implicate the covalently linked glycans for the stability of gSBA. The free energy of unfolding calculated for rSBA and gSBA as per LEM model are 41.9 kcal/mol (37.1 kcal/mol for the first transition and 4.8 kcal/mol for the second transition) and 51.1 kcal/mol, respectively. Apparently, glycosylation promotes the protein with greater stability, which is considerable in its magnitude (9 kcal/mol). To our knowledge, this is the first demonstration of N-glycans affecting protein stability to such a huge extent, except for a report on a fucosylated peptide PMP-C (Pars intercerebralis major peptide C, a 36-residue peptide). In this case, deglycosylation lowers the Tm of the peptide by 20°C, whereas the free energy of unfolding is reduced by only 1 kcal/mol (26). As apparent from dynamic light scattering studies, the intermediate observed during unfolding of rSBA is monomeric in nature. Hence, the first transition is related to the dissociation of the tetrameric unit to constituent monomers, whereas the second one represents opening up of the individual subunits. That the intermediate is monomeric in nature is also evident from its fluorescence emission λmax, which is similar to its fully folded monomeric state, characterized earlier (23) (Fig. 5 b, inset). ANS binding studies were done on rSBA. The studies show that there is no appreciable increase in the intensity of ANS fluorescence on dissociation to monomer or in the fully unfolded state (data not shown). The stability of the monomer of rSBA is comparable to many monomeric proteins of similar size. For example, the stability of the porcine odorant binding protein is 4.7 kcal mol−1 in terms of free energy of unfolding (27). Similarly, the free energies of unfolding of CH2 antibody domain and phage P22 coat proteins are, respectively, 3.76 kcal/mol and 5.8 kcal/mol (28,29).
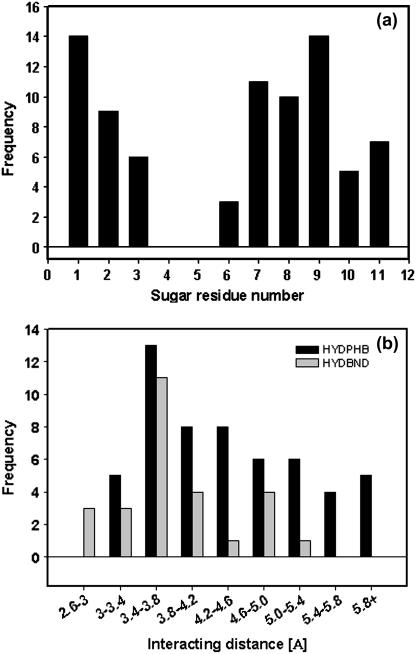
Being at the noncanonical interface, these glycans must be profoundly involved in holding the tetrameric structure rather than being involved in the folding of individual monomeric unit. Using the LPC server, the interactions between the covalently attached glycans and the protein residues were assessed. A total of 27 hydrogen-bonding interactions and 53 hydrophobic interactions were found to stabilize the structure, which suggests that hydrophobic interactions between the protein and the glycans are responsible for the exceptionally high stability of the glycoprotein. Out of the 27 hydrogen bonds, only two interactions are found to be intrasubunit (i.e., glycans attached to subunit X forming hydrogen bonds with residues of subunit X), whereas the rest are intersubunit interactions. Similarly, only 13 out of 53 hydrophobic interactions are intrasubunit in nature. Hence, one can evaluate the extent of the intersubunit interactions due to glycosylation. Fig. 7, d–j, gives a pictorial view of the glycan-protein interactions. In these studies, we observe that mostly the mannose residues are involved in the intersubunit interactions. In a previous study, we probed the role of the two proximal GlcNAc residues in tethering the glycans attached to one subunit to the side chains of amino acid residues of an adjacent subunit at the noncanonical interface (18). As shown in Fig. 8 a, almost all the sugar residues of the oligomannose chain are involved in a number of interactions with the protein residues, except for residues 4–6 (according to the numbering in Fig. 7 b). This suggests that the oligomannose glycan is well embedded in the clefts and cavities on the protein surface. It is worth mentioning here that our efforts to cleave the intact glycoprotein using α-mannosidase failed repeatedly. However similar efforts with thermally/detergent denatured glycoprotein were successful to a certain extent (S. Sinha and A. Surolia, unpublished observations). The probable reason for the failure to deglycosylate may be related to the fact that the terminal mannose residues are well rooted in the clefts and cavities on the protein surface, which made them inaccessible to the enzyme. Coming to the nature of the interactions, we see that both hydrogen bonding and hydrophobic interactions prevail in the system, the frequency of the latter occurring more often. Fig. 8 b shows the distribution of the two types of interactions. The maximum number of interactions of either kind operate in the distance range of 3.4–3.8 Å. By and large, the hydrogen bonds range from 2.5–5.4 Å and the hydrophobic interactions have an even distribution in the range 3–6 Å.
FIGURE 8.
Histograms showing glycans-protein interactions. (a) Number of intersubunit interactions with the protein made by individual sugar residues in the oligomannose chain of SBA. (b) Distribution of the total number of hydrogen bonds and hydrophobic interactions between the glycans and polypeptide in SBA.
CONCLUSIONS
In summary, our work shows that the nonglycosylated form of SBA unfolds via a non-two-state pathway, in contrast to the glycosylated naturally occurring protein. By a combined effort of thermal and chaotrope-induced denaturation we have been able to show the profound effect of glycosylation in the conformational stability and oligomerization of the protein. It is apparent that the role of glycosylation in maintaining conformational stability is more pronounced compared to regulating the ultimate functional form of the protein.
SUPPLEMENTARY MATERIAL
An online supplement to this article can be found by visiting BJ Online at http://www.biophysj.org.
Acknowledgments
The authors thank Professor N. Sharon, at The Weizmann Institute of Science, for the rSBA clone.
This work was supported by a grant from the Dept. of Biotechnology, government of India, to A.S. S.S. thanks the Council of Scientific and Industrial Research, India, for the award of Senior Research Fellowship.
References
- 1.Rudd, P. M., and R. A. Dwek. 1997. Glycosylation:heterogeneity and 3D structure of proteins. Crit. Rev. Biochem. Mol. 32:1–100. [DOI] [PubMed] [Google Scholar]
- 2.Nalivaeva, N. N., and A. J. Turner. 2001. Post-translational modifications of proteins: acetylcholinesterase as a model system. Proteomics. 1:735–747. [DOI] [PubMed] [Google Scholar]
- 3.Munro, S. 2001. What can yeast tell us about N-linked glycosylation in the Golgi apparatus? FEBS Lett. 498:223–227. [DOI] [PubMed] [Google Scholar]
- 4.Paulson, J. C. 1990. Glycoproteins: what are the sugar chains for? In Proteins: Form and Function. R. A. Bradshaw and M. Purton, editors. Elsevier Trends Journals, Cambridge, UK. 209–217.
- 5.Matthews, C. R. 1993. Pathways of protein folding. Annu. Rev. Biochem. 62:653–683. [DOI] [PubMed] [Google Scholar]
- 6.Mitra, N., S. Sinha, T. N. C. Ramya, and A. Surolia. 2006. N-linked oligosaccharides as outfitters for glycoprotein folding, form and function. Trends Biochem. Sci. 31:156–163. [DOI] [PubMed] [Google Scholar]
- 7.Imperiali, B., and S. E. O'Connor. 1999. Effect of N-linked glycosylation on glycopeptide and glycoprotein structure. Curr. Opin. Chem. Biol. 3:643–649. [DOI] [PubMed] [Google Scholar]
- 8.O'Connor, S. E., and B. Imperiali. 1996. Modulation of protein structure and function by asparagines linked glycosylation. Chem. Biol. 3:803–812. [DOI] [PubMed] [Google Scholar]
- 9.Wyss, D. F., and G. Wagner. 1996. Structural role of sugars in glycoproteins. Curr. Opin. Biotechnol. 7:409–416. [DOI] [PubMed] [Google Scholar]
- 10.Li, S., V. Polonis, H. Isobe, H. Zaghouani, R. Guinea, T. Moran, C. Bona, and P. Palese. 1993. Chimeric influenza virus induces neutralizing antibodies and cytotoxic T cells against human immunodeficiency virus type 1. J. Virol. 67:6659–6666. [DOI] [PMC free article] [PubMed] [Google Scholar]
- 11.Yamaguchi, H., and M. Uchida. 1996. A chaperone-like function of intramolecular high-mannose chains in the oxidative refolding of bovine pancreatic RNase B. J. Biochem. (Tokyo). 120:474–477. [DOI] [PubMed] [Google Scholar]
- 12.Nishimura, I., M. Uchida, Y. Inohana, K. Setoh, K. Daba, S. Nishimura, and H. Yamaguchi. 1998. Oxidative refolding of bovine pancreatic RNases A and B promoted by Asn-glycans. J. Biochem. (Tokyo). 123:516–520. [DOI] [PubMed] [Google Scholar]
- 13.Bosques, C. J., S. M. Tschampel, R. J. Woods, and B. Imperiali. 2004. Effects of glycosylation on peptide conformation: a synergistic experimental and computational study. J. Am. Chem. Soc. 126:8421–8425. [DOI] [PMC free article] [PubMed] [Google Scholar]
- 14.Prabu, M. M., K. Suguna, and M. Vijayan. 1999. Variability in quaternary association of proteins with the same tertiary fold: a case study and rationalization involving legume lectins. Proteins. 35:58–69. [DOI] [PubMed] [Google Scholar]
- 15.Chandra, N. R., M. M. Prabu, K. Suguna, and M. Vijayan. 2001. Structural similarity and functional diversity in proteins containing the legume lectin fold. Protein Eng. 14:857–866. [DOI] [PubMed] [Google Scholar]
- 16.Lis, H., N. Sharon, and E. Katchalski. 1966. Soybean hemagglutinin, a plant glycoprotein. J. Biol. Chem. 241:684–689. [PubMed] [Google Scholar]
- 17.Dorland, L., H. van Halbeek, J. F. Vleigenthart, H. Lis, and N. Sharon. 1981. Primary structure of the carbohydrate chain of soybean agglutinin. A reinvestigation by high resolution 1H NMR spectroscopy. J. Biol. Chem. 256:7708–7711. [PubMed] [Google Scholar]
- 18.Sinha, S., N. Mitra, G. Kumar, K. Bajaj, and A. Surolia. 2005. Unfolding studies on soybean agglutinin and concanavalin A tetramers: a comparative account. Biophys. J. 88:1300–1310. [DOI] [PMC free article] [PubMed] [Google Scholar]
- 19.Adar, R., H. Streicher, S. Rozenblatt, and N. Sharon. 1997. Synthesis of soybean agglutinin in bacterial and mammalian cells. Eur. J. Biochem. 249:684–689. [DOI] [PubMed] [Google Scholar]
- 20.Pace, C. N. 1990. Conformational stability of globular proteins. Trends Biochem. Sci. 15:14–17. [DOI] [PubMed] [Google Scholar]
- 21.Baues, R. J., and G. R. Gray. 1977. Lectin purification on affinity columns containing reductively aminated disaccharides. J. Biol. Chem. 252:57–60. [PubMed] [Google Scholar]
- 22.Lotan, R., H. W. Siegelman, H. Lis, and N. Sharon. 1974. Subunit structure of soybean agglutinin. J. Biol. Chem. 249:1219–1224. [PubMed] [Google Scholar]
- 23.Sinha, S., and A. Surolia. 2005. Oligomerization endows enormous stability to soybean agglutinin: a comparison of the stability of monomer and tetramer of soybean agglutinin. Biophys. J. 88:4243–4251. [DOI] [PMC free article] [PubMed] [Google Scholar]
- 24.Sobolev, V., A. Sorokine, J. Prilusky, E. E. Abola, and M. Edelman. 1999. Ligand-protein contacts (LPC) was derived with LPC software: automated analysis of interatomic contacts in proteins. Bioinformatics. 15:327–332. [DOI] [PubMed] [Google Scholar]
- 25.Schellman, J. A. 1990. Selective binding and solvent denaturation. Biophys. Chem. 37:121–140.2285775 [Google Scholar]
- 26.Mer, G., H. Hietter, and J. F. Lefevre. 1996. Stabilization of proteins by glycosylation examined by NMR analysis of a fucosylated proteinase inhibitor. Nat. Struct. Biol. 3:45–53. [DOI] [PubMed] [Google Scholar]
- 27.Parisi, M., A. Mazzini, R. T. Sorbi, R. Ramoni, S. Grolli, and R. Favilla. 2003. Unfolding and refolding of porcine odorant binding protein in guanidinium hydrochloride: equilibrium studies at neutral pH. Biochim. Biophys. Acta. 1652:115–125. [DOI] [PubMed] [Google Scholar]
- 28.M. J. Feige., W. Stefan, and J. Buchner. 2004. Folding mechanism of the CH2 antibody domain. J. Mol. Biol. 344:107–118. [DOI] [PubMed] [Google Scholar]
- 29.Andersona, E., and C. M. Teschke. 2003. Folding of phage P22 coat protein monomers: kinetic and thermodynamic properties. Virology. 313:184–197. [DOI] [PubMed] [Google Scholar]


