Abstract
The adult form of the nicotinic acetylcholine receptor (AChR) consists of five subunits (α2βɛδ), each having four transmembrane domains (M1–M4). The atomic model of the nicotinic acetylcholine receptor shows that the pore-lining M2 domains make no extensive contacts with the rest of the transmembrane domains. However, there are several sites where close appositions between segments occur. It has been suggested that the pair αM1-F15′ and αM2-L11′ is one of the potential interactions between segments. To determine experimentally if these residues are interacting and to explore if this interhelical interaction is essential for channel gating, we combined mutagenesis with single-channel kinetic analysis. Mutations in αM1-F15′ lead to profound changes in the opening rate and slighter changes in the closing rate. Channel gating is impaired as the volume of the residue increases. Rate-equilibrium linear free-energy relationship analysis reveals an ∼70% open-state-like environment for αM1-F15′ at the transition state of the gating reaction, suggesting that it moves early during the gating process. Replacing the residue at αM1-15′ by that at αM2-11′ and vice versa profoundly alters gating, but the combination of the two mutations restores gating to near normal, indicating that αM1-F15′ and αM2-L11′ are interchangeable. Double-mutant cycle analysis shows that these residues are energetically coupled. Thus, the interaction between M1 and M2 plays a key role in channel gating.
INTRODUCTION
Cys-loop receptors play a critical role in fast chemical transmission throughout the nervous system. The nicotinic acetylcholine receptor (AChR) is the prototype for the study of this family of ligand-gated ion channels (1). The AChR is a pentamer of homologous subunits with a composition α2βɛδ in the adult muscle. Each subunit is composed of an extracellular domain that contains the binding sites and four transmembrane (TM) segments (M1–M4). Electron microscopy images of AChR at 4-Å resolution revealed that the four TM domains have α-helical structures (2). The M2 segment of each subunit delineates the ion channel pore, which contains the gate that allows the pore to switch from ion impermeable to ion permeable (2). M1, M3, and M4 are located behind M2, forming an external shield that isolates the pore from the lipid membrane.
The binding of the agonist triggers a concerted, global change in the protein's conformation that results in the opening of the channel gate. The mechanism of channel gating is still not clear. The interface between the extracellular and TM domains is essential to couple agonist binding to channel gating (2,3–8). Channel gating primarily involves motion of the M2 segments, which leads to the broadening of the ion pore (2). The motions of M1, M3, and M4 segments during channel gating are less understood. However, several experimental data support their contribution to gating kinetics (9–16). Rate-equilibrium free-energy relationship analyses (REFER) have provided evidence about the structural dynamics of TM segments during channel gating (17,18). These studies have suggested that αM2 moves asynchronously, with the rearrangement of the extracellular half preceding that of the middle part during opening (4,19,20). In contrast, αM4 moves as a synchronous unit, near the middle of the gating reaction (16). Residues at M2 and M4 of β, ɛ, and δ subunits move later during the gating reaction than the equivalent residues of α subunits (16,20,21).
We have recently shown that M1 contributes to gating and that mutations at position 15′ of M1 of the β subunit lead to significant changes in kinetics (13). Kinetic analysis of βM1-I15′F AChR channels activated by choline revealed a 28-fold increase in the gating equilibrium constant of the diliganded receptor and a significant increased opening in the absence of agonist. REFER analysis suggested an ∼70% closed-state like environment for the β15′ position at the transition state of gating.
The atomic model of the closed pore of the AChR shows that although M2 makes no extensive van der Waals contacts with the other TM segments, there are several sites where close appositions between segments occur. It has been suggested that the pair αM1-F15′ and αM2-L11′ is one of the potential interactions between segments (2). Interactions between residues located at different regions of the AChR are essential for the dynamics of channel gating (5,7,22–24). Thus, identifying pairwise interactions between TM domains that contribute to channel gating will allow us to better understand the gating process.
Here we study in detail the structural contribution of position 15′ of M1 of the α, ɛ, and δ subunits of the muscle AChR to channel gating. In addition, we explore the interaction of this position with 11′ of αM2, and we describe how this interaction affects channel gating.
MATERIALS AND METHODS
Construction of mutant subunits
Mouse cDNA of α, β, ɛ, and δ AChR subunits were used (25). Mutant subunits were constructed using the Quik Change site-directed mutagenesis kit (Stratagene, La Jolla, CA). Restriction mapping and DNA sequencing confirmed all constructs. The ɛL269F mutation, associated with a slow-channel congenital myasthenic syndrome (26), was used as a background mutation in some experiments.
Expression of AChR
BOSC 23 cells (24) were transfected with α, β, ɛ, and δ cDNA subunits (wild-type or mutant) using calcium phosphate precipitation at a subunit ratio of 2:1:1:1 for α/β/ɛ/δ, respectively, essentially as described previously (25,27). For transfections, cells at 40–50% confluence were incubated for 8–12 h at 37°C with the calcium phosphate precipitate containing the cDNAs in Dulbecco's modified Eagle's medium plus 10% fetal bovine serum. Cells were used for single-channel measurements 1 or 2 days after transfection.
Patch-clamp recordings
Recordings were obtained in the cell attached configuration (28) at a membrane potential of −70 mV and at 20°C. The bath and pipette solutions contained 142 mM KCl, 5.4 mM NaCl, 1.8 mM CaCl2, 1.7 mM MgCl2, and 10 mM HEPES, pH 7.4. Patch pipettes were pulled from 7052 capillary tubes (Garner Glass, Claremont, CA) and coated with Sylgard (Dow Corning, Midland, MI). Acetylcholine (ACh) or choline was added to the pipette solution.
Single-channel currents were recorded using an Axopatch 200B patch-clamp amplifier (Axon Instruments, Union City, CA), digitized at 5-μs intervals with the PCI-6111E interface (National Instruments, Austin, TX), recorded to the hard disk of a computer using the program Acquire (Bruxton Corporation, Seattle, WA), and detected by the half-amplitude threshold criterion using the program TAC (Bruxton Corporation) at a final bandwidth of 10 kHz. Open- and closed-time histograms were plotted using a logarithmic abscissa and a square root ordinate and fitted to the sum of exponential functions by maximum likelihood using the program TACFit (Bruxton Corporation). Open probability within clusters (Popen) was determined experimentally by calculating the mean fraction of time that the channel is open within a cluster.
Data of AChRs activated by 20 mM choline were analyzed at a bandwidth of 5 kHz to avoid detection of blockages that could be resolved at 10 kHz. Owing to open-channel block, AChRs activated by 20 mM choline show a 60% reduction in channel amplitude (29). At −70 mV, single-channel amplitudes of wild-type receptors activated by 30 μM ACh and 20 mM choline were 5.50 ± 0.14 and 2.10 ± 0.04 pA, respectively. Current amplitudes determined at 100 μM choline were similar to those determined at 30 μM ACh. The KB for fast blockade by choline, calculated according to io/ib=1+[B]/KB where io is the current at low agonist concentration, ib is the current at 20 mM choline, [B] is choline concentration (20 mM), and KB is the dissociation equilibrium constant for binding to the blocking site and is ∼12 mM, in good agreement with recent reports (30).
Kinetic analysis
Kinetic analysis was performed as described before (9,10,14). The analysis was restricted to clusters of channel openings, each reflecting the activity of a single AChR. Clusters were identified as a series of closely spaced events preceded and followed by closed intervals longer than a critical duration (τcrit), which was taken as the point of intersection of the predominant closed component and the succeeding one in the closed-time histogram. Similar results were obtained when τcrit was calculated by solving numerically for τcrit in the expression exp(−τcrit/τ2) = [1 −exp(−τcrit/τ3)] by using MAPLE 7 (Waterloo Maple, Ontario, Canada), where τ2 is the predominant longest closed component within clusters and τ3 is the succeeding one (31,32).
Only clusters containing more than 10 openings were considered for further analysis. In addition, clusters showing double openings were rejected. For mutations that decrease the Popen, particularly αM2-L11′, recordings with extremely low channel activity were used to allow a better identification of clusters. To this end, the cells were incubated with the calcium phosphate precipitate overnight, and recordings were started at different times immediately after changing the medium until channel activity appeared.
The resulting open and closed intervals from single patches at 20 mM choline were analyzed according to kinetic schemes using an interval-based full likelihood algorithm (www.qub.buffalo.edu; QuB suite, State University of New York, Buffalo, NY). Briefly, the program allows simultaneous fitting of recordings and estimates the rate constants using a maximum likelihood method that corrects for missed events (33). Calculated rates were accepted only if the resulting probability density functions correctly fitted the experimental open- and closed-duration histograms.
For the analysis, we fitted dwell times from the selected clusters by the kinetic scheme containing one open and one closed state given that 20 mM choline is a saturating concentration (29,34). Increasing choline concentration up to 20 mM increases ∼2-fold the apparent mean open time compared with that obtained at low concentrations (11,20,30). Because the single-channel amplitude was reduced to a similar extent in wild-type and all mutant AChRs, we assumed that the mutations do not change fast blockade for choline and therefore the prolongation of the openings is the same for all constructs.
Double-mutant cycle analysis
Gating equilibrium constants (θ2) obtained from kinetic analysis was used to calculate the coupling coefficient Ω based on Eq. 1:
 |
(1) |
where the superscripts M1 and M2 indicate that these segments are not mutated, and M1* and M2* that these segments are mutated in 15′ and 11′, respectively. The coupling energy between residues was calculated by Eq. 2 (35):
 |
(2) |
Rate-equilibrium free-energy relationships
We applied REFER analysis to determine the structure of the gating transition state near position 15′ of the α subunit (16,17,29,36). For this analysis, the values calculated for rate (β2) and gating equilibrium (θ2) constants were used. The correlation between the rate and equilibrium constants for series of point mutants, Φ, measures the extent to which the perturbed region at the reaction transition state resembles the open conformation. Φ is a fraction between 1 and 0, with Φ = 1 implying an open-like character.
Molecular modeling
The refined coordinates of Torpedo AChR at 4-Å resolution (Protein Data Bank (PDB) with accession code 2BG9) (37) were used as a starting model to evaluate the structural implications of the mutations. Single and double point mutations of the amino acids located at 15′ of αM1 and 11′ of αM2 were modeled with the program O (38), and the geometry regularization of the resulting structures was performed with REFMAC (39). The geometry of the final models was examined with the program PROCHECK (40). Figures were prepared with Visual Molecular Dynamics (41).
RESULTS
Activation of M1 mutant AChRs
Activation by acetylcholine
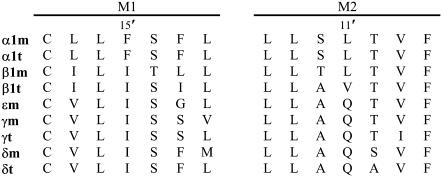
We have previously shown that mutations at position 15′ of the M1 domain of the β subunit (Fig. 1) significantly alter gating kinetics (13). We here explore the structural contribution of the equivalent position in α, ɛ, and δ subunits to channel gating. To this end, we replaced the residues by amino acids with different side chains and evaluated kinetic changes.
FIGURE 1.
Sequence alignment of the M1 and M2 TM domains of different subunits. Residues αM1-F15′ and αM2-L11′ are located close to each other in the structural model of the AChR pore (2).
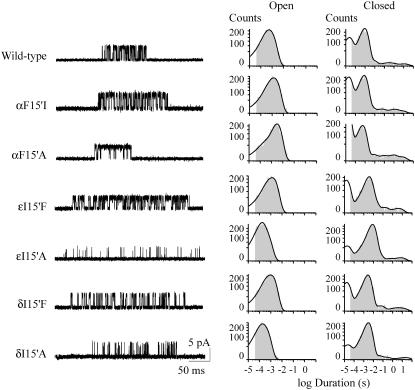
We first examined the behavior of clusters of channel openings elicited by 30 μM ACh, which is close to the EC50 of activation of wild-type AChRs (9). All the mutations in the α subunit, except αF15′Y, increase the mean open time (Table 1). Mutations in the ɛ and δ subunits lead to both increased and decreased mean open times (Table 1). At 30 μM ACh, the closed time distributions show a major intermediate component of ∼1.5 ms, whose duration is dependent on ACh concentration and corresponds to closings within clusters (Fig. 2) (9). The duration of this main closed component decreases from 1.8- (I) to 145-fold (W) in the αF15′ mutant receptors with respect to wild-type (Table 1). The probability of channel opening (Popen) increases in all αM1-15′ mutant AChRs, except in the αF15′Y (Table 1). In contrast, mutations at 15′ of the ɛ and δ subunits slightly change (F) significantly decrease (A) or increase (Y) the Popen (Table 1).
TABLE 1.
Kinetic and equilibrium parameters for wild-type and M1-15′ mutant AChRs
| 30 μM ACh
|
20 mM Choline
|
|||||||||||
|---|---|---|---|---|---|---|---|---|---|---|---|---|
| AChR | τo (ms) | τc (ms) | Popen | n | τo (ms) | τc (ms) | Popen | β2 (s−1) | α2 (s−1) | θ2 | θ2 Ratio (mut/wt) | n |
| Wild-type | 1.1 ± 0.1 | 1.6 ± 0.4 | 0.43 ± 0.09 | 7 | 0.5 ± 0.1 | 12 ± 5 | 0.04 ± 0.01 | 95 | 1910 | 0.05 | 1.0 | 10 |
| αF15′I | 1.8 ± 0.4 | 0.90 ± 0.04 | 0.60 ± 0.09 | 4 | 0.7 ± 0.2 | 7.0 ± 1.6 | 0.08 ± 0.02 | 145 | 1630 | 0.09 | 1.8 | 8 |
| αF15′A | 3.0 ± 0.4 | 0.5 ± 0.1 | 0.89 ± 0.02 | 5 | 1.2 ± 0.2 | 0.7 ± 0.1 | 0.60 ± 0.04 | 1320 | 910 | 1.45 | 29 | 5 |
| αF15′V | 3.2 ± 0.2 | 0.5 ± 0.1 | 0.88 ± 0.03 | 3 | 1.0 ± 0.3 | 1.7 ± 0.4 | 0.40 ± 0.06 | 540 | 950 | 0.6 | 12 | 8 |
| αF15′L | 4.3 ± 0.4 | 0.30 ± 0.04 | 0.94 ± 0.02 | 6 | 1.0 ± 0.2 | 0.8 ± 0.1 | 0.55 ± 0.07 | 1460 | 1150 | 1.3 | 26 | 8 |
| αF15′Y | 1.0 ± 0.3 | 2.1 ± 0.3 | 0.30 ± 0.05 | 6 | 0.7 ± 0.2 | 52 ± 18 | 0.015 ± 0.004 | 20 | 1450 | 0.014 | 0.3 | 9 |
| αF15′G | 6.6 ± 0.4 | 0.20 ± 0.05 | 0.98 ± 0.01 | 5 | 1.9 ± 0.4 | 0.20 ± 0.02 | 0.90 ± 0.02 | 4240 | 670 | 6.3 | 126 | 8 |
| αF15′W | 7.6 ± 0.8 | 0.011 ± 0.001 | 0.99 ± 0.01 | 3 | 6.3 ± 1.5 | 0.10 ± 0.04 | 1.00 ± 0.01 | 4700 | 175 | 27 | 540 | 10 |
| ɛI15′F | 1.8 ± 0.3 | 2.5 ± 0.9 | 0.60 ± 0.03 | 6 | 1.6 ± 0.7 | 18 ± 7 | 0.050 ± 0.004 | 65 | 1020 | 0.06 | 1.2 | 6 |
| ɛI15′A | 0.3 ± 0.1 | 6.8 ± 1.5 | 0.03 ± 0.01 | 9 | 0.20 ± 0.04 | 38 ± 8 | 0.005 ± 0.001 | 25 | 4910 | 0.005 | 0.1 | 3 |
| ɛI15′Y | 2.6 ± 0.1 | 0.6 ± 0.1 | 0.90 ± 0.01 | 4 | 1.2 ± 0.3 | 2.7 ± 0.7 | 0.32 ± 0.04 | 420 | 875 | 0.5 | 10 | 6 |
| δI15′F | 1.6 ± 0.2 | 3.1 ± 0.7 | 0.40 ± 0.09 | 4 | 0.9 ± 0.3 | 19 ± 4 | 0.06 ± 0.03 | 70 | 1250 | 0.06 | 1.2 | 4 |
| δI15′A | 0.45 ± 0.09 | 3 ± 1 | 0.10 ± 0.04 | 8 | 0.30 ± 0.07 | 41 ± 13 | 0.010 ± 0.003 | 40 | 3830 | 0.01 | 0.2 | 3 |
| δI15′Y | 1.7 ± 0.2 | 0.5 ± 0.1 | 0.80 ± 0.02 | 4 | 0.50 ± 0.06 | 3.4 ± 0.3 | 0.12 ± 0.02 | 320 | 2330 | 0.14 | 2.8 | 5 |
Mean open (τo) and mean closed (τc) times were obtained from the corresponding histograms. The mean closed time corresponds to the duration of the main component, which represents closings within a cluster. The probability of channel opening within a cluster (Popen) was calculated from clusters obtained at 30 μM ACh or 20 mM choline. The data correspond to the mean ± SD. Rate constants are results of a global fit by Scheme 1 to data obtained at 20 mM choline. The gating equilibrium constant, θ2, was calculated as β2/α2.
FIGURE 2.
Single-channel recordings of M1 mutant AChRs. (Left) Channels activated by 30 μM ACh were recorded from cells expressing AChRs containing wild-type or mutant α, ɛ, or δ subunits. Currents are displayed at a bandwidth of 10 kHz with channel openings as upward deflections. Membrane potential: −70 mV. (Right) Open- and closed-time histograms of AChRs carrying the specified mutant subunit.
Mutations that increase Popen could speed the channel-opening rate, making this rate difficult to determine (29). Because the Popen increases in the αM1 mutants, we used choline as an agonist to estimate the kinetics of activation for the different AChRs. Choline is a weak agonist of the muscle AChR, which shows a diliganded gating equilibrium constant that is 500 times smaller than ACh (29,34).
Activation by choline
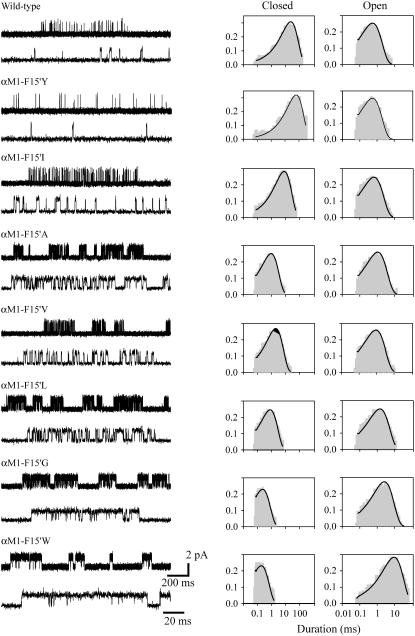
Channel activity of wild-type and mutant AChRs activated by 20 mM choline occurs in clusters (Fig. 3). At this choline concentration, channel amplitude decreases ∼60% (11,29). Open- and closed-time histograms show a single component (Fig. 3 and Table 1). Mean open times at 20 mM choline are highly variable among αM1-15′ mutants, showing a 12-fold difference between the briefest and the longest durations (Fig. 3 and Table 1). Mean closed times decrease in all αM1 mutants, except in αF15′Y, and show a 500-fold difference between the briefest and longest durations (Table 1). As described for ACh, the Popen within clusters increases in all αM1-15′ mutants, except in the αF15′Y (Table 1).
FIGURE 3.
Single-channel recordings of AChRs mutated at 15′ of αM1 activated by 20 mM choline. (Left) Single-channel recordings showing clusters at two different timescales. Membrane potential: −70 mV. Openings are shown as upward deflections at a bandwidth of 5 kHz. (Right) Open- and closed-time histograms with the fit by Scheme 1 superimposed to the experimental histograms. Histograms were constructed with the selected clusters. Ordinates correspond to the square root of the fraction of events per bin.
At 20 mM choline, the kinetics of AChR activation can be reduced to the transition between open and closed states (Scheme 1) (29). To analyze the kinetics of channel opening and closing, the closed and open intervals of the selected clusters were fitted by Scheme 1 (Fig. 3) (10,21):
 |
(Scheme 1) |
The curves resulting from the kinetic analysis superimposed on the experimental open and closed duration histograms (Fig. 3). The analysis reveals a great increase in the opening rate, β2, when αM1-F15′ is mutated (Table 1). The exception is tyrosine, which decreases this rate. The gating equilibrium constant, θ2, covers a wide range of values, which show a 1900-fold difference between the lowest and the highest one (Table 1). In the ɛ and δ subunits, the replacement of I15′ by Y increases the gating equilibrium constant whereas alanine leads to an impairment of channel gating (Table 1).
Structural contribution of position M1-15′ to channel gating
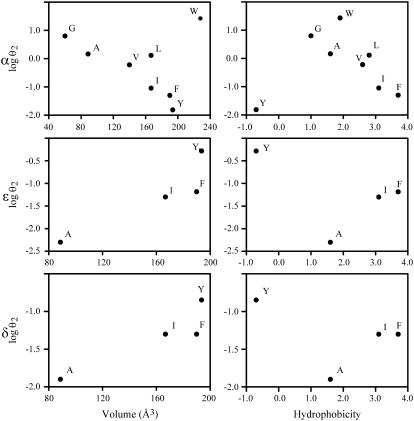
To determine if there is a correlation between the chemical properties of the residue at 15′ of M1 and the changes in channel gating, we plotted θ2 against the volume and the hydrophobicity of the residue (Fig. 4). Regarding the α subunit, with the exception of W, a strong correlation between θ2 and the amino acid volume is observed. Similarly, the gating equilibrium constant seems to correlate with the volume of the amino acid at 15′ of the ɛ and δ subunits. It is interesting to note that inverse relationships are observed between α and non-α subunits; i.e., θ2 decreases as a function of the volume in the α subunit whereas it increases in non-α subunits.
FIGURE 4.
θ2 values of M1-15′ mutants as a function of the physicochemical properties of the residue. The relationships between volume (52) and hydrophobicity of the residue at 15′ (Goldman, Engelman, and Steitz scale) and the gating equilibrium constant (θ2) are shown.
Rate-equilibrium free-energy relationship analysis for αM1 mutant AChRs
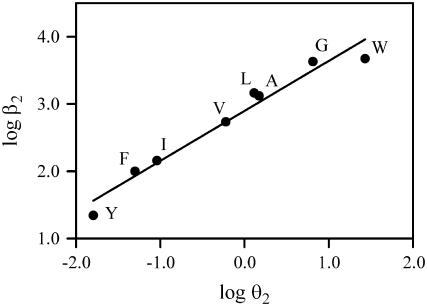
We applied REFER to determine the structure of the gating transition state near position 15′ of αM1 (16,36). For the analysis we used the values of the opening rate and gating equilibrium constant shown in Table 1. The BrØnsted plot obtained using β2 versus θ2 for α substitutions is shown in Fig. 5. The slope of the linear relationship, Φ, estimates the extension to which the mutated site has adopted its open structure at the transition state of the gating reaction (17). We obtained a Φ value of 0.74 ± 0.06 (r2=0.97) for mutations in 15′ of αM1, indicating that the structure of the transition state at this position resembles the open state in ∼70%. Zhou et al. (17) have recently derived the analytical form of a REFER for a linear chain of coupled reactions and showed that the experimental REFERs appear to be more linear than those predicted by the theory. The reason for this discrepancy is still unknown. We therefore corroborated that the data can be well fitted by a second order polynomial: y = yo + ax + bx2 (r2 = 0.99), resulting in a = 0.68 ± 0.04 and b = −0.14 ± 0.04. The value for Φ thus calculated (0.68) is similar to that calculated from a linear plot.
FIGURE 5.
REFER analysis. BrØnsted plots for mutants at 15′ of αM1. Φ-value is given by the slope of the linear fit to the plot.
Interaction between M1 and M2 segments
Kinetics of single- and double-mutant AChRs
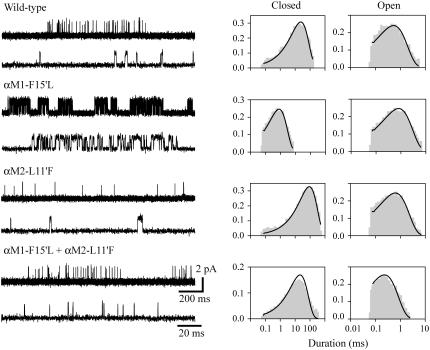
The structural model of the AChR at 4-Å resolution shows that αM1-F15′ is close to αM2-L11′ (2) (Fig. 1). To determine experimentally if these residues are interacting, we generated pairs of reverse mutations within α subunits and recorded channels activated by 20 mM choline from the single- (αM1-F15′L and αM2-L11′F) and double-mutant receptors (αM1-F15′L+αM2-L11′F) (Fig. 6). Although position 11′ of M2 does not face the ion channel pore, we first analyzed how the mutation at this position affects channel blockade induced by high choline concentrations. To this end, we determined single-channel amplitudes of wild-type and single- and double-mutant AChRs activated by low (100 μM) and high (20 mM) concentrations of choline. Current amplitudes for 100 μM and 20 mM choline at −70 mV were 5.50 ± 0.11 and 2.15 ± 0.04 pA (wild-type), 5.31 ± 0.10 and 2.12 ± 0.10 pA (αM2-L11′F), and 5.27 ± 0.15 and 2.11 ± 0.07 pA (αM1-F15′I+αM2-L11′F). Therefore, we can ensure that in the M2 mutant the blockade by 20 mM choline is similar to that of wild-type AChR.
FIGURE 6.
Single-channel currents in the presence of 20 mM choline of single- and double-mutant AChRs. (Left) Channel traces corresponding to wild-type, single- (αM1-F15′L or αM2-L11′F), and double-mutant (αM1-F15′L+αM2-L11′F) AChRs. Clusters are shown at two different timescales. Membrane potential: −70 mV. Openings are shown as upward deflections at a bandwidth of 5 kHz. Right: Open- and closed-time histograms with the fit to the Scheme 1 superimposed to the experimental histograms. Ordinates correspond to the square root of the fraction of events per bin.
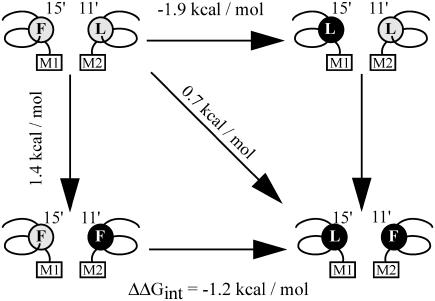
The most significant changes are observed in the mean closed time of the single-mutant receptors, which decreases ∼17-fold and increases ∼10-fold in the αM1-F15′L and αM2-L11′F, respectively. In contrast, the mean closed time of the double mutant is similar to that of wild-type AChRs (Fig. 6 and Table 2). The kinetic analysis revealed that the opening rate increases ∼15-fold in the single M1 mutant and decreases 10-fold in the M2 mutant but it is similar to that of wild-type in the double mutant (Table 2). Thus, the mutation in M1 improves channel gating, whereas that in M2 impairs channel gating (Table 2). The combined mutations, which restore the pair of interacting residues, restore gating to near normal (Table 2). Thus, F15′ in αM1 and L11′ in αM2 are interchangeable. We calculated the changes due to the mutations in the free energy of the gating equilibrium of diliganded AChRs. Whereas M1-F15′L decreases the free energy (−1.9 kcal/mol), the mutation M2-L11′F increases it (1.4 kcal/mol). The change in the free energy of the double mutant (0.7 kcal/mol) is significantly different from the sum of the changes occurring in the two single mutants. This result indicates that the effects of the mutations are not independent and that the residues are coupled in their contribution to gating (35). To test further for interaction between M1-F15′ and M2-L11′ and to quantify energetic coupling between them we analyzed the changes in the free energy of coupling by double-mutant thermodynamic cycles (Fig. 7). When the gating equilibrium constants, θ2, are cast as a mutant cycle, the free energy of coupling is −1.2 kcal/mol. The analysis confirms that the residues at 15′ of αM1 and 11′ of αM2 interact with each other.
TABLE 2.
Kinetic and equilibrium parameters for wild-type, single-mutant, and double-mutant AChRs
| AChR | τo (ms) | τc (ms) | Popen | β2 (s−1) | α2 (s−1) | θ2 | θ2 Ratio (mut/wt) | n |
|---|---|---|---|---|---|---|---|---|
| Wild-type | 0.5 ± 0.1 | 12 ± 5 | 0.04 ± 0.01 | 95 | 1910 | 0.05 | 1.0 | 10 |
| αM1-F15′L | 1.0 ± 0.2 | 0.7 ± 0.1 | 0.55 ± 0.07 | 1460 | 1150 | 1.3 | 26 | 8 |
| αM2-L11′F | 0.5 ± 0.1 | 122 ± 17 | 0.005 ± 0.001 | 10 | 2130 | 0.005 | 0.1 | 8 |
| αM1-F15′L+αM2-L11′F | 0.3 ± 0.1 | 14 ± 3 | 0.02 ± 0.01 | 80 | 4930 | 0.016 | 0.3 | 7 |
| ɛL269F (bg) | 2.3 ± 0.8 | 0.8 ± 0.3 | 0.86 ± 0.03 | 1030 | 150 | 6.9 | 138 | 3 |
| bg+αM2-L11′F | 1.7 ± 0.4 | 8.1 ± 0.3 | 0.21 ± 0.04 | 130 | 440 | 0.3 | 6 | 3 |
| bg+αM1-F15′L+αM2-L11′F | 2.2 ± 0.4 | 0.8 ± 0.1 | 0.78 ± 0.02 | 1460 | 350 | 4.2 | 84 | 3 |
The mean open (τo) and mean closed (τc) times were obtained from the corresponding histograms. Popen is the probability of channel opening within a cluster. For AChRs carrying the ɛL269F mutation, τc corresponds to the main closed component. The data correspond to the mean ± SD. Rate constants are results of a global fit of dwell times from the selected clusters at 20 mM choline by Scheme 1 (wild-type, αM1-F15′L, αM2-L11′F, and αM1-F15′L+αM2-L11′F) or by Scheme 2 for AChRs containing the background (bg) ɛL269F mutation (ɛL269F (bg), bg+αM2-L11′F, bg+αM1-F15′L+αM2-L11′F). The gating equilibrium constant, θ2, was calculated as β2/α2.
FIGURE 7.
Double-mutant thermodynamic cycle analysis. ΔΔG values corresponding to each mutant are shown. These values were calculated as −RTln( ), where
  represents the gating equilibrium constant for the single or double-mutant receptors. The free energy for coupling (ΔΔGint) was calculated by Eq. 2. Free energy changes for channel gating are shown on the arrows for the single and double mutant.
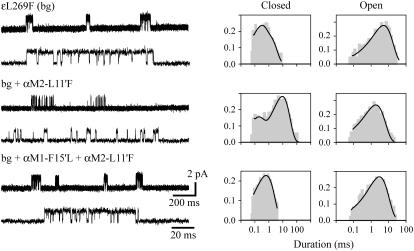
We used choline as the agonist because the channel opening rate constant of the mutant αM1-F15′L AChRs activated by ACh is too fast to be measured reliably. However, due to the low Popen of αM2-L11′F activated by choline, recordings in which clusters could be well distinguished were difficult to obtain (see Materials and Methods). In addition, the determination of the low opening rate constant of this mutant may yield inaccurate values. Therefore, to corroborate the value obtained for β2, we first combined the αM2 mutation with another one that increases the opening rate. We chose the ɛL269F mutation, a gain of function mutation which has been associated to a slow-channel congenital myasthenic syndrome (26). As shown in Fig. 8 and Table 2, ɛL269F-containing channels activated by 20 mM choline show longer openings and briefer closings, and clusters of channel openings can be clearly distinguished. The decrease in channel amplitude due to choline block is similar to that of wild-type AChRs (2.10 ± 0.08 pA), indicating that channel block is not affected by the mutation ɛL269F. In all AChRs containing the background mutation, the closed-time histograms constructed with the selected clusters show a second closed component, which is clearly noticeable in the double mutant (Fig. 8). We do not know the origin of this closed component, but for other mutants it has been proposed that a second closed component may originate from a short-lived desensitized state (20). We analyzed the kinetics of channel opening and closing on the basis of Scheme 2, which is an extension of Scheme 1 and includes a second closed state:
 |
(Scheme 2) |
FIGURE 8.
Single-channel currents of AChRs carrying the background ɛL269F mutation activated by 20 mM choline. (Left) Channel traces corresponding to AChRs carrying the ɛL269F (bg) mutant subunit together with wild-type, single αM2-L11′F, or the αM1-F15′L+αM2-L11′F double-mutant subunits. Clusters are shown at two different timescales. Membrane potential: −70 mV. Openings are shown as upward deflections at a bandwidth of 5 kHz. (Right) Open- and closed-time histograms with the fit by Scheme 2 superimposed to the experimental histograms. Ordinates correspond to the square root of the fraction of events per bin.
As expected, the analysis confirms that the ɛL269F mutation increases β2 and decreases α2 (Table 2). When the αM2-L11′F mutation is introduced into this template receptor, clusters can be well distinguished (Fig. 8). The kinetic analysis shows that the mutation decreases the opening rate of the template receptor ∼8-fold (Table 2). Such decrease is similar to that observed in the αM2-L11′F with respect to the wild-type receptor (9.5-fold). We also compared the decrease in β2 due to the αM2-L11′F mutation in channels activated by ACh. The data obtained at a range of 100–1000 μM ACh were well fitted by the classical kinetic scheme for ACh activation (9). The kinetic analysis showed that β2 decreased from its wild-type value of 50,000 s−1 (9,42) to 7000 ± 300 s−1, which corresponds to a 7.1-fold change. Therefore, we can ensure that despite the low Popen of αM2-L11′F, the estimate for β2 shown in Table 2 does not contain a high degree of uncertainty.
The fast opening rate of the ɛL269F+αM1-F15′L double mutant did not allow the kinetic analysis. Nevertheless, we determined that the changes in α2, β2, and θ2 for the receptor containing the double αM1-F15′L+αM2-L11′F mutation together with the ɛL269F mutation are similar to those of the double mutant in the absence of the background mutation with respect to the corresponding template receptor (Table 2). The rates of closing and reopening from the second closed state (A2R′ in Scheme 2) are similar for all receptors containing the ɛL269F mutation. These rates were d+1: 180 ± 50, 160 ± 30, and 120 ± 50 s−1 for the ɛL269F, the double mutant (ɛL269F+αM2-L11′F), and the triple mutant (ɛL269F+αM1-F15′L+αM2-L11′F), respectively; d-1: 6800 ± 3400, 8900 ± 2500, and 3700 ± 200 s−1 for the ɛL269F, the double mutant (ɛL269F+αM2-L11′F), and the triple mutant (ɛL269F+αM1-F15′L+αM2-L11′F), respectively. The effects of the αM2-L11′F mutation are not significantly affected by the background ɛL269F mutation, as the change in the free energy of the gating equilibrium of the double mutant (ɛL269F+αM2-L11′F) is similar to the sum of the changes occurring in the two single mutants.
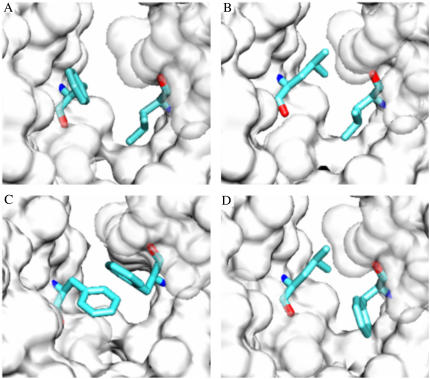
To obtain a structural view of how the mutations affect the interaction between positions 11′ of αM2 and 15′ of αM1, we modeled the structure of single- and double-mutant AChRs using the refined structure of the Torpedo AChR (PDB ID 2BG9) (37). As expected, when F15′ in αM1 is replaced by L, there is more free space in the cavity as the volume of the amino acid is reduced from 189.9 Å3 to 166.7 Å3. The replacement of αM2-L11′ by F yields several possible conformations. One of them results in an edge-to-face interaction between the mutant phenylalanine residue in M2 and αM1-F15′. The model shows that the benzyl rings of both phenylalanine residues are separated by 3.6 Å (centroid-centroid distance) and form an edge-to-face interaction with an angle of 66° (Fig. 9). This type of interaction is commonly observed in proteins and it may have a substantial role in protein stabilization (43–46). An alternative orientation of the introduced phenylalanine residue forming a displaced face-to-face interaction with αM1-F15′ is also sterically possible. Finally, the modeling of the double-mutant αM1-F15′L+αM2-L11′F shows that the interface between M1 and M2 is not substantially affected when the two residues are exchanged (Fig. 9).
FIGURE 9.
Molecular modeling of AChRs carrying mutations at αM2-11′ and αM1-15′. The refined coordinates of Torpedo AChR (PDB with accession code 2BG9) (37) were used. Molecular surface of part of αM1 and αM2 and the residues of interest as sticks are shown. (A) Wild-type AChR, (B) αM1-F15′L, (C) αM2-L11′F, and (D) αM1-F15′L+αM2-L11′F.
DISCUSSION
Position 15′ of M1 has a peculiar conservation pattern: it is phenylalanine in α subunits and isoleucine in non-α subunits (Fig. 1). We have previously studied in detail the contribution to channel gating of this position in the β subunit (13). Here we have extended the study to α, ɛ, and δ subunits. We determined that in the α subunit this position interacts with position 11′ of the M2 domain, and we showed the importance of such interaction for appropriate channel gating.
Mutations at position 15′ of M1 lead to receptors that show a wide spectrum of mean open, mean closed, and Popen values. Because the opening rate may increase in the mutants and because such increase cannot be accurately determined using ACh as an agonist, we used choline to determine channel kinetics (13,29,34). The changes in mean open time, mean closed time, and Popen follow a qualitatively similar but not quantitatively identical pattern in the mutants activated by either ACh or choline.
The diliganded gating equilibrium constant for choline, θ2, increases in all αM1 mutants, except in αF15′Y. With respect to wild-type AChRs, such increase varies from 1.8-fold in the αF15′I to 540-fold in the αF15′W. The high ratio between the smallest and largest gating equilibrium constant values suggests that this position of αM1 undergoes a pronounced change in its environment between the closed and open conformations. A similar behavior has been reported for residues at the external half of the δM2 segment (21). The changes in θ2 arise from a significant increase in the opening rate and a less profound decrease in the closing rate of the mutant with respect to wild-type AChRs (Table 1). There is a spatial gradient in the extent to which AChR mutations that change the gating equilibrium constant alter the opening versus the closing rate constant (20). More significant changes in the opening than in the closing rates, as shown here for αF15′, occur for mutations at positions that move earlier during channel gating. For example, the opening rate is significantly affected by mutations at residues located at the extracellular half of M2, whereas the closing rate is more affected by mutations at the equatorial position (position 9′) (20).
Our results show a strong correlation between the volume of the residue at position 15′ and its contribution to gating. For the α subunit, except for tryptophan, channel gating is enhanced as a function of the decrease in the volume of the amino acid. Out of eight different residues, only tryptophan shows an anomalous behavior. Although this residue has a large side chain, its presence at position 15′ dramatically enhances gating. One explanation for this behavior may be related to the unique properties of W. W prefers to have six partners around it with which it may form different types of interactions (46). Its indole ring can form aromatic π interactions to other aromatic rings, to positively charged side-chains, and/or to adjacent C-H or N-H, whereas its indole amide can function as a hydrogen-bond donor (47). Thus, it is possible that more extensive arrangements may occur in the mutant structure to accommodate the W at α15′. In addition to the volume, there is also some influence of the stereochemistry of the side chain on channel gating. This is revealed from the differences in θ2 between mutants containing L or I, which have the same volume, but L lacks the asymmetric β carbon atom. A similar result, showing that both the volume and the stereochemistry of the side chain contribute to channel gating, has been reported for αV285 in M3 (15).
Residues in the ɛ and δ subunits also contribute to gating. Interestingly, their contribution is correlated with the volume in an opposite way to that observed in the α subunit: channel gating is enhanced by increasing the volume of the residue.
Diliganded AChR gating occurs as a reversible conformational wave that connects transmitter-binding sites and the gate (36). We used REFER analysis to estimate Φ, a fraction between 0 and 1 that quantifies the extent to which the mutated region at the gating reaction transition state resembles the open conformation (20,36). In this context, Φ values provide insight into the dynamics of AChR gating, suggesting the sequence of movement of residues during the gating process since the receptor binds the agonist (16). The temporal significance of the value of Φ has been recently confirmed by simulation and theoretical studies (17,18). A Φ value close to 1 indicates that the residue moves early during the gating process, whereas a value close to 0 indicates that the residue moves late during this process. The REFER is linear for position 15′ of αM1, with a slope corresponding to a Φ value of ∼0.70. We have previously determined a value of 0.27 for position 15′ of βM1 (13), thus indicating that position 15′ in the α subunit moves earlier than the same position in β.
It has been shown that residues appear to be organized into contiguous domains within which all members have similar Φ values (18). These domains may or may not overlap secondary structural elements and may move synchronously as a unit or block (16,20). Interestingly, the Φ value obtained for αM1-15′ is similar to that calculated for the upper half of αM2 (∼0.65) (20), suggesting that these residues may move at the same time during gating. Φ values are similar at the extracellular positions 17′ and 27′ of αM2 and they are smaller at the equatorial 9′ position (20). Although the Φ value at 11′ of M2 has not been determined, it might be similar to that of residues at the extracellular half. In agreement with this, mutations in the upper half of αM2 affect more the opening than the closing rate, as shown here for αM2-L11′F. Thus, the fact that αM1-15′ shows a Φ value similar to that of the upper half of M2 agrees with our observation that the interaction between αM1-15′ and αM2-11′ is essential for appropriate channel gating, as these residues may move in block during such process.
M1 is located behind M2, forming an external ring together with M3 and M4. The structural model at 4-Å resolution (2) suggests that M2 makes minimal contacts with the other TM segments. One close apposition between αM1 and αM2 was reported to occur at M2-L253 (position 11′) and M1-F225 (position 15′) (2). The interaction between these residues may affect the relative movements of the inner and outer rings during gating. By exchanging residues between M1 and M2 segments and performing double-cycle mutant analysis, we experimentally determined that such interaction is taking place and that it plays a key role in channel gating. The kinetic analysis revealed that the single mutations at these residues affect mainly the opening rate and that this change occurs in opposite directions in the different segments. Thus, whereas the mutation in M1 improves channel opening, that in M2 impairs it. The kinetic changes are counteracted when both single mutations are combined. The double-mutant receptor, which contains the original pair of residues, shows normal gating kinetics. Thus, αF15′ in M1 and αL11′ in M2 are interchangeable in their contributions to gating. The change in free energy of gating for the double mutant differs from the sum of the changes of the two single mutants, indicating that the mutated residues are coupled (35). The double-mutant cycle analysis has been used to explore pairwise interactions between residues (48–50). When applied here, it revealed that these residues interact with each other with a coupling energy of −1.2 kcal/mol.
Modeling of the single and double mutants illustrated the experimental results. The structure of the AChR at 4-Å resolution shows that M2 is mainly separated from the other helices by water-filled spaces (2). The minimal contacts of M2 with the rest of the segments may favor the movement of M2 during gating. Thus, the increase in the volume of the side chain at the M1-M2 interacting site, as shown in the αM2-L11′F mutant receptor as well as in the αM1 mutants, might restrict such movements, thus resulting in impaired channel gating as described here. Accordingly, in the αM1-F15′L mutant, the presence of two leucine residues at the site of interaction allows M2 to move more freely, favoring channel opening. Restoring the wild-type pair of residues in the double-mutant AChR, which shows a similar structure at the M1-M2 interface, leads to normal gating.
The L-F pair is the most abundant interhelical pairwise interaction in TM regions of membrane proteins (51). Here we show that in the AChR, this interaction is essential for appropriate channel gating probably by connecting the M2 movement to the M1 movement. Finally, understanding how the TM helices interact with each other will help us to understand how the assembled receptors carry out their biological functions.
Acknowledgments
This work was supported by grants from National Research Coucil of Argentina, Universidad Nacional del Sur, National Agency for the Promotion of Science and Technology (Argentina), and a fellowship from John Simon Guggenheim Memorial Foundation to C.B.
References
- 1.Lester, H. A., M. I. Dibas, D. S. Dahan, J. F. Leite, and D. A. Dougherty. 2004. Cys-loop receptors: new twists and turns. Trends Neurosci. 27:329–336. [DOI] [PubMed] [Google Scholar]
- 2.Miyazawa, A., Y. Fujiyoshi, and N. Unwin. 2003. Structure and gating mechanism of the acetylcholine receptor pore. Nature. 424:949–955. [DOI] [PubMed] [Google Scholar]
- 3.Bouzat, C., F. Gumilar, G. Spitzmaul, H. L. Wang, D. Rayes, S. B. Hansen, P. Taylor, and S. M. Sine. 2004. Coupling of agonist binding to channel gating in an ACh-binding protein linked to an ion channel. Nature. 430:896–900. [DOI] [PubMed] [Google Scholar]
- 4.Chakrapani, S., T. D. Bailey, and A. Auerbach. 2004. Gating dynamics of the acetylcholine receptor extracellular domain. J. Gen. Physiol. 123:341–356. [DOI] [PMC free article] [PubMed] [Google Scholar]
- 5.Grutter, T., d. C. Prado, V. Dufresne, A. Taly, S. J. Edelstein, and J. P. Changeux. 2005. Molecular tuning of fast gating in pentameric ligand-gated ion channels. Proc. Natl. Acad. Sci. USA. 102:18207-18212. [DOI] [PMC free article] [PubMed] [Google Scholar]
- 6.Kash, T. L., A. Jenkins, J. C. Kelley, J. R. Trudell, and N. L. Harrison. 2003. Coupling of agonist binding to channel gating in the GABA(A) receptor. Nature. 421:272–275. [DOI] [PubMed] [Google Scholar]
- 7.Lee, W. Y., and S. M. Sine. 2005. Principal pathway coupling agonist binding to channel gating in nicotinic receptors. Nature. 438:243–247. [DOI] [PubMed] [Google Scholar]
- 8.Lummis, S. C., D. L. Beene, L. W. Lee, H. A. Lester, R. W. Broadhurst, and D. A. Dougherty. 2005. Cis-trans isomerization at a proline opens the pore of a neurotransmitter-gated ion channel. Nature. 438:248–252. [DOI] [PubMed] [Google Scholar]
- 9.Bouzat, C., F. Barrantes, and S. Sine. 2000. Nicotinic receptor fourth transmembrane domain: hydrogen bonding by conserved threonine contributes to channel gating kinetics. J. Gen. Physiol. 115:663–672. [DOI] [PMC free article] [PubMed] [Google Scholar]
- 10.Bouzat, C., F. Gumilar, M. C. Esandi, and S. M. Sine. 2002. Subunit-selective contribution to channel gating of the M4 domain of the nicotinic receptor. Biophys. J. 82:1920–1929. [DOI] [PMC free article] [PubMed] [Google Scholar]
- 11.De Rosa, M. J., D. Rayes, G. Spitzmaul, and C. Bouzat. 2002. Nicotinic receptor M3 transmembrane domain: position 8′ contributes to channel gating. Mol. Pharmacol. 62:406–414. [DOI] [PubMed] [Google Scholar]
- 12.Navedo, M., M. Nieves, L. Rojas, and J. A. Lasalde-Dominicci. 2004. Tryptophan substitutions reveal the role of nicotinic acetylcholine receptor alpha-TM3 domain in channel gating: differences between Torpedo and muscle-type AChR. Biochemistry. 43:78–84. [DOI] [PubMed] [Google Scholar]
- 13.Spitzmaul, G., J. Corradi, and C. Bouzat. 2004. Mechanistic contributions of residues in the M1 transmembrane domain of the nicotinic receptor to channel gating. Mol. Membr. Biol. 21:39–50. [DOI] [PubMed] [Google Scholar]
- 14.Wang, H. L., A. Auerbach, N. Bren, K. Ohno, A. G. Engel, and S. M. Sine. 1997. Mutation in the M1 domain of the acetylcholine receptor alpha subunit decreases the rate of agonist dissociation. J. Gen. Physiol. 109:757–766. [DOI] [PMC free article] [PubMed] [Google Scholar]
- 15.Wang, H. L., M. Milone, K. Ohno, X. M. Shen, A. Tsujino, A. P. Batocchi, P. Tonali, J. Brengman, A. G. Engel, and S. M. Sine. 1999. Acetylcholine receptor M3 domain: stereochemical and volume contributions to channel gating. Nat. Neurosci. 2:226–233. [DOI] [PubMed] [Google Scholar]
- 16.Mitra, A., T. D. Bailey, and A. L. Auerbach. 2004. Structural dynamics of the M4 transmembrane segment during acetylcholine receptor gating. Structure. 12:1909–1918. [DOI] [PubMed] [Google Scholar]
- 17.Zhou, Y., J. E. Pearson, and A. Auerbach. 2005. Φ-value analysis of a linear, sequential reaction mechanism: theory and application to ion channel gating. Biophys. J. 89:3680–3685. [DOI] [PMC free article] [PubMed] [Google Scholar]
- 18.Auerbach, A. 2005. Gating of acetylcholine receptor channels: Brownian motion across a broad transition state. Proc. Natl. Acad. Sci. USA. 102:1408–1412. [DOI] [PMC free article] [PubMed] [Google Scholar]
- 19.Chakrapani, S., T. D. Bailey, and A. Auerbach. 2003. The role of loop 5 in acetylcholine receptor channel gating. J. Gen. Physiol. 122:521–539. [DOI] [PMC free article] [PubMed] [Google Scholar]
- 20.Mitra, A., G. D. Cymes, and A. Auerbach. 2005. Dynamics of the acetylcholine receptor pore at the gating transition state. Proc. Natl. Acad. Sci. USA. 102:15069–15074. [DOI] [PMC free article] [PubMed] [Google Scholar]
- 21.Cymes, G. D., C. Grosman, and A. Auerbach. 2002. Structure of the transition state of gating in the acetylcholine receptor channel pore: a phi-value analysis. Biochemistry. 41:5548–5555. [DOI] [PMC free article] [PubMed] [Google Scholar]
- 22.Celie, P. H., S. E. Rossum-Fikkert, W. J. van Dijk, K. Brejc, A. B. Smit, and T. K. Sixma. 2004. Nicotine and carbamylcholine binding to nicotinic acetylcholine receptors as studied in AChBP crystal structures. Neuron. 41:907–914. [DOI] [PubMed] [Google Scholar]
- 23.Grutter, T., Prado de Carvalho L., N. Le Novere, P. J. Corringer, S. Edelstein, and J. P. Changeux. 2003. An H-bond between two residues from different loops of the acetylcholine binding site contributes to the activation mechanism of nicotinic receptors. EMBO J. 22:1990–2003. [DOI] [PMC free article] [PubMed] [Google Scholar]
- 24.Mukhtasimova, N., C. Free, and S. M. Sine. 2005. Initial coupling of binding to gating mediated by conserved residues in the muscle nicotinic receptor. J. Gen. Physiol. 126:23–39. [DOI] [PMC free article] [PubMed] [Google Scholar]
- 25.Bouzat, C., N. Bren, and S. M. Sine. 1994. Structural basis of the different gating kinetics of fetal and adult acetylcholine receptors. Neuron. 13:1395–1402. [DOI] [PubMed] [Google Scholar]
- 26.Engel, A. G., K. Ohno, M. Milone, H. L. Wang, S. Nakano, C. Bouzat, J. N. Pruitt, D. O. Hutchinson, J. M. Brengman, N. Bren, J. P. Sieb, and S. M. Sine. 1996. New mutations in acetylcholine receptor subunit genes reveal heterogeneity in the slow-channel congenital myasthenic syndrome. Hum. Mol. Genet. 5:1217–1227. [DOI] [PubMed] [Google Scholar]
- 27.Bouzat, C., A. M. Roccamo, I. Garbus, and F. J. Barrantes. 1998. Mutations at lipid-exposed residues of the acetylcholine receptor affect its gating kinetics. Mol. Pharmacol. 54:146–153. [DOI] [PubMed] [Google Scholar]
- 28.Hamill, O. P., A. Marty, E. Neher, B. Sakmann, and F. J. Sigworth. 1981. Improved patch-clamp techniques for high-resolution current recording from cells and cell-free membrane patches. Pflugers Arch. 391:85–100. [DOI] [PubMed] [Google Scholar]
- 29.Grosman, C., and A. Auerbach. 2000. Asymmetric and independent contribution of the second transmembrane segment 12′ residues to diliganded gating of acetylcholine receptor channels: a single-channel study with choline as the agonist. J. Gen. Physiol. 115:637–651. [DOI] [PMC free article] [PubMed] [Google Scholar]
- 30.Purohit, Y., and C. Grosman. 2006. Block of muscle nicotinic receptors by choline suggests that the activation and desensitization gates act as distinct molecular entities. J. Gen. Physiol. 127:703–717. [DOI] [PMC free article] [PubMed] [Google Scholar]
- 31.Colquhoun, D., and B. Sakmann. 1985. Fast events in single-channel currents activated by acetylcholine and its analogues at the frog muscle end-plate. J. Physiol. 369:501–557. [DOI] [PMC free article] [PubMed] [Google Scholar]
- 32.Grosman, C., and A. Auerbach. 2001. The dissociation of acetylcholine from open nicotinic receptor channels. Proc. Natl. Acad. Sci. USA. 98:14102–14107. [DOI] [PMC free article] [PubMed] [Google Scholar]
- 33.Qin, F., A. Auerbach, and F. Sachs. 1996. Estimating single-channel kinetic parameters from idealized patch-clamp data containing missed events. Biophys. J. 70:264–280. [DOI] [PMC free article] [PubMed] [Google Scholar]
- 34.Zhou, M., A. G. Engel, and A. Auerbach. 1999. Serum choline activates mutant acetylcholine receptors that cause slow channel congenital myasthenic syndromes. Proc. Natl. Acad. Sci. USA. 96:10466–10471. [DOI] [PMC free article] [PubMed] [Google Scholar]
- 35.Schreiber, G., and A. R. Fersht. 1995. Energetics of protein-protein interactions: analysis of the barnase-barstar interface by single mutations and double mutant cycles. J. Mol. Biol. 248:478–486. [DOI] [PubMed] [Google Scholar]
- 36.Grosman, C., M. Zhou, and A. Auerbach. 2000. Mapping the conformational wave of acetylcholine receptor channel gating. Nature. 403:773–776. [DOI] [PubMed] [Google Scholar]
- 37.Unwin, N. 2005. Refined structure of the nicotinic acetylcholine receptor at 4A resolution. J. Mol. Biol. 346:967–989. [DOI] [PubMed] [Google Scholar]
- 38.Jones, T. A., J. Y. Zou, S. W. Cowan, and M. Kjeldgaard. 1991. Improved methods for building protein models in electron density maps and the location of errors in these models. Acta Crystallogr. A. 47:110–119. [DOI] [PubMed] [Google Scholar]
- 39.Murshudov, G. N., A. A. Vagin, and E. J. Dodson. 1997. Refinement of macromolecular structures by the maximum-likelihood method. Acta Crystallogr. D Biol. Crystallogr. 53:240–255. [DOI] [PubMed] [Google Scholar]
- 40.Laskowski, R. A., M. W. MacArthur, D. S. Moss, and J. M. Thornton. 1993. PROCHECK: a program to check the stereochemical quality of protein structures. J. App. Crystallogr. 26:283–291. [Google Scholar]
- 41.Humphrey, W., A. Dalke, and K. Schulten. 1996. VMD: visual molecular dynamics. J. Mol. Graph. 14:33–38. [DOI] [PubMed] [Google Scholar]
- 42.Salamone, F. N., M. Zhou, and A. Auerbach. 1999. A re-examination of adult mouse nicotinic acetylcholine receptor channel activation kinetics. J. Physiol. 516:315–330. [DOI] [PMC free article] [PubMed] [Google Scholar]
- 43.Burley, S. K., and G. A. Petsko. 1988. Weakly polar interactions in proteins. Adv. Protein Chem. 39:125–189. [DOI] [PubMed] [Google Scholar]
- 44.Levitt, M., and M. F. Perutz. 1988. Aromatic rings act as hydrogen bond acceptors. J. Mol. Biol. 201:751–754. [DOI] [PubMed] [Google Scholar]
- 45.Frank, B. S., D. Vardar, D. A. Buckley, and C. J. McKnight. 2002. The role of aromatic residues in the hydrophobic core of the villin headpiece subdomain. Protein Sci. 11:680–687. [DOI] [PMC free article] [PubMed] [Google Scholar]
- 46.Singh, J., and J. M. Thornton. 1985. The interaction between phenylalanine rings in proteins. FEBS Lett. 191:1–6. [Google Scholar]
- 47.Hunter, C. A., K. R. Lawson, J. Perkins, and C. J. Urch. 2001. Aromatic interactions. J. Chem. Soc., Perkin Trans. 2. 651–669.
- 48.Bren, N., and S. M. Sine. 2000. Hydrophobic pairwise interactions stabilize alpha-conotoxin MI in the muscle acetylcholine receptor binding site. J. Biol. Chem. 275:12692–12700. [DOI] [PubMed] [Google Scholar]
- 49.Hidalgo, P., and R. MacKinnon. 1995. Revealing the architecture of a K+ channel pore through mutant cycles with a peptide inhibitor. Science. 268:307–310. [DOI] [PubMed] [Google Scholar]
- 50.Ackermann, E. J., E. T. H. Ang, J. R. Kanter, I. Tsigelny, and P. Taylor. 1998. Identification of pairwise interactions in the alpha-neurotoxin-nicotinic acetylcholine receptor complex through double mutant cycles. J. Biol. Chem. 273:10958–10964. [DOI] [PubMed] [Google Scholar]
- 51.Adamian, L., and J. Liang. 2001. Helix-helix packing and interfacial pairwise interactions of residues in membrane proteins. J. Mol. Biol. 311:891–907. [DOI] [PubMed] [Google Scholar]
- 52.Zamyatnin, A. A. 1972. Protein volume in solution. Prog. Biophys. Mol. Biol. 24:107–123. [DOI] [PubMed] [Google Scholar]


