

Abstract
Objectives. We assessed whether population rates of mammography screening, and their changes over time, were associated with improvements in breast cancer stage at diagnosis and whether the strength of this association varied by race/ethnicity.
Methods. We analyzed state cancer registry data linked to socioeconomic characteristics of patients’ areas of residence for 1990–1998 time trends in the likelihood of early stage diagnosis. We appended each cancer registry record with matching subgroup estimates of self-reported mammography screening.
Results. Trends in screening and stage at diagnosis were consistent within groups, but African American women had a significantly lower proportion of early stage cancers despite an advantage in screening. Population screening rates were significantly associated with early diagnosis, with a weaker association in African American women than White women (odds ratio [OR] = 1.70; P<.0001 vs OR=2.02; P<.0001, respectively).
Conclusions. Improvements in screening rates during the 1990s across racial/ethnic groups appear to have contributed significantly to earlier diagnosis within each group, but a smaller effect in African American women should raise concerns. A key health policy challenge is to ensure that screening effectively translates into earlier diagnosis.
Despite remarkable improvements in secondary prevention, survival after diagnosis, and mortality, breast cancer continues to be an important cause of death and morbidity among women. Mortality rates for female breast cancer have been declining by an average of 2.3% per year since 1990,1 but substantial racial/ethnic disparities persist and appear to have increased over time.2 African American women rank highest in mortality, with age-adjusted rates declining from 38.0 to 34.6 cases per 100 000 between 1990 and 2000.3 Non-Hispanic White and Hispanic women present lower rates (26.7 and 17.0, respectively, in 20003) and are followed by Asian American/Pacific Islander and Native American women.
A lower breast cancer mortality for Hispanic women relative to White women mirrors a lower incidence of the disease in the former. However, patterns of incidence and mortality are less consistent for African American women, who had an age-standardized incidence rate of 113.2 cases per 100 000 (excluding in-situ cases) in the period 1995 to 2000, compared with rates of 138.7 for non-Hispanic White women and 89.2 for Hispanic women.4 The higher breast cancer mortality observed in African American women is partly because of their poorer survival. African American and Hispanic women with breast cancer had relative risks of cancer death of 1.6 and 1.1, respectively, when compared with non-Hispanic White women in Surveillance Epidemiology and End Results registries.5 Survival is strongly related to stage at diagnosis, and African American women have a substantially higher proportion of late stage cancers than other groups.6 Differences in socioeconomic status explain a large part of differences in stage at diagnosis.7
It is widely believed that mammography screening may play an important role in reducing disparities in stage at diagnosis, survival, and mortality. There is strong evidence from randomized controlled trials that mammography reduces cancer mortality8 and may help reduce differences in stage at diagnosis between racial groups.9,10 Mammography screening rates have consistently increased over the past 2 decades,11 although there are conflicting reports on whether racial/ethnic disparities persist. A report based on 2000 National Health Interview Survey data shows lower mammography screening rates in African American and Hispanic women versus White women, by 4.2 and 11.3 percentage points, respectively, in women aged 40 years or older.12 By contrast, a report derived from pooled 1996 through 2000 data from the Behavioral Risk Factor Surveillance System (BRFSS) presents odds ratios for mammography significantly above 1 in both African American and Hispanic women relative to White women aged 40 years to 64 years (1.34 and 1.39, respectively).13 Adjustments for age and socioeconomic status, particularly income and education, explain a large part of the inconsistencies.14 However, when improvements in screening rates are realized at the population level, the extent to which these will translate into improved cancer outcomes will largely depend on the risk profile of women who change their screening behavior within each racial/ethnic group.
We used a novel approach combining survey and population data on breast cancer screening and stage at diagnosis to examine whether population rates of mammography screening, and their changes over time, are associated with improvements in stage at diagnosis and whether the strength of this association varies across racial/ethnic groups. We used stage at diagnosis data from selected state cancer registries, linked to census data on socioeconomic characteristics of patients’ areas of residence and screening data from BRFSS. The goal of the study was to provide health policymakers and public health professionals with evidence on the likely impact of further increases in screening rates and indications for the targeting of existing screening programs.
METHODS
Five state cancer registries, selected from among those meeting the certification standards of the North American Association of Central Cancer Registries during the 1990s, provided individual-level data on cases of breast cancer diagnosed between 1990 and 1998. We obtained data only for the years in which completeness standards were high and a full set of variables could be assembled by each registry, for a total of 379917 breast cancer cases (for all races/ethnicities). The aggregate population of the 5 states was 63 388400 individuals (average during the study period), of which 8.7% were non-Hispanic African American and 16.9% were Hispanic. We derived socioeconomic variables at the level of patients’ residences from 1990 and 2000 census data, by linear interpolation, to be linked to cancer registry records as proxies for individual characteristics. These variables are race-specific per capita income and education level (proportion of the same race/ethnicity with a college degree), which we linked at the census tract level for 90.7% of cases and by zip code when a tract identifier was unavailable or incorrect for 6.5% of cases (2.8% of cases could not be linked because of incorrect or missing geographic identifiers).
Cancer registries generally do not collect information on cancer screening. We therefore extracted a data set from BRFSS, the largest state-based national survey including detailed questions on screening use, to match our cancer registry data set by state and year. This data set allowed a parallel analysis of screening rates at the population level. The resulting sample included 78086 women (for all races/ethnicities), 44116 of whom were aged 40 years to 85 years (Table 1 ▶). We adjusted survey weights in the pooled sample to account for sample size differences between years and to ensure each year had equal weight. We defined a woman receiving screening as one who reported having a mammography during the past year exclusively for screening purposes. Women who had a mammography during the past year for reasons other than screening or who were younger than 40 years15 were excluded from the computation of screening rates. Screening mammography was used as the outcome variable in a logistic regression model including the following set of covariates from BRFSS, matching those available in the linked cancer registry data set: age (linear and quadratic terms; as screening rates increase with age and then drop, in women aged 40 years to 85 years), income group, education (binary; college degree vs no degree), race/ethnicity (coded as White, African American, or Hispanic), and year (treated as a continuous variable). We also included state fixed effects to account for differences between states and a year-by-race/ethnicity interaction term to account for possible differences in screening trends between racial/ethnic groups.
TABLE 1—
Characteristics of Women in Cancer Registries and the Behavioral Risk Factor Surveillance System, by Race/Ethnicity: Selected States, 1990–1998
| Non-Hispanic White | Non-Hispanic African American | Hispanic | |
| State cancer registry data | |||
| Cases, no. (%)a | 311 842 (82.1) | 23 689 (6.2) | 22 177 (5.8) |
| Aged 40–85 y, no. | 283 321 | 20 684 | 18 949 |
| Age-standardized incidence rate (per 100 000)b | 160.4 | 138.6 | 93.6 |
| Age-standardized incidence (excluding in situ cases)b,c | 138.0 | 120.1 | 82.4 |
| Age, mean (SD), y | 63.3 (14.2) | 58.6 (14.6) | 55.9 (14.3) |
| Average probability of college degree (SD), %d | 34.5 (17.7) | 22.3 (16.2) | 15.1 (12.6) |
| Average per capita income (SD), $d,e | 20 037 (10 092.61) | 11 940 (5997.43) | 10 337 (5485.47) |
| No. of cases by state (all races/ethnicities, %) | |||
| California (1990–1998) | 149 767 (76.5) | 10 829 (5.5) | 20 236 (10.3) |
| Illinois (1994–1998) | 38 685 (80.4) | 5311 (11.0) | 1506 (3.1) |
| Oregon (1996–1998) | 7035 (80.7) | 61 (0.7) | 102 (1.2) |
| Pennsylvania (1990–1998) | 88 265 (91.5) | 6984 (7.2) | . . .f |
| Washington (1992–1998) | 28 090 (91.1) | 504 (1.6) | 333 (1.1) |
| Behavioral Risk Factor Surveillance System data | |||
| Women, no. (%)a | 63 658 (74.0) | 4811 (7.1) | 6258 (13.6) |
| Women aged 40–85 y, no. | 38 403 | 2342 | 2260 |
| Weighted mean age of women aged 40–85 y only, y (SE) | 58.7 (0.09) | 56.4 (0.32) | 53.5 (0.29) |
| Probability of college education, weighted % (SE) | 24.1 (0.3) | 16.9 (1.0) | 12.2 (0.9) |
| Income group categoriese for women aged 40–85 y, no. (weighted %) | |||
| < 15 000 | 8061 (22.0) | 842 (40.5) | 788 (41.7) |
| 15 000–24 999 | 7087 (20.4) | 470 (19.5) | 450 (21.8) |
| 25 000–50 000 | 10 703 (32.5) | 542 (26.5) | 473 (23.9) |
| > 50 000 | 7516 (25.0) | 258 (13.5) | 282 (12.6) |
| Not specified | 5036 | 230 | 267 |
| No. women, weighted (weighted %) | |||
| California | 7451 (70.1) | 539 (6.2) | 1431 (16.4) |
| Illinois | 5899 (80.9) | 953 (12.9) | 323 (4.1) |
| Oregon | 8620 (94.8) | 57 (0.5) | 167 (2.0) |
| Pennsylvania | 8563 (89.9) | 686 (7.4) | 146 (1.5) |
| Washington | 7870 (92.7) | 107 (1.2) | 193 (2.3) |
Note. SE = standard error; SD = standard deviation. Behavioral Risk Factor Surveillance System survey weights were adjusted to account for sample size differences between years.
aPercentages are calculated in relation to women of all races/ethnicities who had breast cancer, not in relation to the sum of the 3 columns.
bBased on 2000 US standard population.
c These rates are reported to allow comparisons with North American Association of Central Cancer Registries incidence figures cited in the introduction.
dLinked by area of residence.
eIn constant dollars.
fInformation on ethnicity was not available from the Pennsylvania Cancer Registry; the state’s Hispanic population averaged 2.3% during the study period.
In the analysis of cancer registry data, we selected stage at diagnosis as the outcome variable influenced by screening most directly and with no time lag. Stage at diagnosis is also a strong predictor of survival.16 We used logistic regression to model the probability of early stage diagnosis, which we defined as diagnosis at the in situ or local stages versus the regional or distant stages. Covariates included age (linear and quadratic), income (logarithmic transformation), education, race/ethnicity (limited to White, African American, and Hispanic as dummy variables), year (continuous), and state fixed effects. We included a year-by-race/ethnicity interaction term.
To assess the impact of population rates of mammography screening on breast cancer stage at diagnosis, we used our BRFSS model to estimate screening probabilities specific to subgroups defined along 4 dimensions: race/ethnicity, age, year, and state. We assigned to each cancer registry record the relevant screening probability, on the basis of the individual’s characteristics along the 4 dimensions. We added screening probability as a covariate to the cancer registry model in a new analysis along with a screening-by-race/ethnicity interaction term to account for possible differences in the impact of screening by race/ethnicity. All analyses were conducted with Stata 8.0 (StataCorp LP, College Station, Tex).
RESULTS
In accordance with existing evidence,11,12 we found that mammography screening rates increased during the 1990s in all racial/ethnic groups. After age adjustments, but before income or education adjustments, African American women had screening rates not significantly different from those of White women in the early 1990s, with similarly increasing trends over the study period (Figure 1 ▶). In the same analysis, Hispanic women had consistently lower screening rates than White women. However, Hispanic women’s screening rates were increasing more rapidly than White women’s, and the difference in screening rates was no longer statistically significant at the end of the period (odds ratio [OR]=0.95; P= .658). After additional adjustments for income and education it appears that racial/ethnic disparities in screening in the 5 states were eliminated by the end of the 1990s, and minorities had even acquired a statistically significant advantage (African American vs White OR= 1.61; P<.001; Hispanic vs White OR=1.31, P=.017).
FIGURE 1—
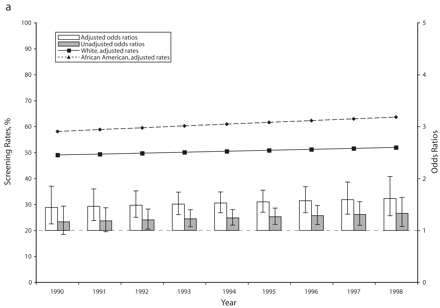
Adjusted and unadjusted trends (rates and odds ratios) in breast cancer screening for African American vs White (a) and Hispanic vs White (b) women: selected states, 1990–1998.
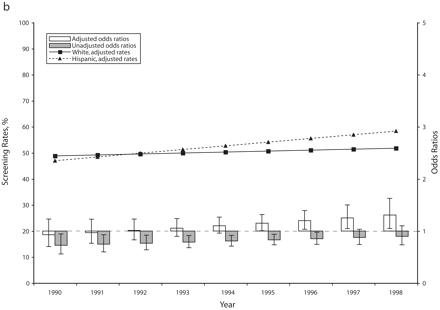
Despite a consistently higher probability of being screened (after age, income, and education adjustments), African American women who developed breast cancer during the 1990s were less likely than White women to have the condition diagnosed at an early stage (in situ or local) (Figure 2 ▶). However, within each group, trends in the proportion of early stage diagnosis were consistent with trends in screening use.
FIGURE 2—

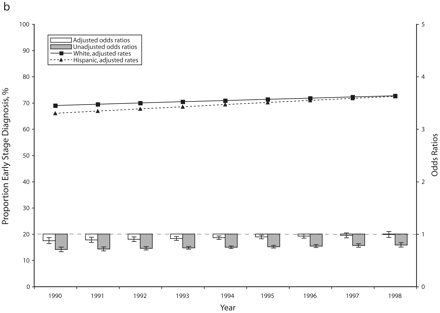
Adjusted and unadjusted trends (rates and odds ratios) in early stage breast cancer diagnosis for African American vs White (a) and Hispanic vs White (b) women: selected states, 1990–1998.
Hispanic women who developed breast cancer during the 1990s also had a somewhat lower probability of early stage diagnosis than White women, but the Hispanic women’s more steeply increasing screening rates were matched by a similar increase in the proportion of cases diagnosed at an early stage. By the end of the study period, the difference between Hispanic and White women had disappeared (after age, income, and education adjustments) (Figure 2 ▶).
After linking group-specific screening probabilities (mammography during the past year) to each cancer registry record, we were able to assess the correlation between population screening rates and the probability of early stage breast cancer diagnosis. Our analysis consistently showed that such correlation existed, but the magnitude of the effect differed between racial/ethnic groups (Table 2 ▶). White women had an odds ratio of 2.02 (P<.001) for early stage diagnosis in relation to screening use. The corresponding odds ratio for Hispanic women was only slightly higher (2.13; P<.001), probably because of the faster rising screening rates producing larger numbers of early stage diagnoses in the short term, but the difference was not statistically significant (P=.547 for the interaction term). On the other hand, the odds ratio for African American women was significantly lower than that observed for White women (1.70; P<.001, and P=.047 for the interaction term), indicating a weaker correlation between population screening rates and probability of early stage diagnosis. To illustrate the magnitude of these correlations, we compared them with the correlation existing between stage at diagnosis and our measure of socioeconomic condition (per capita income), also statistically significant in our analysis (P<.001). An increase in population screening rates for White women of 10 points above the average observed in the study period would have the same effect on the probability of early diagnosis as a 37.5% increase in per capita income, other things being equal. An equivalent increase in screening rates for African American women would have an effect similar to a 28% increase in average per capita income.
TABLE 2—
Odds Ratios of Screening Probability for Early Stage Diagnosis of Breast Cancer in Women, by Racial/Ethnic Group: Selected States, 1990–1998
| OR (95% CI) | SE | P | P Interaction Terma | |
| White | 2.02 (1.885, 2.165) | 0.071 | <.001 | . . . |
| African American | 1.70 (1.451, 2.000) | 0.139 | <.001 | 0.047 |
| Hispanic | 2.13 (1.817, 2.485) | 0.170 | <.001 | 0.547 |
Note. OR = odds ratio; CI = confidence interval.
aInteraction term screening-by-race/ethnicity (baseline White).
DISCUSSION
With our study, we attempted to shed new light on racial/ethnic disparities in breast cancer prevention and outcomes. In particular, we focused on the impact of changes in population screening rates on stage at diagnosis. The data and methods we used were not designed to provide answers on the effectiveness of screening at the individual level. Rather, they contributed to our understanding of population-level dynamics, including factors such as group behaviors and risk profiles.
In the 5 states we covered in our study, we accounted for any persisting racial/ethnic disparities in mammography screening with socioeconomic differences between groups. After we adjusted screening rates to reflect income and education differences, minorities’ screening rates were higher than those for White women by the end of the 1990s. This finding is consistent with other reports derived from BRFSS11,12,17 and Medical Expenditure Panel Survey18,19 data. National Health Interview Survey data show lower unadjusted screening rates for minority women compared with White women, but with a non-significant difference.12,14 Evidence of the elimination of racial disparities after adjustment for socioeconomic characteristics is also available from studies of medical records.20
The National Breast and Cervical Cancer Early Detection Program (NBCCEDP) for low-income women likely contributed to the improved screening rates for minorities during the 1990s. A comparison of shares of NBCCEDP beneficiaries and population shares in the bottom income quartile from each race/ethnicity shows that White women have been largely underrepresented among recipients of screening under the program, and Hispanic women have been overrepresented.21
The trends and disparities that we observed in stage at diagnosis are also in line with those reported elsewhere,6 although large-scale studies of cancer outcomes have to rely, as we did, on characteristics of patients’ areas of residence as measures of socioeconomic condition in multivariate analyses.22
A key finding from our study is that the probability of having breast cancer diagnosed at an early stage is significantly correlated with population rates of mammography screening after adjustments for age, income, and education and after accounting for state fixed effects and underlying time trends. This finding suggests that the improvements in screening rates during the 1990s across the 3 main racial/ethnic groups were likely at least partly responsible for the improvements observed in the probability of early stage diagnosis during the same period. The effect was similarly strong in White and Hispanic women but weaker in African American women. This finding is of particular concern and is likely the result of a complex interplay of individual characteristics, behavioral factors, and provider and health plan characteristics. We suggest a number of explanations for our finding.
Possible Explanations
First, the group risk profiles of African American and White women undergoing screening may differ in our study, with a smaller proportion of high-risk African American women among those screened. Most authors of studies on screening behavior in women at high risk have failed to provide direct racial comparisons. Sabatino et al. did not identify significant racial differences in screening behavior in a multivariate model.23 However, lack of health insurance or physician recommendation, the latter partly associated with rarely or never seeing a doctor, appeared to be common features in high-risk women not undergoing screening. There is evidence that African American women with a family history of breast or ovarian cancer make less use of genetic counseling and testing than do White women (after adjustments for socioeconomic and other characteristics; OR=0.28).24 Perceived risk is positively associated with mammography screening,25 and African American women appear to underestimate their risk.26,27
An association has been established between obesity, which is more prevalent in African American women than in White or Hispanic women, and late stage breast cancer diagnosis.28,29 Although obesity may not lead to a lower uptake of mammography screening among African American women,30 its association with stage at diagnosis appears to hold even in screening-detected cancers.31
A second explanation for our finding is that appropriate diagnosis may not follow screening, or may follow in a less timely fashion, in a larger proportion of African American women than White or Hispanic women. A previous article assessing the probability that women receive at least some follow-up for abnormal screening test results indicated that racial/ethnic differences disappear after adjustments for other sociodemographic characteristics.32 Similar conclusions have been reported for immediate and 6-month follow-up of abnormal mammograms.33 However, other studies have shown that minority women have longer delays than White women in the follow-up of abnormal results.34,35
A phenomenon described as “statistical discrimination”36,37 may lead to different probabilities of diagnosing, or initiating treatment, in different racial/ethnic groups when certain groups have a lower probability (incidence) of the disease or a poorer test performance. The sensitivity and specificity of mammography do not differ significantly in African American and White women,38 but the incidence of the disease is lower in African American women.4,39 In theory, this lower incidence of disease might affect physician recommendations for screening and diagnostic follow-up. No recent evidence of such an effect exists, although a survey completed in 1990 did show that a sizable proportion of physicians tend not to recommend mammography at the intervals prescribed by existing guidelines in the absence of known risk factors for cancer.40
Lack of insurance is also a potential barrier to diagnostic follow-up. We did not have insurance information in our analysis of stage at diagnosis. Even NBCCEDP’s funding made available for diagnostic follow-up during the study period was limited.41 Economic recession and high unemployment,42 as well as cultural beliefs and attitudes,43 have been found to affect African American women’s chances of early stage breast cancer diagnosis more than White women’s, although it is unclear whether this effect is because of reduced diagnostic follow-up.
Other important provider and health plan factors likely play a role in explaining the weaker impact of screening in African American women. Recent evidence indicates that primary care physicians who treat African American patients are less likely to be board certified and to have access to high-quality specialist services than those who treat White patients.44 Access to culturally competent care may have been hampered in some cases by the increasing diffusion of managed care.45 Whereas the latter appears to have had an overall positive impact on mammography uptake46 and breast cancer stage at diagnosis,47 the benefits are not always apparent in African American women.48
All the factors discussed so far likely play a role in explaining the weaker association between screening uptake and early diagnosis in African American women relative to White women. Some factors also contribute to explaining why the same difference was not observed between Hispanic and White women. At the individual level, factors such as obesity and poor awareness of high-risk status are more prevalent among African American than among Hispanic women.26 On the provider side, concerns about the level of training and access to high-quality specialist services have been raised specifically about physicians who care for African American patients.44 The increased emphasis on prevention linked to the diffusion of managed care also appears to have been less beneficial to African American than to Hispanic women.48
Limitations
We considered 2 forms of bias possibly affecting our analysis: overdiagnosis and self-report. Screening may lead to overdiagnosis by detecting cancers that would not have become symptomatic or more advanced.49 Overdiagnosis is particularly possible for a number of early cancers, which means that the proportion of early stage diagnoses may be inflated by screening. It is estimated that the use of aggressive surgery is increased by 30% in women who receive screening compared with women who do not.50 Assuming a linear relation between screening probability and overdiagnosis (which seems justified in the observed range of screening rates), and assuming that overdiagnosis is confined to early stage cancers, we would have to observe screening rates about 50 percentage points lower in African American women than in White women (after adjustments for age, income, and education) to be able to explain the difference in early stage diagnosis between the 2 groups. Overdiagnosis is also unlikely to explain to a significant extent the changes observed over time in early diagnosis within each group.
Self-report bias arises from inaccuracies in the reporting of screening in survey interviews. Self-reports tend to overestimate screening rates, although the bias relates more to the timing of the last screening test than whether a test was actually delivered.51 Recent tests are associated with more accurate recall, although more inclusive intervals may cancel out some of the recall bias. An assessment of the reliability of BRFSS screening data is not available. A comparison of National Health Interview Survey screening data, of questions similar to those used in BRFSS, and Medicare records showed an overall difference in screening rates of 13.5 percentage points, half of which was explained by the combination of self-report bias and missing claims.52 We have no reason to believe that time trends were affected by changes in self-report bias during our study period. Also, our adjustments for age, income, and education should compensate for most of the variation between subgroups, although a residual variation by race is possible. Evidence from racial/ethnic comparisons is limited and contradictory (e.g., Hiatt et al. report no difference in bias between White and Latino women,53 whereas Zapka et al. report a difference between White and non-White women54). Overall, self-report bias is very unlikely to be responsible for a substantial part of our observed effect of population screening rates on stage at diagnosis or for the differences identified between racial/ethnic groups.
Conclusions
If policymakers consider the disadvantage (4.5 percentage points, on average) in early stage diagnosis suffered by African American women during the 1990s important enough to warrant their attention, our study indicated that a key to successful policies is to ensure that improvements in screening rates effectively translate into earlier stage diagnosis for African American women. This goal seems even more important than further increases in screening rates. Policies should focus on (1) improving the chances that higher risk women take up screening, (2) ensuring adherence to guidelines on the appropriate timing of screening, and (3) avoiding missed or delayed follow-up on screening test results. Policymakers need to consider provider and health plan factors as well as individual factors. Factors that may determine a lower impact of health services, such as screening, on the health outcomes of African American women should be of particular concern. Redressing the differences between physicians who care predominantly for African American patients and those who care predominantly for White patients should be a priority, as should reducing provider bias. The ability of health plans to ensure equal quality of care across racial groups has improved in recent years.55 Some health plans have adopted active approaches to reduce disparities with data collection and analysis, communication, and cultural competency training,56 and more should follow in these steps. Researchers and policymakers should make efforts to identify and reduce or eliminate other possible causes for the racial differences we observed.
Acknowledgments
Franco Sassi was supported in part by a fellowship from the Commonwealth Fund, New York, NY.
We are grateful for the support received from the cancer registries of California, Illinois, Oregon, Pennsylvania, and Washington, particularly Bob Schlag and David Harris (California); Jan Snodgrass and Lori Havener (Illinois); Recinda Sherman, Donald Shipley, and Katrina Hedberg (Oregon); and Joe Campo, Kathryn Golub, and Mahesh Keitheri Cheteri (Washington). The authors are also grateful to Francesca Borgonovi for her contribution to the data analysis and to Eunice Chee for assistance throughout the project.
Note. The authors remain solely responsible for the contents of this article, which does not necessarily reflect the views of the Commonwealth Fund, the state cancer registries, or any of the organizations that made available the data we used.
Human Participant Protection The study was approved and monitored by the committee on human research of the University of California, San Francisco, and by the Washington State Department of Social and Health Services human research review section.
Peer Reviewed
Contributors F. Sassi originated and designed the study, conducted the analyses, interpreted the results, and wrote the article. H. S. Luft and E. Guadagnoli contributed to the design of the study and interpretation of the results.
References
- 1.Edwards BK, Brown ML, Wingo PA, et al. Annual report to the nation on the status of cancer, 1975–2002, featuring population-based trends in cancer treatment. J Natl Cancer Inst. 2005;97:1407–1427. [DOI] [PubMed] [Google Scholar]
- 2.Kochanek KD, Murphy SL, Anderson RN, Scott C. Deaths: final data for 2002. Natl Vital Stat Rep. October 12, 2004;53(5):1–1150. [PubMed] [Google Scholar]
- 3.Stewart SL, King JB, Thompson TD, Friedman C, Wingo PA. Cancer mortality surveillance—United States, 1990–2000. MMWR Surveill Summ. 2004; 53(SS-3):1–108. [PubMed] [Google Scholar]
- 4.Howe HL, Carozza S, O’Malley C, et al., eds. Cancer in US Hispanics/Latinos, 1995–2000. Springfield, Ill: North American Association of Central Cancer Registries; 2003.
- 5.Clegg LX, Li FP, Hankey BF, Chu K, Edwards BK. Cancer survival among US whites and minorities: a SEER (Surveillance, Epidemiology, and End Results) Program population-based study. Arch Intern Med. 2002;162:1985–1993. [DOI] [PubMed] [Google Scholar]
- 6.Li CI, Malone KE, Daling JR. Differences in breast cancer stage, treatment, and survival by race and ethnicity. Arch Intern Med. 2003;163:49–56. [DOI] [PubMed] [Google Scholar]
- 7.Schwartz KL, Crossley-May H, Vigneau FD, Brown K, Banerjee M. Race, socioeconomic status and stage at diagnosis for five common malignancies. Cancer Causes Control. 2003;14:761–766. [DOI] [PubMed] [Google Scholar]
- 8.Kerlikowske K, Grady D, Rubin SM, Sandrock C, Ernster VL. Efficacy of screening mammography. A meta-analysis. JAMA. 1995;273:149–154. [PubMed] [Google Scholar]
- 9.McCarthy EP, Burns RB, Freund KM, et al. Mammography use, breast cancer stage at diagnosis, and survival among older women. J Am Geriatr Soc. 2000; 48:1226–1233. [DOI] [PubMed] [Google Scholar]
- 10.Oluwole SF, Ali AO, Adu A, et al. Impact of a cancer screening program on breast cancer stage at diagnosis in a medically underserved urban community. J Am Coll Surg. 2003;196:180–188. [DOI] [PubMed] [Google Scholar]
- 11.Blackman DK, Bennett EM, Miller DS. Trends in self-reported use of mammograms (1989–1997) and Papanicolaou tests (1991–1997)—Behavioral Risk Factor Surveillance System. MMWR Surveill Summ. 1999; 48(SS-6):1–22. [PubMed] [Google Scholar]
- 12.Swan J, Breen N, Coates RJ, Rimer BK, Lee NC. Progress in cancer screening practices in the United States: results from the 2000 National Health Interview Survey. Cancer. 2003;97:1528–1540. [DOI] [PubMed] [Google Scholar]
- 13.Adams EK, Florence CS, Thorpe KE, Becker ER, Joski PJ. Preventive care: female cancer screening, 1996–2000. Am J Prev Med. 2003;25:301–307. [DOI] [PubMed] [Google Scholar]
- 14.Rao RS, Graubard BI, Breen N, Gastwirth JL. Understanding the factors underlying disparities in cancer screening rates using the Peters-Belson approach: results from the 1998 National Health Interview Survey. Med Care. 2004;42:789–800. [DOI] [PubMed] [Google Scholar]
- 15.Leitch AM, Dodd GD, Costanza M, et al. American Cancer Society guidelines for the early detection of breast cancer: update 1997. CA Cancer J Clin. 1997; 47:150–153. [DOI] [PubMed] [Google Scholar]
- 16.Sant M, Allemani C, Capocaccia R, et al. Stage at diagnosis is a key explanation of differences in breast cancer survival across Europe [published correction appears in Int J Cancer. 2003;107:1058]. Int J Cancer. 2003;106:416–422. [DOI] [PubMed] [Google Scholar]
- 17.Nelson DE, Bland S, Powell-Griner E, et al. State trends in health risk factors and receipt of clinical preventive services among US adults during the 1990s. JAMA. 2002;287:2659–2667. [DOI] [PubMed] [Google Scholar]
- 18.Phillips KA, Haas JS, Liang S, et al. Are gatekeeper requirements associated with cancer screening utilization? Health Serv Res. 2004;39:153–178. [DOI] [PMC free article] [PubMed] [Google Scholar]
- 19.Jones AR, Caplan LS, Davis MK. Racial/ethnic differences in the self-reported use of screening mammography. J Community Health. 2003;28:303–316. [DOI] [PubMed] [Google Scholar]
- 20.Schneider EC, Zaslavsky AM, Epstein AM. Racial disparities in the quality of care for enrollees in Medicare managed care. JAMA. 2002;287:1288–1294. [DOI] [PubMed] [Google Scholar]
- 21.Lawson HW, Henson R, Bobo JK, Kaeser MK. Implementing recommendations for the early detection of breast and cervical cancer among low-income women. MMWR Recomm Rep. 2000;49(RR-2):37–55. [PubMed] [Google Scholar]
- 22.Singh GK, Miller BA, Hankey BF, Edwards BK. Area Socioeconomic Variations in US Cancer Incidence, Mortality, Stage, Treatment, and Survival, 1975–1999. Bethesda, Md: National Cancer Institute; 2003. NCI Cancer Surveillance Monograph Series, No. 4. NIH Publication No. 03-5417.
- 23.Sabatino SA, Burns RB, Davis RB, Phillips RS, Chen YH, McCarthy EP. Breast carcinoma screening and risk perception among women at increased risk for breast carcinoma: results from a national survey. Cancer. 2004;100:2338–2346. [DOI] [PubMed] [Google Scholar]
- 24.Armstrong K, Micco E, Carney A, Stopfer J, Putt M. Racial differences in the use of BRCA1/2 testing among women with a family history of breast or ovarian cancer. JAMA. 2005;293:1729–1736. [DOI] [PubMed] [Google Scholar]
- 25.Katapodi MC, Lee KA, Facione NC, Dodd MJ. Predictors of perceived breast cancer risk and the relation between perceived risk and breast cancer screening: a meta-analytic review. Prev Med. 2004;38:388–402. [DOI] [PubMed] [Google Scholar]
- 26.Audrain J, Lerman C, Rimer B, et al. Awareness of heightened breast cancer risk among first-degree relatives of recently diagnosed breast cancer patients. Cancer Epidemiol Biomarkers Prev. 1995;4:561–565. [PubMed] [Google Scholar]
- 27.Hughes C, Lerman C, Lustbader E. Ethnic differences in risk perception among women at increased risk for breast cancer. Breast Cancer Res Treat. 1996; 40:25–35. [DOI] [PubMed] [Google Scholar]
- 28.Moorman PG, Jones BA, Millikan RC, Hall IJ, Newman B. Race, anthropometric factors, and stage at diagnosis of breast cancer. Am J Epidemiol. 2001;153:284–291. [DOI] [PubMed] [Google Scholar]
- 29.Jones BA, Kasi SV, Curnen MG, Owens PH, Dubrow R. Severe obesity as an explanatory factor for the black/white difference in stage at diagnosis of breast cancer. Am J Epidemiol. 1997;146:394–404. [DOI] [PubMed] [Google Scholar]
- 30.Wee CC, McCarthy EP, Davis RB, Phillips RS. Obesity and breast cancer screening. J Gen Intern Med. 2004;19:324–331. [DOI] [PMC free article] [PubMed] [Google Scholar]
- 31.Hunt KA, Sickles EA. Effect of obesity on screening mammography: outcomes analysis of 88346 consecutive examinations. AJR Am J Roentgenol. 2000; 174:1251–1255. [DOI] [PubMed] [Google Scholar]
- 32.Yabroff KR, Breen N, Vernon SW, Meissner HI, Freedman AN, Ballard-Barbash R. What factors are associated with diagnostic follow-up after abnormal mammograms? Findings from a US National Survey. Cancer Epidemiol Biomarkers Prev. 2004;13:723–732. [PubMed] [Google Scholar]
- 33.McCarthy BD, Yood MU, Janz NK, Boohaker EA, Ward RE, Johnson CC. Evaluation of factors potentially associated with inadequate follow-up of mammographic abnormalities. Cancer. 1996;77:2070–2076. [DOI] [PubMed] [Google Scholar]
- 34.Chang SW, Kerlikowske K, Napoles-Springer A, Posner SF, Sickles EA, Perez-Stable EJ. Racial differences in timeliness of follow-up after abnormal screening mammography. Cancer. 1996;78:1395–1402. [DOI] [PubMed] [Google Scholar]
- 35.Elmore JG, Nakano CY, Linden HM, Reisch LM, Ayanian JZ, Larson EB. Racial inequities in the timing of breast cancer detection, diagnosis, and initiation of treatment. Med Care. 2005;43:141–148. [DOI] [PubMed] [Google Scholar]
- 36.Balsa AI, McGuire TG. Statistical discrimination in health care. J Health Econ. 2001;20:881–907. [DOI] [PubMed] [Google Scholar]
- 37.Balsa AI, McGuire TG, Meredith LS. Testing for statistical discrimination in health care. Health Serv Res. 2005;40:227–252. [DOI] [PMC free article] [PubMed] [Google Scholar]
- 38.Gill KS, Yankaskas BC. Screening mammography performance and cancer detection among black women and white women in community practice. Cancer. 2004;100:139–148. [DOI] [PubMed] [Google Scholar]
- 39.Ries LAG, Eisner MP, Kosary CL, et al., eds. SEER Cancer Statistics Review, 1975–2002. Bethesda, Md: National Cancer Institute; 2005.
- 40.Czaja R, McFall SL, Warnecke RB, Ford L, Kaluzny AD. Preferences of community physicians for cancer screening guidelines. Ann Intern Med. 1994; 120:602–608. [DOI] [PubMed] [Google Scholar]
- 41.Henson RM, Wyatt SW, Lee NC. The National Breast and Cervical Cancer Early Detection Program: a comprehensive public health response to two major health issues for women. J Public Health Manag Pract. 1996;2:36–47. [PubMed] [Google Scholar]
- 42.Catalano RA, Satariano WA, Ciemins EL. Unemployment and the detection of early stage breast tumors among African Americans and non-Hispanic whites. Ann Epidemiol. 2003;13:8–15. [DOI] [PubMed] [Google Scholar]
- 43.Lannin DR, Mathews HF, Mitchell J, Swanson MS, Swanson FH, Edwards MS. Influence of socioeconomic and cultural factors on racial differences in late-stage presentation of breast cancer. JAMA. 1998;279:1801–1807. [DOI] [PubMed] [Google Scholar]
- 44.Bach PB, Pham HH, Schrag D, Tate RC, Hargraves JL. Primary care physicians who treat blacks and whites. N Engl J Med. 2004;351:575–584. [DOI] [PubMed] [Google Scholar]
- 45.Leigh WA, Lillie-Blanton M, Martinez RM, Collins KS. Managed care in three states: experiences of low-income African Americans and Hispanics. Inquiry. 1999;36:318–331. [PubMed] [Google Scholar]
- 46.Baker LC, Phillips KA, Haas JS, Liang SY, Sonneborn D. The effect of area HMO market share on cancer screening. Health Serv Res. 2004;39:1751–1772. [DOI] [PMC free article] [PubMed] [Google Scholar]
- 47.Kirsner RS, Ma F, Fleming L, et al. The effect of Medicare health care systems on women with breast and cervical cancer. Obstet Gynecol. 2005;105:1381–1388. [DOI] [PubMed] [Google Scholar]
- 48.Haas JS, Phillips KA, Sonneborn D, McCulloch CE, Liang SY. Effect of managed care insurance on the use of preventive care for specific ethnic groups in the United States. Med Care. 2002;40:743–751. [DOI] [PubMed] [Google Scholar]
- 49.Gotzsche P. On the benefits and harms of screening for breast cancer. Int J Epidemiol. 2004;33:56–64. [DOI] [PubMed] [Google Scholar]
- 50.Olsen O, Gotzsche PC. Cochrane review on screening for breast cancer with mammography [published correction appears in Lancet. 2006;367:474]. Lancet. 2001;358:1340–1342. [DOI] [PubMed] [Google Scholar]
- 51.Gordon NP, Hiatt RA, Lampert DI. Concordance of self-reported data and medical record audit for six cancer screening procedures. J Natl Cancer Inst. 1993; 85:566–570. [DOI] [PubMed] [Google Scholar]
- 52.May DS, Trontell AE. Mammography use by elderly women: a methodological comparison of two national data sources. Ann Epidemiol. 1998;8:439–444. [DOI] [PubMed] [Google Scholar]
- 53.Hiatt RA, Perez-Stable EJ, Quesenberry C Jr., Sabogal F, Otero-Sabogal R, McPhee SJ. Agreement between self-reported early cancer detection practices and medical audits among Hispanic and non-Hispanic white health plan members in northern California. Prev Med. 1995;24:278–285. [DOI] [PubMed] [Google Scholar]
- 54.Zapka JG, Bigelow C, Hurley T, et al. Mammography use among sociodemographically diverse women: the accuracy of self-report. Am J Public Health. 1996; 86:1016–1021. [DOI] [PMC free article] [PubMed] [Google Scholar]
- 55.Trivedi AN, Zaslavsky AM, Schneider EC, Ayanian JZ. Trends in the quality of care and racial disparities in Medicare managed care. N Engl J Med. 2005;353:692–700. [DOI] [PubMed] [Google Scholar]
- 56.Hassett P. Taking on racial and ethnic disparities in health care: the experience at Aetna. Health Aff (Millwood). 2005;24:417–420. [DOI] [PubMed] [Google Scholar]