

Abstract
Extremely large but very short (20 kV/cm, 300 nanosecond) electric field pulses were reported recently to non-thermally destroy melanoma tumors. The stated mechanism for field penetration into cells is pulse characteristic times faster than charge redistribution (displacement currents). Here we use a multicellular model with irregularly shaped, closely spaced cells to show that instead overwhelming pore creation (supra-electroporation) is dominant, with field penetration due to pores (ionic conduction currents) during most of the pulse. Moreover, the model’s maximum membrane potential (about 1.2 V) is consistent with recent experimental observations on isolated cells. We also use the model to show that conventional electroporation resulting from 100 microsecond, 1 kV/cm pulses yields a spatially heterogeneous electroporation distribution. In contrast, the melanoma-destroying pulses cause nearly homogeneous electroporation of cells and their nuclear membranes. Electropores can persist for times much longer than the pulses, and are likely to be an important mechanism contributing to cell death.
Keywords: Tissue electroporation, tumor destruction, multicellular model, conventional electroporation, supra-electroporation, transport lattice
Introduction
Very short duration, extremely large voltage electrical pulses have been reported to initiate apoptosis in tumor cells and inhibit tumor growth [1, 2]. Recently, 300 ns pulses of 20–80 kV/cm field strength were shown to cause melanoma tumor cell nuclei to shrink and to eventually lead to tumor destruction [2]. These drug-free effects have generated considerable interest in the application of such pulses to treat skin tumors. Accordingly, there is now a strong motivation to understand how electric field pulses interact with the closely spaced cells within a solid tissue. However, the close proximity of tissue cells means that the often used approximation of widely spaced cells cannot be used. instead be considered. The motivations for tissue electroporation (EP) range from studying reversible electrical breakdown in relatively simple tissue in vitro [3] to tumor treatment by introducing cancer drugs to tumors in vivo [4, 5] and transdermal drug delivery in vitro and in vivo [6] to investigations of gene therapy [7, 8]. Here, we study the electrical response of a multicellular system that is a didactic tissue model [9].
EP is widely used to manipulate cells and tissues, but development and refinement of EP protocols remain empirical. Experiments are carried out on systems ranging from artificial planar bilayer membranes to synthetic and natural vesicles to individual cells in vitro and to solid tissues in vivo. Conventional EP pulses with durations greater than the plasma membrane charging time, τPM (0.2 to 1 μs), and magnitudes 0.1 to 1 kV/cm have been used for a quarter century to transport a variety of molecules, including proteins and DNA, across the plasma membrane [10–15]. Supra-EP pulses with durations less than τPM and magnitudes 10 to 100 kV/cm have been shown to affect intracellular and membrane processes such as caspase activation, phosphatidylserine (PS) translocation, and disruption of nuclear DNA [16–20] , but cause only minimal transport of small membrane integrity dyes (propidium iodide, ethidium homodimer) into cells. Further, using a theoretical model at the cellular and subcellular levels it was recently shown that supra-EP electrical responses involve fields that go through cells and organelles, whereas conventional EP fields mostly go around cells [21]. In the case of a tissue, the response to small, non-electroporating fields will be concentrated at the cell membranes and membranes of cell layers with tight junctions.
The EP response of a cell membrane to elevated transmembrane voltages, Δψ m, is hypothesized to involve a nonlinear creation of membrane-penetrating defects (hydrophilic pores or “pores”) that create new membrane conductive pathways. The increased ionic conduction tends to decrease Δψm(t) even as a pulse is charging the membrane [22–24]. The complicated interaction between spatially distributed charge transport pathways governs the electrical behavior of the system, which is particularly complicated for a multicellular system in which cells are in close proximity. A transport lattice system model allows such systems to be represented approximately. Here we employ a local asymptotic model of EP [21,25,26], an approximation to the Smoluchowski equation-based pore models [23, 27–33], on a transport lattice to investigate the difference in the electrical response of the multicellular model to conventional and supra-EP. An example of a conventional EP pulse is a 100 μs trapezoidal pulse with 1 μs rise and fall times. This is widely used in vivo for electrochemotherapy (ECT) based on bleomycin delivery into cells. An example of a supra-EP pulse is an experimental pulse of 300 ns duration used by Nuccitelli and co-workers [2]. For both pulses the response is described quantitatively in terms of microdosimetry [21], a description of the fields and membrane potentials that occur at the cellular level in response to an externally applied field. In addition, the local membrane sites that are electroporated, and the numbers of pores in the plasma membrane and organelle membranes are used to distinguish the cellular responses of conventional and supra-EP.
Methods
We employ the transport lattice method to determine the electrical response of a multicellular model. Basic features of the lattice transport method are described elsewhere [9,25,34–38], and all model parameters are given in Table 1.
Table 1.
| Parameter | Description | Value |
|---|---|---|
| Nx × Ny | number of nodes | 131 × 131 |
| Lx × Ly × Lz | system model volume (μm3) | 131 × 131 × 1 |
| ℓ | lattice spacing (μm) | 1.0 |
| dm | membrane thickness (nm) | 5 |
| ∊e | electrolyte relative permittivity | 80 |
| ∊m | membrane relative permittivity | 5 |
| ∊l | local lipid relative permittivity | 2.1 |
| σe | extracellular conductivity (S m−1) | 1.2 |
| σi | intracellular conductivity (S m−1) | 0.3 |
| T | temperature (K) | 300 |
| dNM | nucleus intermembrane space thickness (nm) | 10 |
| ΔψPM,rest | PM resting potential (mV) | −90 |
| ΔψNM,rest | NM resting potential (mV) | 0 |
| ΔψTJ,rest | TJ resting potential (mV) | 0 |
Multicellular system model
The system geometry was derived from a drawing of a didactic multicellular model [9] (Fig. 1a). The geometry features a layer of cells connected by tight junctions (TJ), an invagination and a gap accompanied by several layers of cells with approximately 15% interstitital fluid volume. Each cell in the multicellular model contains a nucleus. A transport lattice (131 nodes × 131 nodes) was constructed from the geometry by interconnecting local models on a Cartesian lattice. The individual cells within the multicellular cell system have model for a plasma membrane (PM), nuclear membrane (NM), and in some cases adjacent double membranes of tight junctions (TJ) as shown in Fig. 1b.
Figure 1. Geometry, models and waveforms.
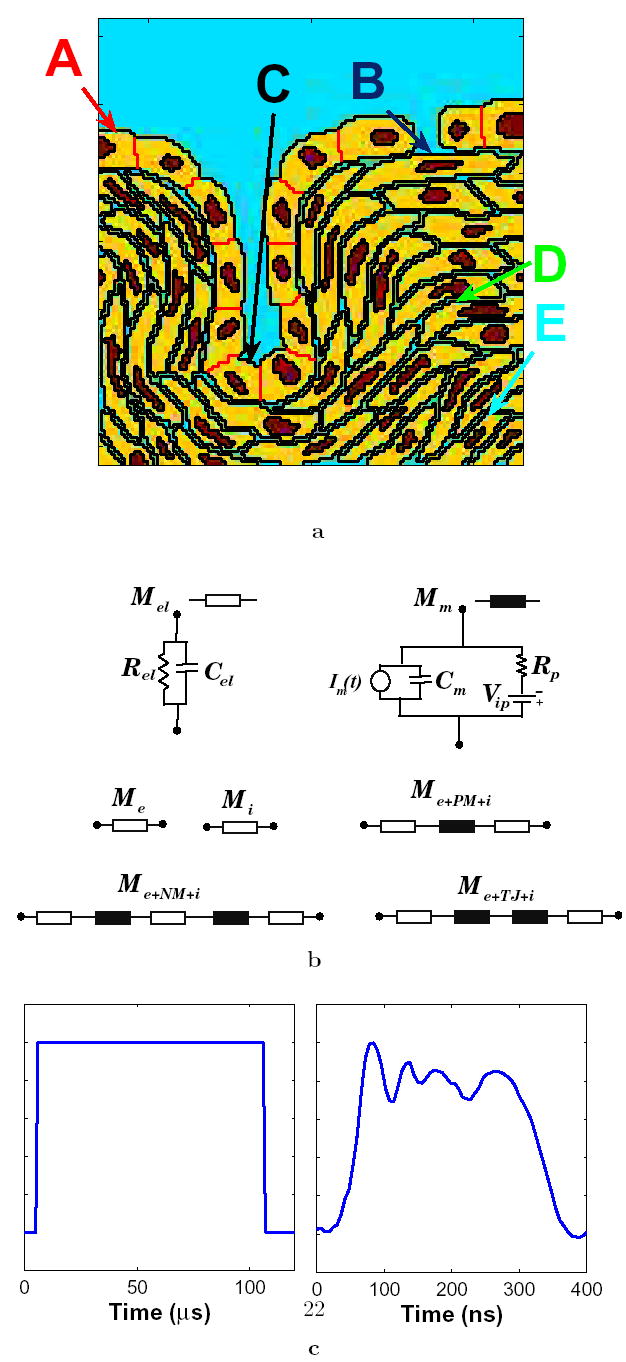
(a) Annotated geometry of the didactic multicellular model of a region of tissue [9]. The multicellular system has a row of cells with tight junctions including a gap in the cell layer. The tight junction layer forms an invagination. The underlying cells are separated by 15% interstitial space. The extracellular electrolyte is shown in blue, the nuclei in red, the cells in yellow and the tight junctions in black. The annotation refers to the five sites used in transmembrane voltage and pore density plots of Fig. 6. (b) Functional local models that represent electrolyte (Mel) and membrane (Mm) in the 131 × 131 transport lattice. Transport lattice elements that represent the extracellular medium and cytosol, plasma membrane-electrolyte interface, nuclear membrane-electrolyte interface, and tight junction-electrolyte interface are shown. Details of these local models are described elsewhere [9, 21, 25]. (c) Pulse waveform shapes used here: trapezoidal pulse of 100 μs with 1 μs rise and fall times, and an irregularly shaped 300 ns experimental pulse waveform [2].
Membrane models
The membrane models include components for charge storage and conduction, resting potential, and asymptotic model of EP (Fig. 1b). These membrane models are sandwiched between two electrolyte models to account for the electrolytes on either side of the membrane, and provide a means for combining ~5 nm thick membrane with μm scale transport lattice that describe ~60 cells in a system model with sides of ~200 μm. The PM model includes one membrane model placed between the models for extracellular medium and cytosol. The TJ model contains two membrane models in series between two cytosol models. The NM is represented by two membranes separated by a thin layer of electrolyte. The TJ and NM are assumed to have zero resting potential while the PM has a resting transmembrane voltage of −90 mV.
Conductive and dielectric properties used in the local models
The dielectric constant of the extra-and intracellular electrolytes, εe, is 80. Close to a pore the membrane dielectric is treated as pure lipid and assigned a dielectric constant, ∊l, of 2.1. This choice recognizes that local membrane properties are relevant to pore formation. In contrast, PM and organelle membrane capacitance values involve a spatial average over membrane lipid and protein regions, leading to a relative permittivity, εm, of 5, for a typical cell membrane. The extracellular electrolyte has a conductivity, σe, of 1.2 S/m while the medium inside the cell (and nucleus) has a conductivity, σi, of 0.3 S/m. The local charge transport and charge storage models (Fig. 1b) are interconnected at the regularly spaced nodes of a Cartesian lattice, with submodels that represent the 5 nm membrane and two contacting regions of electrolyte (Fig. 1b) [9, 25].
Resting potential model
Following Läuger [39] we use a simplified, single resting potential source model (Fig. 1b) comprised of an active voltage source, Vip, and source series resistance, Rip, to represent approximately the effect of ion pumps and channels and the Goldmann equation in each membrane [25]. Vip is an ideal voltage source, with zero internal resistance. The (passive) membrane resistance is therefore the total of the individual local membrane resistances, R ip, values in the plasma, nuclear or tight junction membrane. Here the fixed quantities Vip and Rip, together with conductance of the local number of electrically created pores determine the membrane resting potential, ψm,rest, in the absence of applied fields. The different membranes contain the equilibrium number of pores in the absence of an applied field. Pore lifetimes reported in literature vary over many orders of time (from milliseconds to minutes); we use an illustrative value, τp = μ ms [40].
Transport Lattice
Local membrane models and electrolyte models are distributed spatially to small local membrane areas and connected to their nearest neighbors to form a transport lattice [9, 25]. There is no transport in the z direction within this 2-D model. The lattice spacing, as well as the depth of the system model, is ℓ = 1.0 μm. Each node is connected to its four Cartesian neighbors by local models based on local structures, i.e. electrolyte, PM, NM, or TJ. All membranes are dm = 5 nm thick and all electrically created membrane pores have a minimum-size radius of rp = 0.8 nm. Voltages applied along the top and bottom boundary of the system model provide the applied uniform field. The multicellular cell system model has ~2 × 10⁴ interconnected local models for charge transport and storage within electrolytes and membranes. These include 5830 local models that describe transport across membranes (PM: 4148 local models; NM: 1561; TJ: 121). The NM envelope local model accounts for perpendicular charge transport across two identical membranes but not laterally within the intermembrane space.
Asymptotic EP model
The transient aqueous pore hypothesis of EP is based on continuum models of membrane pores, electrostatic energy differences and thermal fluctuations, usually in the form of the Smoluchowski equation (SE) [23, 24, 27–33]. The SE describes the evolution of membrane pore density in terms of the number of pores and pore radius [23]. The asymptotic model is an approximation to the SE-based models. The basic assumption of the asymptotic model [26, 41–43] is that the source term dominates over the diffusion and drift terms of the SE that governs the pore population. Accordingly, basic asymptotic model equations describe the time evolution of pore number (Np) as a function of transmembrane voltage. The expressions for the energy barrier for pore formation, membrane conductance and pore creation rate were re-examined recently [24]. Implementation of the asymptotic model using circuit elements is described in detail elsewhere [25].
Model solutions and analysis of results
Our approach is equivalent to treating the system model as a very large electrical circuit with many interacting linear and nonlinear components [9, 21, 25, 34–38, 44]. The circuit is solved using Berkeley SPICE 3f5. SPICE generates solutions which are processed and displayed in Matlab as equipotentials and distributions of electroporated regions. Local membrane regions with ten or more pores (electroporated regions) are shown in white (Figs. 2 and 4).
Figure 2. Response for the conventional EP pulses with different field strengths.
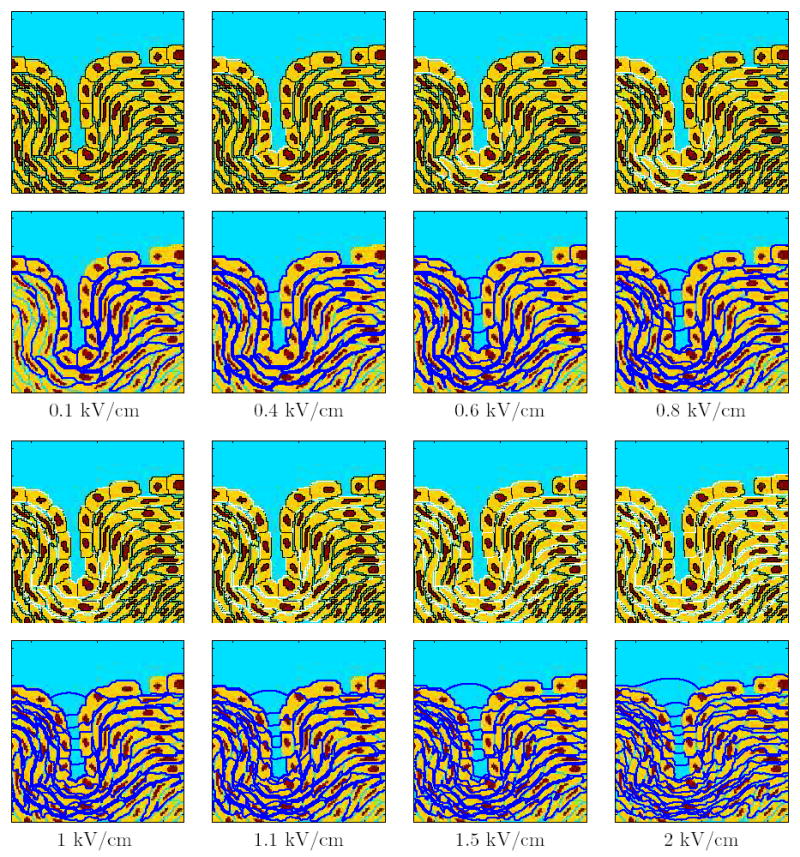
The response of the multicellular model is shown by a sequence of panel pairs for varying conventional EP pulses. The top panels show the sites of EP (Np >10) in white. The bottom panels show the equipotential lines in dark blue. The field strength of the applied pulse (1 μs rise and fall times and 100 μs duration) are shown for each set of panels.
Figure 4. Response for the supra-EP pulses with different field strengths.
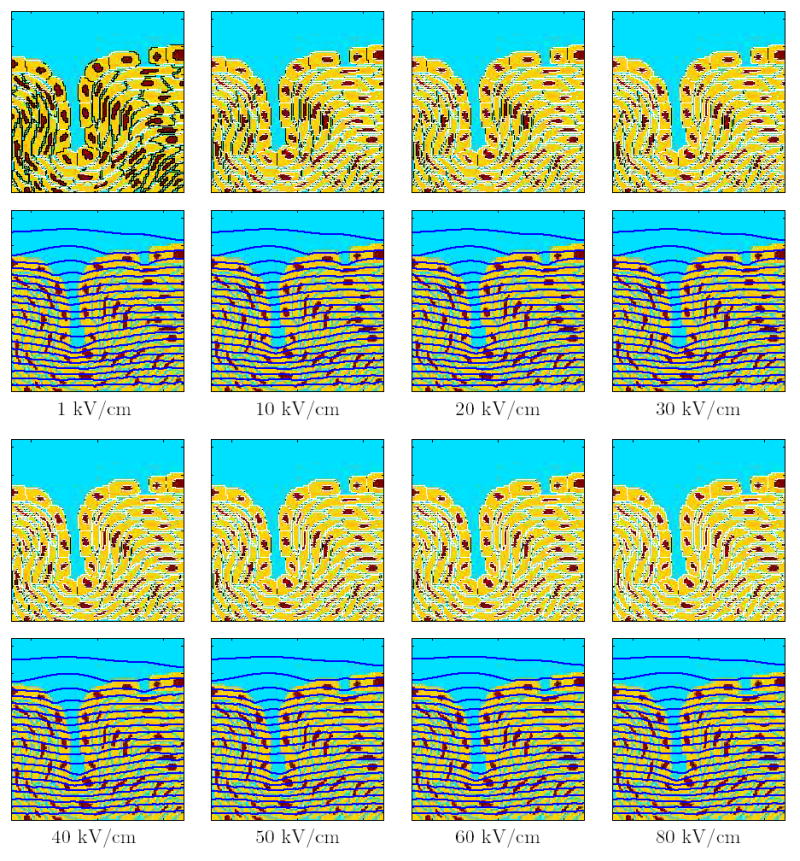
The response of the multicellular model is displayed as pairs of panels for single supra-EP pulses of varying field strengths. The top panels show the sites of EP (Np >10) in white. The bottom panels show the equipotential lines in blue. The field strength of the applied pulse (300 ns duration experimental pulse [2]). are shown for each set of panels.
Results and Discussion
We use a transport lattice model in which a previously described didactic multicellular model [9] is assigned a representation of the asymptotic EP model at each local membrane area (1 μm2). The conventional EP pulse used here is 100 μs long with a rise and fall time of 1 μs, which approximates pulses widely used in ECT [8]. The supra-EP pulse is a more complex waveform of about 300 ns duration employed in a recent experimental investigation [2]. The pulses were applied between the top and bottom boundaries of the system model (the top and bottom interconnected nodes represent ideal electrodes that provides the electric field [9]). The results are presented as equipotentials, distribution of electroporated sites, and transmembrane voltage and pore density at five different sites in the geometry identified in Fig. 1a. The five sites are located in distinct areas of the system geometry: the top of the outer layer, the bottom of the invagination, the gap in the tight junction layer, and underlying cell layers.
Conventional EP pulse response
Figure 2 shows the response of the multicellular system to the single 100 μs pulse for varying field strengths, shown as a pair of panels for each field strength. The top panel shows sites of EP with Np > 10 (white regions). The bottom panel shows the corresponding equipotential distribution (dark blue).
At a field strength of 0.1 kV/cm none of the membranes is electroporated. The field is concentrated across the membranes of the cell layers with tight junctions and layers of cells immediately underneath it. At 0.4 kV/cm, the PM of certain cells, predominantly in the tight junction layer away from the gap, are electroporated. The equipotential lines are still concentrated around the cells, but the field lines now appear in the invagination because of the high conductance of the electroporated membranes in the tight junction layer. However, none of the tight junctions are electroporated at this field strength. At higher field strengths, such as 0.6 kV/cm and 0.8 kV/cm, EP of PM progresses to more sites with the field further increasing relatively within the invagination. At 0.8 kV/cm, the membranes directly below the gap and the cells below the bottom of the invagination are electroporated. Nevertheless, tight junction membranes are still unelectroporated.
As the field strength is increased further, EP extends to more membranes in the multicellular model. Although the field penetrates into the invagination, the field is still concentrated around the cells in the layers underneath the tight junction layer. When the field is raised to 1.5 kV/cm and then even higher to 2 kV/cm, some of the tight junction membranes are electroporated. The concentration of the equipotentials in the invagination continues to grow as the electric field is increased. But, even at field strengths as high as 2 kV/cm, almost all the membranes of the nuclear envelope are unelectroporated. This is one distinguishing feature of conventional EP at widely used field strengths.
Figure 3 shows the temporal evolution of EP for the 100 μs EP pulse at a strength of 1.1 kV/cm. Such pulses are used in in vivo EP protocols, for delivering bleomycin into cells (ECT) [8,13]. The successive panel pairs show the distribution of EP sites and equipotentials at different time points. At 1 μs, when the pulse has reached its maximum value, a few PM sites at the bottom of the invagination are electroporated and the field extends into the invagination. At 1.2 μs, a few more PM sites are electroporated. At 1.7 μs, the PM of the cell directly below the gap and the cells at the bottom of the invagination and the layers below it are also electroporated. As time progresses to 6 μs and to 51 μs and beyond, more and more PM sites are electroporated. Significantly, however, the equipotential distribution is largely unchanged. Most of the field is concentrated around the cells below the tight junction layer. The response of the system beyond 51 μs is essentially unchanged. Also, even at the end of the pulse (not shown), none of the nuclear membrane and tight junction membranes are electroporated.
Figure 3. Temporal response for the conventional EP pulse of strength 1.1 kV/cm.
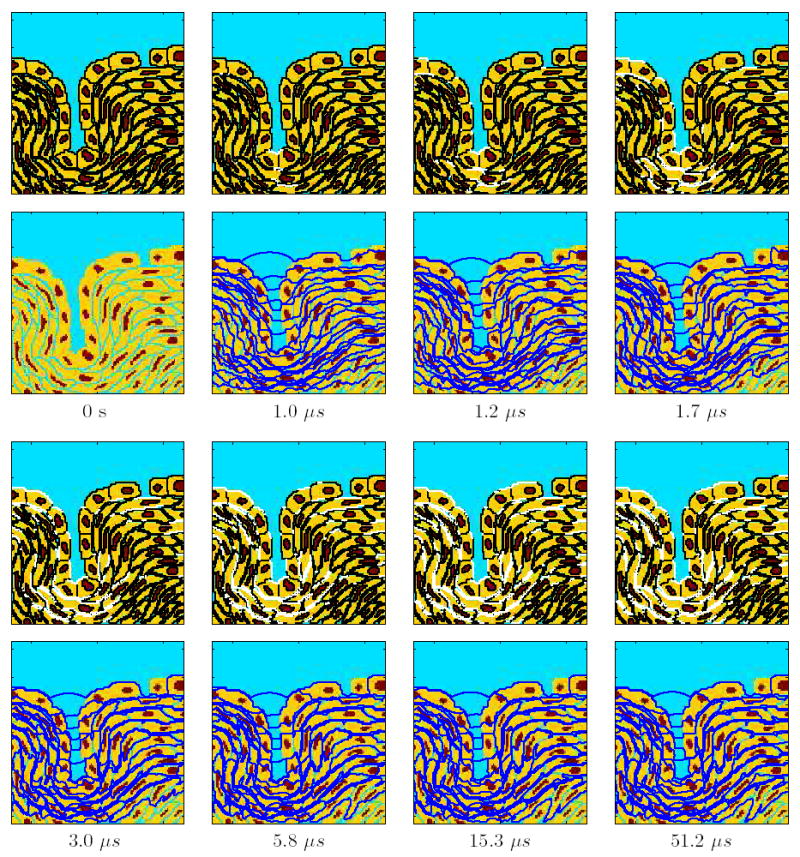
Temporal evolution of the response of the multicellular system model to this EP pulse (Fig. 1c). The top panels show the sites of EP (Np >10) in white, the bottom panels show the equipotential lines in dark blue, and the times are indicated at the bottom of each pair of panels.
Supra-EP pulse response
Figure 4 shows the response of the multicellular systems to the 300 ns long supra-EP pulse for field strengths ranging from 1 to 80 kV/cm. At 1 kV/cm, EP is confined to the PM and tight junction membranes parallel to the electrodes. The equipotentials are nearly parallel, indicating extensive EP of the multicellular model. At higher field strengths (10–80 kV/cm), almost all segments of PM, NM and TJ are electroporated. This results in an “electrical transparency” of the multicellular model. The equipotential contours are largely parallel, indicating that the field is nearly uniform.
Figure 5 shows the temporal response of the multicellular model upon the application of the 300 ns experimental pulse at a strength of 20 kV/cm. The response shows that earliest appearance of EP sites occurs at 60 ns. EP starts at the bottom of the invagination and extends to the layer of cells below (65 ns). By 68 ns, the PM below the gap in the tight junction layer is also electroporated. EP continues to permeabilize more membrane regions (70 ns). But, none of the nuclear membranes and tight junction membranes are yet electroporated. At 72 ns, nearly all the PM regions are electroporated, and EP now extends to some nuclear membranes and tight junction membranes. Finally, at 96 ns, all the membranes in the model are electroporated. Such pervasive EP does not occur for the conventional EP (Fig. 3).
Figure 5. Temporal response for the supra-EP pulse at a strength of 20 kV/cm (Fig. 1c).
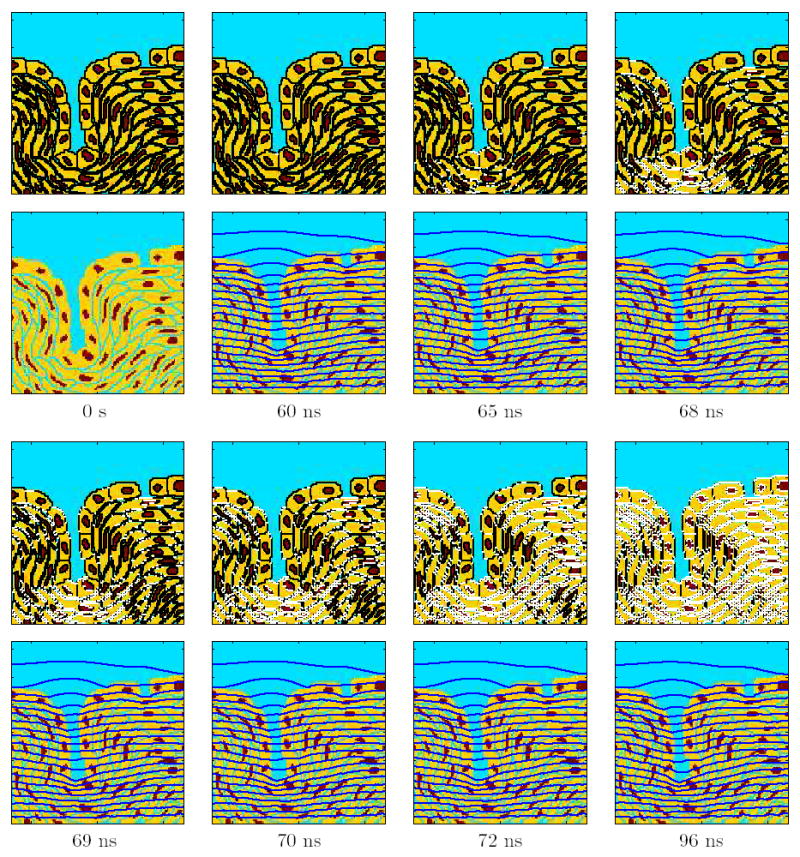
Temporal evolution of the response of the multicellular system model to the pulse. The top panels show the sites of EP (Np >10) in white, the bottom panels show the equipotential lines in dark blue, and the times are indicated at the bottom of each pair of panels.
Spatial heterogeneity
Figure 6 (top and middle rows) demonstrates one of the characteristic differences in response of the multicellular system to the conventional EP pulse and the supra-EP pulse. The results shown are the transmembrane voltage profiles (Fig. 6, top row) and pore densities (Fig. 6, middle row) at five sites (A–E) in the model (Fig. 1a) for a 1.1 kV/cm, 100 μs pulse and a 20 kV/cm, 300 ns pulse.
Figure 6. Transmembrane voltage and pore density for conventional and supra-EP pulses.
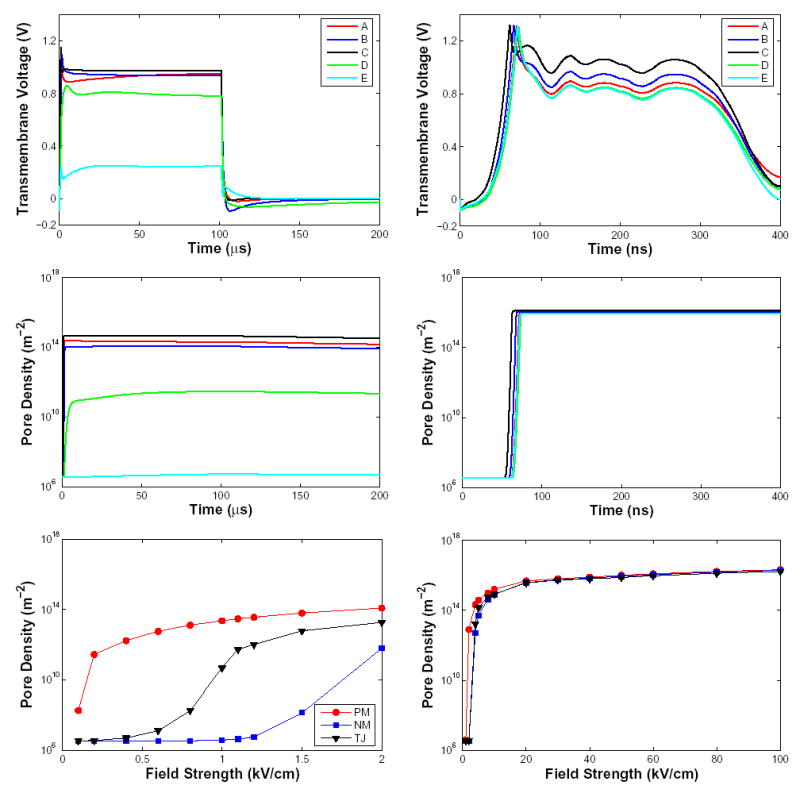
Response of the multicellular model for a conventional EP pulse (1.1 kV/cm, 100 μs) is shown on left and the response for a supra-EP pulse (20 kV/cm, 300 ns) is shown on right. Top: Transmembrane voltage as a function of time is shown for five different sites in the multicellular model (Fig. 1). The transmembrane voltage response for the supra-EP pulse follows the shape of the applied field pulse (Fig. 1c). Middle: Pore density as a function of time for conventional and supra-EP pulses. Bottom: Pore density as a function of field strength for conventional and supra-EP pulses. The three different curves correspond to spatially-averaged pore densities at the end of the pulse for the plasma membrane (red), nuclear membrane (black) and tight junction membrane (blue).
As shown in detail for these sites the response of the system to the conventional EP pulse is spatially heterogeneous. EP starts at the bottom of the invagination (site C), followed by the gap in the tight junction layer (site B) and proceeds to regions in the tight junction layer away from the gap (site A). At all these three sites, the transmembrane voltage transiently increases to 1.1 V but then abruptly drops to a plateau at ~1 V (Fig. 6, top left). The pore density at these locations plateaus rapidly to over 1014 m−2 (Fig. 6, middle left). In contrast, membranes of cells located below the tight junction layer and away from the invagination (sites D and E) are partially shielded by the electroporated regions. Hence, the PM of these cells are not electroporated to the extent of other cells. The transmembrane voltage reaches only 0.8 V (site D) and 0.2 V (site E) by the end of the pulse. The pore density at site D plateaus at values three orders of magnitude smaller than sites A–C. The PM at site E is largely unaffected by the applied field as evidenced by the pore density remaining largely unchanged during the pulse. As seen in Fig. 2, sites A, B and C are electroporated while sites D and E remain unelectroporated at the end of the 1.1 kV/cm, 100 μs pulse.
In contrast, the response of the multicellular system to the 20 kV/cm, 300 ns pulse is much more spatially uniform. The transmembrane voltage at all five membrane sites in the model exceeds 1.2 V at the onset of the pulse and then (t) approximately follows the applied pulse shape but with somewhat different amplitudes in the range 0.8 to 1 V (Fig. 6, top right). The model response is consistent with recent experimental observations on isolated cells [45]. The transmembrane voltage response follows approximately the waveform of the applied supra-EP pulse (Fig. 1c). However, the spatial uniformity in response to the short, high voltage pulse is more striking in the pore density plot (Fig. 6, middle right). All five sites have nearly the same pore density with a plateau level almost two orders of magnitude higher than that for conventional EP. This signifies extensive EP of the membranes at all sites in the model [21]. As seen in Fig. 4, all five locations in the model are electroporated at the end of the 20 kV/cm, 300 ns pulse.
Field strength-dependent EP of the PM, TJ and NM
We have previously demonstrated that in an isolated cell the field dependence of the EP of PM and intracellular organelles are strikingly different for conventional EP and supra-EP [21]. Here we show that this is also expected for cells in a closely spaced multicellular environment. The average pore density at the end of the pulse is shown for PM, NM and TJ as a function of field strength (Fig. 6, bottom row) for the 100 μs and 300 ns pulses.
The pore density plot for a conventional EP pulse (100 μs) is shown in Fig. 6 (bottom left). At low field strengths below < 0.5 kV/cm, only PM sites are electroporated. Participation of TJ membranes in the EP dynamics is seen only beyond 1 kV/cm. The nuclear membranes reach EP threshold above 1.5 kV/cm. However, even at 2 kV/cm only a small fraction of the nuclear membrane sites is electroporated. EP by a 1.1 kV/cm, 100 μs pulse is largely confined to the PM with the exception of a few tight junction membrane regions. The membranes of all nuclei remain unelectroporated at the end of the pulse. The average PM pore density increases by over seven orders of magnitude at the end of a 2 kV/cm pulse from the basal density of 3 × 10⁶ m−2.
There is a significant contrast with the pore density plot for the supra-EP pulse (300 ns) shown in Fig. 6 (bottom right). The PM, TJ and NM all have the same average pore density values at field strengths above 20 kV/cm. But even at lower field strengths the difference in pore density values is small. From this it is clear that these extremely short pulses gain access to the interior of the cells following rapid and extensive EP of the PM. The average pore density values at high field strengths of a supra-EP pulse is two orders of magnitude higher than in conventional EP.
Figure 7 shows histograms of average PM pore densities at the end of the conventional (1.1 kV/cm, 100 μs) and the supra-EP (20 kV/cm, 300 ns) pulse. More specifically, the pore densities are averaged over the entire PM of each cell. The results show the percentage of 58 cells that have the average pore density within the indicated range. Two striking differences are seen. In the case of conventional EP there is a significant variability in the extent of EP among the different cells in the multicellular model. In contrast, the supra-EP pulse causes almost uniform, maximal PM EP with a pore density of ~ 1016 m−2 in all cells, corresponding to an aqueous fractional area of 3.4%. This corresponds to 104 pores in a 1 μm2 local area of the PM with an average pore-to-pore distance of 10 nm. A conventional EP pulse leads to a maximum average pore density of ~1014 m−2, two orders magnitude smaller than supra-EP. This corresponds to an aqueous fractional area of 0.02%. Less than 5% of the cells have the highest average pore density. Most of the cells (nearly 70%) have average pore densities in the range of 1013 m−2. This suggests that a significant spatial variability is expected for the extent of EP in the PM of each cell for conventional EP.
Figure 7. Histograms of pore densities for conventional and supra-EP.

The fraction of cells with pore densities at the end of a 1.1 kV/cm, 100 μs conventional EP pulse (left) and an experimentally used 20 kV/cm, 300 ns supra-EP pulse (right) are shown as histograms. The pore density shown is averaged over the PM of each of the 58 cells in the multicellular model. Conventional EP has greater variability and overall fewer pores than the supra-EP exposure. In contrast, all the cells are maximally electroporated in supra-EP.
These features are of significance in electrochemotherapy protocols that use conventional EP pulses to deliver bleomycin into cells [4, 5]. Such pulses may cause spatially variable levels of EP within a tumor, leading to the sparing of a fraction of cells in the tumor. However, in many in vivo EP applications, many pairs of electrodes located at distinct points in the tumor are used. This arrangement may lead to a more uniform treatment of the tissue. But, even in the case of a multielectrode array EP the field still has heterogeneity and a uniform treatment of the tissue is not ensured [2]. The coverage of the tumor by the electroporating field depends on the spatial configuration of the electrode array.
Conventional EP pulses are regarded as an intervention for altering the plasma membrane extensively. Recently however, Nuccitelli and co-workers reported that nuclei of cells in melanoma tumors treated with 100 supra-EP pulses (300 ns, 40 kV/cm, 0.5 s−1 repeat time pulse repetition rate) rapidly became pyknotic [2]. The tumor cell nuclei shrank by 54% a few minutes after pulsing started, shrinking further to 68% in 3 h. Our results support a significant difference between the extent of conventional and supra-EP fields on intracellular organelles such as the nuclei. Figures 2 and 4 show the effect of single 100 μs conventional EP pulses and single 300 ns supra-EP pulses on the nuclei. Even a conventional pulse of 2 kV/cm amplitude does not electroporate the nuclei. In contrast, 300 ns field pulses as low as 10 kV/cm can cause significant EP of the nuclear membrane. In the case of supra-EP pulses, the PM is extensively electroporated as early as 70 ns into the 300 ns pulse, leading to several orders of magnitude increase in membrane conductance. This enables the field to penetrate the cell and reach the intracellular organelles. Because the pulse lasts an additional 200 ns, the strong field electroporates the intracellular organelles as extensively as the PM [21]. This may lead to significant structural deformation of these organelles. These deformations may include the pyknotic change of the nuclei and elongation of the nuclei as reported recently by Nuccitelli and co-workers [2]. They also showed that 100 supra-EP pulses (40 kV/cm, 300 ns, 0.5 s−1 repetition rate) cause only a 3° C temperature increase. Therefore, the primary effects of such pulses on tissue are directly related to the electrical behavior of the membranes, which is a pervasive EP of both PM and NM of each exposed cell.
An alternative mechanistic hypothesis proposed by others for apoptosis induction and tumor inhibition by very large, ultra short pulses is that the field penetrates the cells because the pulse characteristic times are shorter than charge redistribution (displacement currents) [1, 2]. This implies that apoptosis is induced by breaching subcellular organelle membranes while sparing the PM [46]. If the PM were spared, it would mean that the PM transmembrane voltage does not reach critical voltage for EP within the pulse duration. However, our previous and present models demonstrate that the PM is maximally electroporated [21]. These predictions are consistent with the maximum ψm of about 1.6 V observed in isolated cells for closely related (60 kV, 60 ns) pulses [45]. The short duration of the field precludes pores from expanding sufficiently to allow the entry of membrane integrity markers into the cytoplasm [24]. However, for most of the 300 ns pulse used here fields penetrate into the cell because of the pores. These pores can persist for times much longer than the pulse and are likely to contribute significantly to cell death.
Acknowledgments
We thank P. T. Vernier, K. C. Smith, K. H. Schoenbach, R. Nuccitelli, U. Pliquett, J. Kolb, A. T. Esser and S. J. Beebe for stimulating and critical discussions, and K. G. Weaver for support of computer resources. Supported by RO1-GM63857 and an AFOSR/DOD MURI grant on Subcellular Responses to Narrowband and Wideband Radio Frequency Radiation, administered through Old Dominion University.
References
- 1.Beebe SJ, Fox PM, Rec LJ, Somers K, Stark RH, Schoenbach KH. Nanosecond pulsed electric field (nsPEF) effects on cells and tissues: apoptosis induction and tumor growth inhibition. IEEE Trans Plasma Sci. 2002;30:286–292. [Google Scholar]
- 2.Nuccitelli R, Pliquett U, Chen X, Ford W, Swanson RJ, Beebe SJ, Kolb JF, Schoenbach KH. Nanosecond pulsed electric fields cause melanomas to self-destruct. Biochem Biophys Res Comm. 2006;343:351–360. doi: 10.1016/j.bbrc.2006.02.181. [DOI] [PMC free article] [PubMed] [Google Scholar]
- 3.Powell KT, Morgenthaler AW, Weaver JC. Tissue electroporation: Observation of reversible electrical breakdown in viable frog skin. Biophys J. 1989;56:1163–1171. doi: 10.1016/S0006-3495(89)82763-8. [DOI] [PMC free article] [PubMed] [Google Scholar]
- 4.Okino M, Mohri H. Effects of a high-voltage electrical impulse and an anticancer drug on in vivo growing tumors. Jpn J Cancer Res. 1987;78:1319–1321. [PubMed] [Google Scholar]
- 5.Mir LM, Orlowski S, Jr, Belehradek J, Paoletti C. In Vivo potentiation of the bleomycin cytotoxicity by local electric pulses. Eur J Cancer. 1991;27:68–72. doi: 10.1016/0277-5379(91)90064-k. [DOI] [PubMed] [Google Scholar]
- 6.Prausnitz MR, Bose VG, Langer R, Weaver JC. Electroporation of mammalian skin: A mechanism to enhance transdermal drug delivery. Proc Nat Acad Sci. 1993;90:10504–10508. doi: 10.1073/pnas.90.22.10504. [DOI] [PMC free article] [PubMed] [Google Scholar]
- 7.Heller R, Jaroszeski M, Atkin A, Moradpour D, Gilbert R, Wands J, Nicolau C. In vivo gene electroinjection and expression in rat liver. FEBS Lett. 1996;389:225–228. doi: 10.1016/0014-5793(96)00590-x. [DOI] [PubMed] [Google Scholar]
- 8.Mir LM. Therapeutic perspectives of in vivo cell electropermeabilization. Bioelectrochemistry. 2001;53:1–10. doi: 10.1016/s0302-4598(00)00112-4. [DOI] [PubMed] [Google Scholar]
- 9.Gowrishankar TR, Weaver JC. An approach to electrical modeling of single and multiple cells. Proc Nat Acad Sci. 2003;100:3203–3208. doi: 10.1073/pnas.0636434100. [DOI] [PMC free article] [PubMed] [Google Scholar]
- 10.Neumann E, Sowers AE, Jordan CA, editors. Electroporation and Electrofusion in Cell Biology. Plenum Press; New York: 1989. [Google Scholar]
- 11.Chang DC, Chassy BM, Saunders JA, Sowers AE, editors. Guide to Electroporation and Electrofusion. Academic Press; New York: 1992. [Google Scholar]
- 12.Weaver JC. Electroporation: A general phenomenon for manipulating cells and tissue. J Cellular Biochem. 1993;51:426–435. doi: 10.1002/jcb.2400510407. [DOI] [PubMed] [Google Scholar]
- 13.Jaroszeski MJ, Gilbert R, Heller R, editors. Electrically Mediated Delivery of Molecules to Cells: Electrochemotherapy, Electrogenetherapy and Transdermal Delivery by Electroporation. Humana Press; Totowa: 2000. [Google Scholar]
- 14.Olofsson J, Nolkrantz K, Ryttsén F, Lambie BA, Weber SG, Owar O. Single-cell electroporation. Curr Opin Biotech. 2003;14:29–34. doi: 10.1016/s0958-1669(02)00003-4. [DOI] [PubMed] [Google Scholar]
- 15.Weaver JC. Electroporation of biological membranes from multicellular to nano scales. IEEE Trans Dielect Elect Ins. 2003;10:754–768. [Google Scholar]
- 16.Deng J, Schoenbach KH, Buescher ES, Hair PS, Fox PM, Bebe SJ. The effects of intense submicrosecond electrical pulses on cells. Biophysical J. 2003;84:2709–2714. doi: 10.1016/s0006-3495(03)75076-0. [DOI] [PMC free article] [PubMed] [Google Scholar]
- 17.Buescher ES, Schoenbach KH. The effects of submicrosecond, high intensity pulsed electric fields on living cells - intracellular electromanipulation. IEEE Trans Dielect Elect Ins. 2003;10:788–794. [Google Scholar]
- 18.Beebe SJ, Fox PM, Rec LJ, Willis LK, Schoenbach KH. Nanosecond, high intensity pulsed electric fields induce apoptosis in human cells. FASEB J. 2003;17:1493–1495. doi: 10.1096/fj.02-0859fje. [DOI] [PubMed] [Google Scholar]
- 19.Vernier PT, Sun Y, Marcu L, Salemi S, Craft CM, Gundersen MA. Calcium bursts induced by nanosecond electric pulses. Biochem Biophys Res Commun. 2003;310:286– 295. doi: 10.1016/j.bbrc.2003.08.140. [DOI] [PubMed] [Google Scholar]
- 20.Vernier PT, Sun Y, Marcu L, Craft CM, Gundersen MA. Nanoelectropulse-induced phosphatidylserine translocation. Biophysical J. 2004;86:4040–4048. doi: 10.1529/biophysj.103.037945. [DOI] [PMC free article] [PubMed] [Google Scholar]
- 21.Gowrishankar TR, Esser AT, Vasilkoski Z, Smith KC, Weaver JC. Microdosimetry for conventional and supra-electroporation in cells with organelles. Biochem Biophys Res Commun. 2006;341:1266–1276. doi: 10.1016/j.bbrc.2006.01.094. [DOI] [PubMed] [Google Scholar]
- 22.Weaver JC, Chizmadzhev YA. Theory of electroporation: A review. Bioelectrochem Bioenerget. 1996;41:135–160. [Google Scholar]
- 23.Freeman SA, Wang MA, Weaver JC. Theory of electroporation for a planar bilayer membrane: Predictions of the fractional aqueous area, change in capacitance and porepore separation. Biophys J. 1994;67:42–56. doi: 10.1016/S0006-3495(94)80453-9. [DOI] [PMC free article] [PubMed] [Google Scholar]
- 24.Vasilkoski Z, Esser AT, Gowrishankar TR, Stewart DA, Weaver JC. Membrane electroporation: The absolute rate equation and nanosecond timescale pore creation. Phys Rev E. doi: 10.1103/PhysRevE.74.021904. (in press) [DOI] [PubMed] [Google Scholar]
- 25.Stewart DA, Gowrishankar TR, Weaver JC. Transport lattice approach to describing cell electroporation: use of a local asymptotic model. IEEE Transactions on Plasma Science. 2004;32:1696–1708. [Google Scholar]
- 26.Neu JC, Krassowska W. Asymptotic model of electroporation. Phys Rev E. 1999;59:3471– 3482. [Google Scholar]
- 27.Pastushenko VF, Yu A Chizmadzhev, Arakelyan VB. Electric breakdown of bi-layer membranes: II. Calculation of the membrane lifetime in the steady-state diffusion approximation. Bioelectrochem Bioenerget. 1979;6:53–62. [Google Scholar]
- 28.Arakelyan VB, Chizmadzhev YA, Pastushenko VF. Electric breakdown of bilayer membranes: V. consideration of the kinetic stage in the case of the membrane containing an arbitrary number of defects. Bioelectrochem Bioenerget. 1979;6:81–87. [Google Scholar]
- 29.Pastushenko VF, Arakelyan VB, Chizmadzhev YA. Electric breakdown of bilayer membranes: VI. A stochastic theory taking into account the processes of defect formation and death: Membrane lifetime distribution function. Bioelectrochem Bioenerget. 1979;6:89–95. [Google Scholar]
- 30.Pastushenko VF, Arakelyan VB, Yu A Chizmadzhev. Electric breakdown of bilayer membranes: VII. A stochastic theory taking into account the processes of defect formation and death: Statistical properties. Bioelectrochem Bioenerget. 1979;6:97–104. [Google Scholar]
- 31.Powell KT, Weaver JC. Transient aqueous pores in bilayer membranes: A statistical theory. Bioelectrochem Bioelectroenerg. 1986;15:211–227. [Google Scholar]
- 32.Barnett A, Weaver JC. Electroporation: A unified, quantitative theory of reversible electrical breakdown and rupture. Bioelectrochem and Bioenerg. 1991;25:163–182. [Google Scholar]
- 33.Joshi RP, Schoenbach KH. Electroporation dynamics in biological cells subjected to ultrafast electrical pulses: a numerical simulation study. Phys Rev E. 2000;62:1025–1033. doi: 10.1103/physreve.62.1025. [DOI] [PubMed] [Google Scholar]
- 34.Gowrishankar TR, Stewart C, Weaver JC. Electroporation of a multicellular system: asymptotoic model analysis. In Proceedings of the 26th Annual International Conference of the IEEE EMBS; San Francisco. 2004. [DOI] [PubMed] [Google Scholar]
- 35.Gowrishankar TR, Stewart DA, Weaver JC. Model of a confined spherical cell in uniform and heterogeneous applied electric fields. Bioelectrochemistry. 2006;68:181–190. doi: 10.1016/j.bioelechem.2005.07.002. [DOI] [PubMed] [Google Scholar]
- 36.Stewart DA, Gowrishankar TR, Smith KC, Weaver JC. Cylindrical cell membranes in uniform applied electric fields: validation of a transport lattice method. IEEE Trans Biomed Eng. 2005;52:1643–1653. doi: 10.1109/TBME.2005.856030. [DOI] [PubMed] [Google Scholar]
- 37.Gowrishankar TR, Stewart Donald A, Martin Gregory T, Weaver James C. Transport lattice models of heat transport in skin with spatially heterogeneous, temperature-dependent perfusion. Biomedical Eng Online. 2004;3:42. doi: 10.1186/1475-925X-3-42. [DOI] [PMC free article] [PubMed] [Google Scholar]
- 38.Smith KC, Gowrishankar TR, Esser AT, Stewart DA, Weaver JC. Spatially distributed, dynamic transmembrane voltages of organelle and cell membranes due to 10 ns pulses: predictions of meshed and unmeshed transport network models. IEEE Transactions on Plasma Science. 2006 (in press) [Google Scholar]
- 39.Läuger P. Electrogenic Ion Pumps. Sinauer Associates; Sunderland: 1991. [Google Scholar]
- 40.Melikov KC, Frolov VA, Shcherbakov A, Samsonov AV, Chizmadzhev YA, Chernomordik LV. Voltage–induced nonconductive pre–pores and metastable pores in unmodified planar bilayer. Biophys J. 2001;80:1829–1836. doi: 10.1016/S0006-3495(01)76153-X. [DOI] [PMC free article] [PubMed] [Google Scholar]
- 41.DeBruin KA, Krassowska W. Electroporation and shock–induced transmembrane potential in a cardiac fiber during defibrillation strength shocks. Ann Biomed Eng. 1998;26:584–596. doi: 10.1114/1.101. [DOI] [PubMed] [Google Scholar]
- 42.DeBruin KA, Krassowska W. Modeling electroporation in a single cell: I. Effects of field strength and rest potential. Biophys J. 1999;77:1213–1224. doi: 10.1016/S0006-3495(99)76973-0. [DOI] [PMC free article] [PubMed] [Google Scholar]
- 43.Smith KC, Neu JC, Krassowska W. Model of creation and evolution of stable electropores for DNA delivery. Biophysical J. 2004;86:2813–2826. doi: 10.1016/S0006-3495(04)74334-9. [DOI] [PMC free article] [PubMed] [Google Scholar]
- 44.Stewart DA, Gowrishankar TR, Weaver JC. Three dimensional transport lattice model for describing action potentials in axons stimulated by external electrodes. Bioelectrochemistry. 2006 doi: 10.1016/j.bioelechem.2005.11.004. (Jan 26, Epub ahead of print) [DOI] [PubMed] [Google Scholar]
- 45.Frey W, White JA, Price RO, Blackmore PF, Joshi RP, Nuccitelli R, Beebe SJ, Schoenbach KH, Kolb JF. Plasma membrane voltage changes during nanosecond pulsed electric field exposures. Biophys J. 2006;90:3608–3615. doi: 10.1529/biophysj.105.072777. [DOI] [PMC free article] [PubMed] [Google Scholar]
- 46.Schoenbach KH, Beebe SJ, Buescher ES. Intracellular effect of ultrashort pulses. Bioelectromagnetics. 2001;22:440–448. doi: 10.1002/bem.71. [DOI] [PubMed] [Google Scholar]