Abstract
Nucleostemin (NS) encodes a nucleolar GTP-binding protein highly enriched in the stem cells and cancer cells. To determine its biological activity in vivo, we generated NS loss- and gain-of-function mouse models. The embryogenesis of homozygous NS-null (NS−/−) mice was aborted before the blastula stage. Although the growth and fertility of heterozygous NS-null (NS+/−) mice appeared normal, NS+/− mouse embryonic fibroblasts (MEFs) had fewer NS proteins, a lower population growth rate, and higher percentages of senescent cells from passage 5 (P5) to P7 than their wild-type littermates. Conversely, transgenic overexpression of NS could rescue the NS−/− embryo in a dose-dependent manner, increase the population growth rate, and reduce the senescent percentage of MEFs. Cell cycle analyses revealed increased pre-G1 percentages in the late-passage NS+/− MEF cultures compared to the wild-type cultures. We demonstrated that NS could interact with telomeric repeat-binding factor 1 (TRF1) and enhance the degradation but not the ubiquitination of the TRF1 protein, which negatively regulates telomere length and is essential for early embryogenesis. This work demonstrates the roles of NS in establishing early embryogenesis and delaying cellular senescence of MEFs and reveals a mechanism of a NS-regulated degradation of TRF1.
Stem cells are defined by their abilities to self-renew and to generate multiple cell types in the tissues where they reside. Expression profile studies indicate that the molecular characteristics of embryonic and somatic stem cells are likely to be governed by a combination of stem cell-enriched factors rather than by a single master program (4, 9). One of the stem cell-enriched genes is nucleostemin (NS), which encodes a novel nucleolar GTP-binding protein found at high levels in the neural stem cells, embryonic stem (ES) cells, c-kit+ bone marrow cells, adult testes, and tumor cell lines (24) as well as in the mesenchymal and stromal stem cells (1, 10) and several types of human cancers (16).
Perturbation of NS expression in vitro shows that it is required for maintaining the proliferation of neural stem cells and some human cancer cell lines by a mechanism not completely understood (16, 22, 24). The expression of NS does not correlate completely with cell division (24) or with the sites of nascent rRNAs and 28S RNA-containing ribosomes (20), suggesting that it is not simply a cell cycle or rRNA-processing protein. An indication of the NS activity is revealed by its ability to bind p53, a key factor involved in cell cycle progression and cellular senescence (24). The interaction between NS in the nucleolus and p53 in the nucleoplasm is made possible in the living cells by a GTP-regulated shuttling of NS between the nucleolar and nucleoplasmic compartments (23). While NS is essential for maintaining the proliferation of stem cells and cancer cells in vitro, its function in the developing embryos has not yet been examined. To determine the physiological roles of NS, we generated heterozygous NS-null (NS+/−) mice using the gene targeting approach and NS-overexpressing mice using the bacterial artificial chromosome (BAC) transgenic approach. Our data demonstrate the importance of NS in early embryogenesis and in the senescence of mouse embryonic fibroblasts (MEFs). They also point to an NS-mediated mechanism by which the protein stability of telomeric repeat-binding factor 1 (TRF1) is regulated.
MATERIALS AND METHODS
Gene-targeting vector construction, ES cell electroporation, and NS+/− mouse generation.
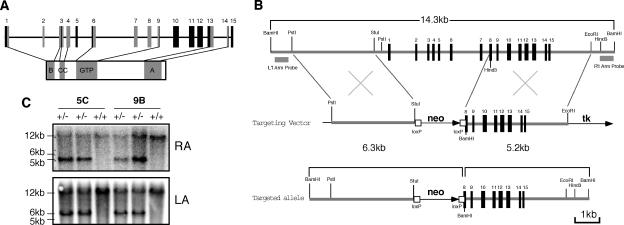
Four BAC clones containing the 129Sv/J genomic sequence of NS were identified from a screen using BAC mouse ES (Rel II) genomic filters (Incyte Genomics). Overlapping DNA fragments spanning a 14.3-kb genomic region were subcloned, which included the entire NS coding sequence, plus 5.1 kb and 2.6 kb of the 5′ and 3′ sequences (Fig. 1B). A targeting vector was constructed, which contained a neomycin resistance cassette driven by the phosphoglycerate kinase (pgk) promoter, and sandwiched between two LoxP sites and two flanking recombination arms of 3.5 kb (PstI-StuI) and 4.0kb (HindIII-EcoRI). The linearized targeting vector was electroporated into 129Sv/J ES cells, and 384 G418-resistant clones were screened for homologous recombination. Four correctly targeted ES clones were identified by BamHI-digested genomic Southern blots using external probes on both sides, two of which (5C and 9B) were microinjected into C57BL/6-derived blastocysts. Chimeras were bred to C57BL/6 females, and germ line transmission of the NS-null allele was confirmed by Southern blots using the 5′ and 3′ external probes in the F1 agouti offspring (Fig. 1C).
FIG. 1.
Generation of an NS-null allele and heterozygous NS-null (NS+/−) mice. (A) Schematic diagram of the NS genomic and protein structures. Boxes indicate its 15 exons. Coding exons for the basic (B), coiled-coil (CC), GTP-binding (GTP), and acidic (A) domains are shown in gray. (B) An NS-null allele was created by replacing the 640-bp proximal promoter and the first 7 1/2 exons with a neomycin selection cassette (neo). tk, thymidine kinase. (C) BamHI-digested genomic Southern blots of the heterozygous (+/−) and wild-type (+/+) F1 mice derived from the 5C and 9B chimeric founders showed a 5.2-kb or 6.3-kb fragment of the targeted allele when hybridized with the right-arm (RA) or left-arm (LA) probe. The 14.3-kb fragment represented the endogenous NS allele.
Isolation of C57BL/6 BAC clones, BAC recombineering, and generation of NS-BAC transgenic mice.
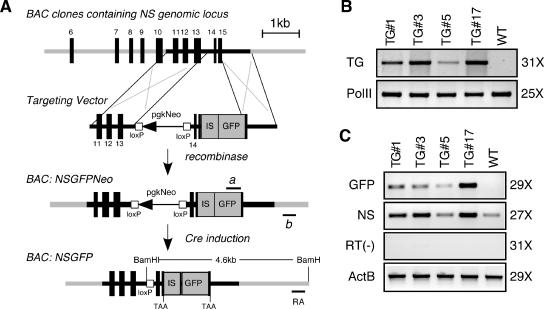
C57BL/6 BAC clones containing the genomic sequences of NS were identified by the Ensembl program (www.ensembl.org) and the UCSC Genome database (genome.ucsc.edu). RP23-102M6 BAC, which contains the longest 5′ and 3′ sequences, was obtained from BACPAC Resources (bacpac.chori.org). An internal ribosomal entry site (IRES)-green fluorescent protein (GFP) expression cassette was inserted into the BAC DNA using a BAC recombineering technique (see Fig. 4A) (13, 15). After recombination in the host cells (EL350), the drug selection cassette was excised. BAC DNAs for microinjection were prepared using Marlign high-purity columns and linearized by the PI-SceI enzyme that cuts specifically the pBACe3.6 vector. Digested DNAs were injected at a concentration of 2.5 μg/ml into fertilized eggs derived from FVB mice in the transgenic core of the Institute of Biosciences and Technology/Center for Environmental and Rural Health.
FIG. 4.
Creation of NS-overexpressing mice. (A) An NS gain-of-function mouse model was made by a BAC transgenic approach. An IRES-GFP cassette was engineered after the stop codon of NS. The targeting vector contained a LoxP-flanked pgk-neomycin cassette (pgkNeo), a partial 3′ sequence of NS before the stop codon, an IRES sequence, and a GFP reporter gene, sandwiched by two recombineering arms. The pgkNeo cassette was excised from the recombined BAC clone (BAC: NSGFPNeo), leaving a LoxP site in the nonconserved region of the 13th intron. All genomic sequences were preserved in the final transgene construct (BAC: NSGFP), including 150 kb upstream and 68 kb downstream of the NS locus. Lines a and b indicate primers used for genotype analyses. The transgenic allele will generate a 4.6-kb fragment in BamHI-digested Southern blots hybridized with the right-arm probe (RA). (B) Four transgenic lines with different levels of transgene dosage were detected by PCRs (TG). RNA polymerase II (PolII) PCRs were used as controls for the genomic DNA preparations. (C) The mRNA expression levels of the GFP and NS in the adult testis were measured by semiquantitative RT-PCRs. RT-minus [RT(−)] and β-actin (ActB) reactions were used as negative and positive controls. Amplification cycle numbers for panels B and C are indicated on the right.
Genotype analysis.
For PCR analysis of embryonic day 10.5 (E10.5), E12.5, E14.5, and 1 week postnatal (postnatal day 7 [PD7]) mice, primer pairs RT387/RT747 and RT387/RT800 were used to amplify the wild-type (370 bp) and NS-null (600 bp) alleles, respectively. For genotyping blastocysts, PCRs were conducted on the wild-type (or NS-null) allele with RT387/RT747 (or RT387/RT800) for 15 (or 25) cycles. Nested PCRs were set up using 0.5 μl of the first-round reaction mixtures as templates, an internal nested primer RT809, and the RT747 (for the wild-type allele, 293 bp) or RT800 (for the NS-null allele, 523 bp) primer. Primer pairs RT311/RT519 were used for PCR screening of the NS BAC transgenic lines. Primer sequences are listed as follows: RT311, 5′-GAA CTT CAA GAT CCG CCA CAA C-3′; RT387, 5′-ACT CAC AAT GTC AAG GAC CC TG-3′; RT519, 5′-TTC TAC AGC TTA GCA TGG CAT TG-3′; RT747, 5′-GTG ATG AGT ACA CAA ATG TTG ATG-3′; RT800, 5′-GCC TTC TTG ACG AGT TCT TCT G-3′; RT809, 5′-GAA TAT CCT TTC CAC AGG ACT G-3′.
Detection of mRNA expressions of NS and the GFP transgene by semiquantitative reverse transcription (RT)-PCR assays.
DNase I-treated total RNAs (1 μg) were reverse transcribed into first-stranded cDNAs using random hexamers and Moloney murine leukemia virus reverse transcriptase (Invitrogen). Target cDNAs were amplified with odd cycle numbers from 23 to 33, and PCRs within the linear range were chosen. β-Actin was used to control the quantity and quality of synthesized cDNAs. The primer sequences were shown as follows: enhanced GFP forward, 5′-CAA GCT GAC CCT GAA GTT CAT C-3′; enhanced GFP reverse, 5′-GTT GTG GCG GAT CTT GAA GTT C-3′; NS forward, 5′-CAA GCA TTG AGG AAC TAA GAC-3′; NS reverse, 5′-GCA ATA GTA ACC TAA TGA GGC-3′; β-actin forward, 5′-AGA GCA AGA GAG GTA TCC-3′; β-actin reverse, 5′-AGC TCA TAG CTC TTC TCC-3′.
MEF culture.
MEFs were prepared from E13.5 embryos following a standard NIH 3T3 cell culture protocol. After removal of the head and visceral portions, the fibroblastic tissues were minced with razor blades and digested in 0.25% trypsin-EDTA solution for 2 h at 4°C. Dispersed cells from each animal were plated in 100-mm plates in Dulbecco's modified Eagle's medium supplemented with 10% fetal bovine serum, glutamine, and antibiotics and grown until confluence. Serial cultures were carried out in which cells were trypsinized and replated (106 cells/100-mm dish) every 3 days. One-sixtieth of the total cells were counted using a Z1 series Coulter counter (Beckman Coulter). The population doubling level (PDL) was calculated using the formula ΔPDL = log(nf/n0)/log2, where n0 is the initial number of cells and nf is the final number of cells (3).
Senescence-associated β-galactosidase assay.
Cells were seeded at a density of 3 × 10⁴ cells per well on 24-well plates and, 3 days later, fixed with 2% formaldehyde-0.2% glutaraldehyde for 5 min at room temperature. After phosphate-buffered saline washes, cells were incubated in the staining solution (150 mM NaCl, 2 mM MgCl2, 5 mM potassium ferricyanide, 5 mM potassium ferrocyanide, 1 mg/ml 5-bromo-4-chloro-3-indolyl-β-d-thiogalactopyranoside [X-Gal] in citric acid-sodium phosphate solution, pH 6.0) at 37°C for 16 h.
Statistical analyses.
The differences in the PDLs between two MEF cultures were calculated by repeated measures analysis of variance (ANOVA). The time when the MEF population reached senescence was determined by estimating the time when ΔPDL reached zero based on the best-fit curve for each sample. The differences between two MEF cultures of different genetic backgrounds were analyzed by t tests. The percentages of senescent cells in every culture were measured by random sampling on four different positions under low-power views (10× objective). Each data point represents the average of the results from at least three MEF cultures derived from different embryos.
Cell cycle analyses.
Wild-type and NS+/− MEFs were cultured as described previously. At the time of the analysis, cells were washed, trypsinized, fixed in 72% ice-cold ethanol overnight, and stained with propidium iodide (50 μg/ml; Sigma) in the presence of 20 μg/ml DNase-free RNase A. Flow cytometry was conducted by the M.D. Anderson Cancer Center Flow Cytometry Core Facility, using a COULTER EPICS XL flow cytometer and the XL System II software. Cell cycle profiles were compiled from 2 × 10⁴ gated events and analyzed using the Multi Cycle AV software. Each data point represents the average of results from eight independent experiments performed in duplicate (n = 16). The differences in the percentages of the G1, S, G2/M, and pre-G1 cells between the wild-type and the NS+/− MEF cultures were analyzed by t tests.
Cell cultures and transfection.
HEK293 cells were maintained in Dulbecco's modified Eagle's medium supplemented with 5% fetal bovine serum (HyClone), penicillin (50 IU/ml), streptomycin (50 μg/ml), and glutamine (1%). Plasmid transfections were performed using a standard calcium phosphate method.
Coimmunoprecipitation.
For hemagglutinin (HA)-tagged NS and myc-tagged TRF1 coimmunoprecipitation, HEK293 cells were harvested 2 days after transfection in NTEN buffer (20 mM Tris, pH 8.0, 150 mM NaCl, 1 mM EDTA, 0.5% NP-40, 0.1 mM dithiothreitol, supplemented with 1 mM phenylmethylsulfonyl fluoride, leupeptin [1 μg/ml], aprotinin [0.5 μg/ml], pepstatin A [0.7 μg/ml], and E64 [1 μM]). Cell lysates were incubated with mouse anti-HA (HA.11; Covance) or anti-myc (9E10; Covance) antibodies for 1 h at 4°C, followed by incubation with protein G Sepharose beads (Pharmacia) for an additional 4 h at 4°C. For endogenous NS and TRF1 coimmunoprecipitation, protein complexes were precipitated from HEK293 cell lysates using anti-NS antiserum (Ab1164, third bleed) or preimmune antiserum and protein G Sepharose beads. Immunoprecipitates were washed extensively with radioimmunoprecipitation assay buffer (1× phosphate-buffered saline, 0.1% sodium dodecyl sulfate, 0.5% sodium deoxycholate, 1% NP-40, supplemented with 1 mM phenylmethylsulfonyl fluoride, leupeptin [1 μg/ml], aprotinin [0.5 μg/ml], pepstatin A [0.7 μg/ml], and E64 [1 μM]), fractionated by 10% sodium dodecyl sulfate-polyacrylamide gel electrophoresis, and transferred to Hybond-P membranes (Amersham). Specific signals were detected by Western blotting with indicated primary antibodies, including rabbit anti-myc (A-14; Covance), rabbit anti-HA (polyclonal HA.11), and mouse anti-TRF1 (TRF-78; Novus) antibodies.
Protein degradation and ubiquitination assays.
For protein degradation assays, cells were cotransfected with (i) myc-tagged TRF1- and HA-tagged NS-expressing plasmids or (ii) myc-tagged TRF1-expressing and vector plasmids. Cycloheximide (100 μg/ml) was added 36 h after transfection to block new protein synthesis. Cell lysates were collected in 1× sample buffer at the indicated time points and analyzed by immunoblotting with anti-myc (9E10), anti-HA (HA.11), and anti-α-tubulin antibodies. Signal intensities were measured from scanned images using the ImageJ 1.36b software (http://rsb.info.nih.gov/ij/). The results of four independent experiments were plotted such that protein levels at the 0-h time point were designated as 100%. For in vivo ubiquitination assays, His-tagged ubiquitin and myc-tagged TRF1 were coexpressed with or without NS in HEK293 cells, followed by MG-132 treatment (12.5 μM for 12 h) to inhibit proteasome function. Cell lysates were harvested in NTEN buffer. Ubiquitinated TRF1 was detected by the mouse anti-TRF1 (TRF-78) antibody as the high-molecular-weight species.
RESULTS
Generation of an NS-null allele.
The NS coding sequence is composed of 15 exons in the genome (Fig. 1A). The first three exons encode a basic domain that mediates its nucleolar targeting and p53 interaction (24). The GTP-binding domain, which regulates the partitioning of NS between the nucleolus and the nucleoplasm (23), is located from the sixth to the ninth exons. An NS-null allele was created by replacing a 640-bp promoter region and the first 7 1/2 coding exons with a neomycin selection cassette (Fig. 1B). Four ES clones were identified that exhibited the correct Southern pattern of a 14.3-kb endogenous band and a 6.3-kb (or 5.2-kb) targeted band when hybridized with the left (or right) arm probe. Two ES clones (5C and 9B) were injected into C57BL/6 blastocysts, and chimeric mice were bred with C57BL/6 mice to obtain germ line transmission of the NS-null allele (Fig. 1C).
Early embryonic lethality of NS−/− mice.
The first generation (F1) NS+/− mice were viable and displayed no overt signs of growth defect or infertility. By contrast, no viable NS−/− mice were detected at PD7 from intercrossing the NS+/− mice (Table 1). The wild-type-to-heterozygous-to-homozygous ratio followed a typical Mendelian ratio of 1:1.9:0 for homozygous lethality. To determine the affected developmental age, genotype analyses were carried out at E3.5 and E10.5. The wild-type-to-heterozygous-to-homozygous ratios were determined to be 1:1.7:0 (n = 101) and 1:2:0 (n = 83) for the E3.5 and E10.5 embryos, respectively. These results show that the NS function is essential for the blastocyst formation and are consistent with its high expression level in ES cells.
TABLE 1.
Genotypes of offspring from intercrosses of NS+/− mice
| Age | No. with genotype
|
No. resorbed | Total | Ratiob | ||
|---|---|---|---|---|---|---|
| +/+ | +/− | −/− | ||||
| 1 wk | 30 | 58 | 0 | NAa | 88 | 1:1.9:0 |
| E10.5 | 28 | 55 | 0 | 3 | 83 | 1:2.0:0 |
| E3.5 | 38 | 63 | 0 | NA | 101 | 1:1.7:0 |
NA, not available.
Ratio of +/+ to +/− to −/− mice.
Increased senescence of NS+/− MEFs.
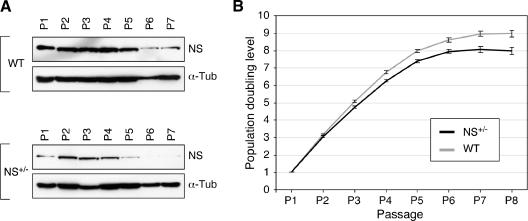
The apparent normal development and fertility of NS+/− mice suggests that these animals are capable of either up-regulating the expression of the remaining wild-type NS allele or functioning at a 50% reduced NS level under physiological conditions. In the latter case, a haploid genotype may be insufficient to support the NS activity under stress conditions. To examine these possibilities, MEFs were derived from the NS+/− embryos and their wild-type littermates and examined for their NS expression levels, doubling rates, and percentages of senescent cells over passages. Western analyses showed that the NS expression in both the wild-type and the NS+/− MEF cultures gradually decreased over passages (Fig. 2A). By comparison, wild-type MEFs expressed NS at a higher level than did the NS+/− MEFs of the same passages (Fig. 2A; also see Fig. S1A in the supplemental material), excluding the possibility that the remaining wild-type NS allele upregulated its expression in the NS+/− cells. The PDL (see Materials and Methods) of the NS+/− MEFs (from 6 embryos) began to fall below that of the wild-type cells (from 9 littermates) from passage 4 (P4) to P8 (P < 0.0001 by repeated measures ANOVA) (Fig. 2B). Yet, the NS+/− and wild-type MEF cultures both reached growth plateaus at P7.
FIG. 2.
Expression of NS protein and population doublings were decreased in the NS+/− MEFs compared to the wild-type (WT) cells. (A) The expression levels of NS protein in the WT and NS+/− MEFs from P1 to P7 were determined in parallel by Western blot analyses using an anti-NS antibody (Ab2438). Anti-α-tubulin immunoblots were used as loading references (α-Tub). (B) The PDLs (y axis) in the NS+/− (black) and WT (gray) MEF cultures were plotted from P1 to P8 (x axis). PDLs were calculated using the formula ΔPDL = log(nf/n0)/log2, where n0 is the initial number of cells and nf is the final number of cells. Error bars represent standard errors of the means.
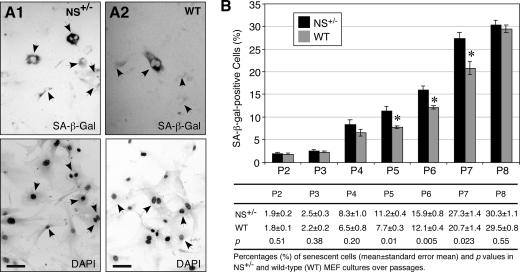
The reduced population doubling number of the NS+/− MEF culture after P3 can be explained by an increase in the cell cycle length or in the number of cells going into senescence. To differentiate these two possibilities, the numbers of senescent cells in the P2 to P8 cultures were measured by the senescence-associated β-galactosidase (SA-β-Gal) assay (Fig. 3A). Before P5, the percentages of senescent cells in the NS+/− and wild-type MEF cultures were statistically indistinguishable from each other. From P5 to P7, the percentages of SA-β-Gal+ cells in the NS+/− MEF cultures were higher than those in the wild-type cultures (Fig. 3B) (P ≤ 0.05). At P8, the SA-β-Gal+ cell percentage in the wild-type culture increased to the same level as in the NS+/− culture. These results demonstrate that NS haploinsufficiency can increase the number of MEFs going into senescence in the P5 to P7 cultures.
FIG. 3.
NS haploinsufficiency led to increased numbers of senescent cells in the P5 to P7 MEF cultures. Representative views of the senescent cells, detected by the SA-β-Gal assay in the top panels, and the total numbers of cells, determined by DAPI nuclear staining in the bottom panels, were shown for the P7 NS+/− (A1) and wild-type (WT, A2) MEF cultures. Arrows indicate SA-β-Gal+ cells. Bars, 100 μm. (B) The percentages of SA-β-Gal+ cells were increased in the NS+/− MEF culture (black bars) compared to the WT culture (gray bars) from P5 to P7 (top panel). Error bars represent standard errors of the means. Means (± standard errors of the means) and P values are provided in the bottom panel.
Creation of NS overexpression transgenics and phenotypic rescue of the NS−/− embryo.
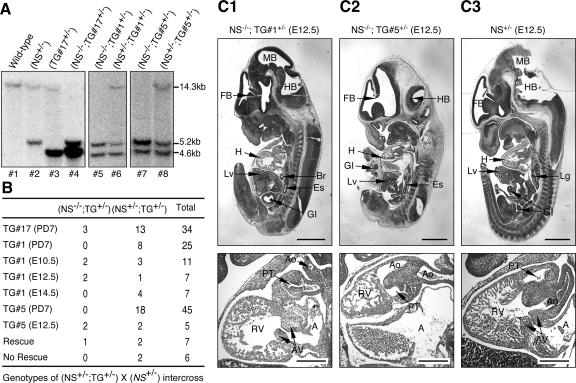
To support the knockout results from a gain-of-function angle, we generated mice that overexpressed NS but still maintained its endogenous transcriptional regulation. To do so, a BAC transgene was used that contained a 225-kb genomic fragment of the NS locus. An IRES-GFP cassette was engineered after the stop codon of NS to facilitate transgene detection both at the genomic and the mRNA levels (Fig. 4A). Four transgenic lines were established. PCR analyses of the F1 genomic DNAs showed that lines TG#17 and TG#3 harbored the highest copy number of the transgene, followed by TG#1 and TG#5 (Fig. 4B). The absolute copy number of transgenes per allele was later measured by comparing the intensities of the transgene and the NS-null fragments in the NS+/− TG+/− genomic Southern blots (Fig. 5A). Semiquantitative RT-PCRs demonstrated that line TG#17 expressed the highest level of GFP and NS in the adult testis, followed by lines TG#3, TG#1, and TG#5 in decreasing order (Fig. 4C).
FIG. 5.
NS transgene rescued homozygous NS-null (NS−/−) embryos in a dose-dependent manner. (A) To rescue NS−/− mice using the transgenic alleles, compound heterozygous mice (NS+/− TG+/−) were crossed with NS+/− mice. The genotypes of their bigenic offspring were determined by Southern blots in which the NS transgene, NS-null, and endogenous NS alleles would yield 4.6-kb, 5.2-kb, and 14.3-kb fragments, respectively. Pups 4, 5, and 7 represented NS−/− TG+/− mice or embryos. The transgene copy numbers, determined by the intensity ratios between the transgene and the NS-null allele, were 2, 1, and 4 for the TG#1, TG#5, and TG#17 lines, respectively. (B) The high-expression TG#17 line could functionally rescue NS−/− embryos into adulthood. By contrast, the lower-copy-number TG#1 could rescue the NS-null embryos only up to E12.5. The rescue probability of the TG#1 allele dropped significantly between E12.5 and E14.5. Although identifiable at E12.5, NS−/− TG#5+/− embryos appeared developmentally delayed. The predicted ratios for rescue and no rescue are shown. (C) Hematoxylin-eosin immunohistochemistry of the sagittal sections of the whole NS−/− TG#1+/−, NS−/− TG#5+/−, and NS+/− embryos at E12.5 are shown in the top panels of C1, C2, and C3, respectively. Higher magnifications of the heart are shown in the bottom panels. The outflow track (pulmonary trunk and aorta) and the right ventricle of the NS−/− TG#1+/− embryo were underdeveloped. In addition to dilated atria and small ventricles, the pulmonary trunk and aorta of the NS−/− TG#5+/− embryo were in the wrong position, indicating an outflow track-remodeling defect. Abbreviations: FB, forebrain; MB, midbrain; HB, hindbrain; H, heart; Lv, liver; Lg, lung; Br, bronchus; Es, esophagus; GI, gastrointestinal tract; RV, right ventricle; A, atrium; PT, pulmonary trunk; Ao, aorta; AV, atrioventricular cushion. Bars: 1 mm (top panels), 300 μm (bottom panels).
To test if the BAC transgene could functionally rescue the NS−/− embryo, compound heterozygous mice (NS+/− TG+/−) were mated with the NS+/− mice. Their offspring were genotyped by Southern blots in which the endogenous NS, the NS-null, and the NS transgene alleles would generate 14.3-kb, 5.2-kb, and 4.6-kb fragments, respectively (Fig. 5A). Due to the transfer inefficiency of large-sized fragments and the length of the right-arm probe (250 bp), the signal intensity of the 14.3 kb band appeared weaker than that of the 5.2-kb band. From the NS+/− TG#17+/− and NS+/− intercross, the NS−/− TG#17+/− to NS+/− TG#17+/− to total ratio was determined to be 3-13-34 at PD7 (Fig. 5B). The rescued NS−/− TG#17+/− mice were indistinguishable from the wild-type mice in their development, growth, and mating capabilities. To determine if the TG#1 allele, which had a lower transgene copy number than the TG#17 allele, was able to rescue the NS−/− embryos, we genotyped the offspring from the NS+/− TG#1+/− × NS+/− intercross. After testing 25 mice at PD7, 8 compound heterozygous mice NS+/− TG#1+/− were generated, but no rescued mice (NS−/− TG#1+/−) were identified. To further define the developmental age when NS−/− TG#1+/− embryos died, we harvested embryos from the NS+/− TG#1+/− × NS+/− mating at E10.5, E12.5, and E14.5. Genotyping results showed that the percentage of NS−/− TG#1+/− embryos dropped significantly between E12.5 and E14.5. At E14.5, 4 of 7 embryos from 3 litters were compound heterozygous, and none were rescued embryos (Fig. 5B). Although the gross tissue morphology of the E12.5 TG#1-rescued embryo (NS−/− TG#1+/−) appeared normal (Fig. 5C1, top panel) at the organ level, the NS−/− TG#1+/− embryo had a smaller right ventricle and a shorter outflow tract than did the NS+/− embryo (Fig. 5C1 and C3, bottom panels). From the NS+/− TG#5+/− × NS+/− mating, we were able to identify NS−/− TG#5+/− embryos at E12.5 but not at PD7 (Fig. 5B). The E12.5 NS−/− TG#5+/− embryo displayed severe cardiac defects, including distended atria, small ventricles, and a double-outlet right ventricle with overriding aorta (Fig. 5C2). These findings demonstrate that the NS transgene is functionally capable of rescuing the NS-null allele in a dose-dependent manner. The TG#17 allele is able to fully rescue NS−/− mice into adulthood. The lower-copy-numbered TG#1- and TG#5-rescued embryos die between E12.5 and E14.5 due to developmental defects in the heart.
Transgenic overexpression of NS increased the population doubling and decreased the senescence of MEFs.
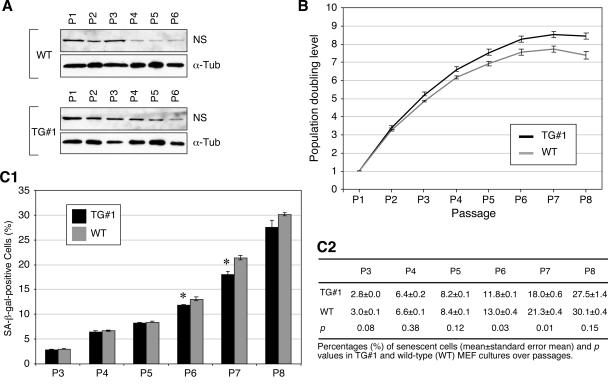
To support our findings in the NS+/− MEF culture, we determined the effect of NS overexpression on the MEFs derived from the heterozygous TG#1 (TG#1+/−) embryos chosen for their moderate level of NS overexpression. Western analyses showed that the NS expression in the TG#1 MEF cultures also gradually decreased over passages (Fig. 6A). Comparing cultures of the same passage, TG#1 MEFs expressed NS at a higher level than did the wild-type MEFs (Fig. 6A; also see Fig. S1B in the supplemental material). The NS protein amount of the TG#1 MEFs was 1.4 (± 0.09) times that of the wild-type cells. Concordantly, the PDL in the TG#1 MEF cultures (from 3 embryos) began to show some increases over the wild-type MEFs (from 6 littermates) from P5 to P8 (P < 0.001 by repeated measures ANOVA) (Fig. 6B). Despite this increase, a moderate overexpression of NS in the TG#1 MEF cultures did not alter their time to reach the population growth plateau compared to the wild-type MEF cultures. Opposite to the NS+/− cells, the percentages of SA-β-Gal+ cells in the P6 and P7 TG#1 MEF cultures were reduced compared to the wild-type cultures (P < 0.05) (Fig. 6C). These results demonstrate that NS overexpression can decrease the number of senescent cells between P6 and P7 and support the phenotypes observed in the NS+/− MEFs.
FIG. 6.
Overexpression of NS at a moderate level reduced the senescent cell percentage in the P6 and P7 MEF cultures. (A) Protein expression levels of NS in the WT and TG#1 MEFs from P1 to P6. Anti-α-tubulin immunoblots were used as loading controls (α-Tub). (B) PDLs of the TG#1 and WT MEF cultures over 8 passages was shown in black and gray, respectively. (C1) The percentages of SA-β-Gal+ cells were decreased in the TG#1 MEF cultures (black bars) compared to the WT cultures (gray bars) from P6 to P7. Error bars represent standard errors of the means in panels B and C1. Means (± standard errors of the means) and P values are shown in panel C2.
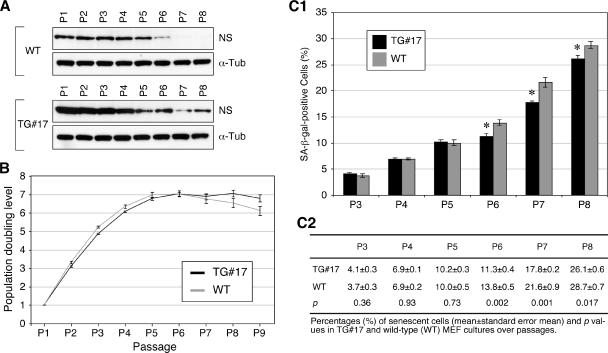
Next, we sought to determine if the level of NS overexpression affected the degree of senescence by determining the growth and senescence of the TG#17 MEFs, which expressed NS at the highest level among the four transgenic lines. Western analyses showed that TG#17 MEFs expressed the NS protein at a level higher than that of the wild-type MEFs, and similar to both the wild-type and TG#1 cells, their NS expression decreased over passages (Fig. 7A; also see Fig. S1C in the supplemental material). The NS protein amount of the TG#17 MEFs was 2.9 (± 0.2) times that of the wild-type cells. Notably, the PDL of the TG#17 MEF cultures (from 4 embryos, 8 cultures) was initially reduced compared to the wild-type MEF cultures (from 4 littermates, 8 cultures) at P2 and P3 (P < 0.01) but began to exceed the wild-type PDL from P6 (Fig. 7B). As a result, the TG#17 MEF culture was able to maintain some mitotic activities at P8, whereas the wild-type MEF culture reached a population growth plateau around P6. The growth plateau time in vitro was 3 days longer in the TG#17 MEF culture (22.1 ± 0.7 days in vitro) than in the wild-type MEF culture (19.1.1 ± 0.5 days in vitro) (P = 0.004, n = 8). This increase in the population growth rate of the TG#17 MEFs at later passages correlated with a decreased number of cells undergoing senescent changes. From P6 to P8, the percentages of SA-β-Gal+ cells in the TG#17 MEF cultures were significantly reduced compared to the wild-type cells cultured in parallel (P < 0.01 for the P6 and P7 cultures, P < 0.02 for the P8 cultures) (Fig. 7C). These data show that, although a high-level NS overexpression has a detrimental effect on cell growth initially, it becomes favorable for cell proliferation and longevity in the late-passage cultures where the NS expression is low.
FIG. 7.
MEFs overexpressing NS at a high level had a longer life span and fewer senescent cells than did the WT MEFs. (A) Protein expression levels of NS in the WT and TG#17 MEFs from P1 to P8. Anti-α-tubulin immunoblots were used as loading controls (α-Tub). (B) PDLs of the TG#17 and WT MEF cultures over 9 passages are shown in black and gray, respectively. (C) Percentages of SA-β-Gal+ cells were decreased in the TG#17 MEF cultures (black bars) compared to the WT cultures (gray bars) from P6 to P8. Error bars represent standard errors of the means in panels B and C1. Means (± standard errors of the means) and P values are shown in panel C2.
The P4 and P5 NS+/− MEF cultures have higher pre-G1 percentages than the wild-type cultures of the same passages.
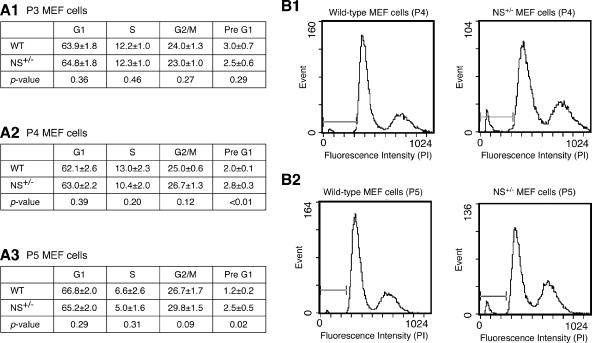
To study the partial loss-of-function effect of NS on the cell cycle profile, NS+/− and wild-type MEFs were collected from 8 embryos each, cultured in duplicate, and analyzed for their cell cycle profiles from P3 to P5. The cell cycle study revealed two differences between the NS+/− and the wild-type MEF cultures (Fig. 8). First, the NS+/− MEFs exhibited higher pre-G1 percentages, which represented apoptotic cells, than the wild-type MEFs at P4 and P5 (Fig. 8A). Second, the G2/M percentages of the NS+/− cultures increased from P3 to P5 (P < 0.001), whereas no statistical difference was seen between the G2/M percentages of the P3 and P5 wild-type cultures (P = 0.11, n = 16). Both the NS+/− and the wild-type MEF cultures showed a decrease in the S-phase cells in the P5 cultures compared to the P3 cultures (P < 0.001 and = 0.03 for the NS+/− and wild-type cells, respectively) or the P4 cultures (P = 0.02 and 0.03 for the NS+/− and wild-type cells, respectively). No statistical differences were seen in the G1- or S-phase percentages between the NS+/− and wild-type cultures of the same passages. These results indicate that a partial loss of NS function will lead to an increased number of apoptotic cells and a cell cycle blockage in the G2/M phase in the late-passage MEFs.
FIG. 8.
The pre-G1 percentage was elevated in the P4 and P5 NS+/− MEF cultures compared to the WT cultures of the same passages. (A) MEF cultures derived from 8 NS+/− and 8 WT embryos of 3 different litters were examined for their cell cycle profiles at P3, P4, and P5. Every culture was analyzed in duplicate. The average percentages of the G1, S, G2/M, and pre-G1 phase cells were summarized as means ± standard errors of the means in panel A1 for P3 cultures, panel A2 for P4 cultures, and panel A3 for P5 cultures. Statistical analyses showed that the pre-G1 cell percentages were higher in the NS+/− cultures than in the WT cultures at P4 and P5. Representative cell cycle profiles of the P4 (B1) and P5 (B2) NS+/− and WT MEF cultures are shown. x axes represent the propidium iodide (PI) intensities; y axes represent the event frequencies.
NS interacts with and destabilizes the TRF1 protein.
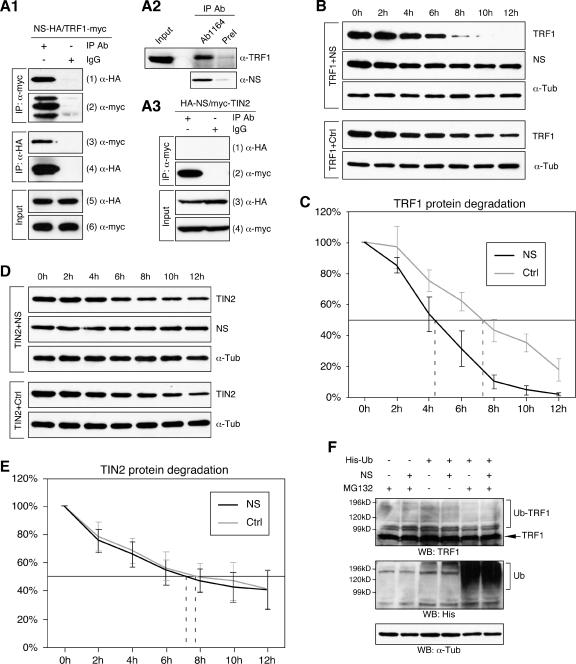
The telomere length is maintained by the telomerase (TERT) (2, 8, 18) and several telomere-binding proteins, including TRF1 (26), TRF2 (6), and TRF1-interacting nuclear protein 2 (TIN2) (12). Given the role of NS in cellular senescence, we hypothesized that NS might modulate one of the telomere-binding proteins. To test this idea, we examined the interaction between NS and these proteins in vivo in HEK293 cells transfected with both HA-tagged NS and myc-tagged candidate genes for coimmunoprecipitation. Among them, only TRF1 was able to bind NS strongly in this assay. We showed that NS could be coimmunoprecipitated with TRF1 by the anti-myc antibody (Fig. 9A1, first row, left column) but not by the mouse immunoglobulin G (right column). Similarly, TRF1 could be detected in the NS protein complex precipitated by the anti-HA antibody (third row, left column). We confirmed this in vivo interaction by showing that the endogenous TRF1 in HEK293 could be copurified with the endogenous NS protein complex precipitated by the anti-NS antiserum, but not by the control preimmune serum (Fig. 9A2). In addition, we demonstrated that there was no detectable interaction between NS and another TRF1-interacting protein, TIN2 (Fig. 9A3, 1st row, left column), suggesting that NS bound TRF1 when TRF1 was not associated with the telomeres.
FIG. 9.
NS interacted with TRF1 and negatively regulated its protein stability. (A) The interaction between NS and TRF1 was shown by in vivo coimmunoprecipitation assays. HEK293 cells were cotransfected with HA-tagged NS and myc-tagged TRF1 and immunoprecipitated with the anti-myc antibody (first and second rows, left columns), anti-HA antibody (third and fourth rows, left columns), or mouse immunoglobulin G (first to fourth rows, right columns). The copurified proteins (first and third rows) and the immunoprecipitates (second and fourth rows) were detected by Western analyses using the indicated antibodies. (A2) The endogenous TRF1 could be copurified with the endogenous NS in HEK293 cells immunoprecipitated by the anti-NS antiserum (Ab1164) but not by the preimmune serum (PreI). The NS immunoprecipitates are analyzed in the bottom panel. (A3) NS failed to bind a TRF1-interaction protein, TIN2, in coimmunoprecipitation assays in which HEK293 cells were transfected with HA-tagged NS and myc-tagged TIN2 and immunoprecipitated with the anti-myc antibody. (B) The effect of NS on the TRF1 protein stability was examined by a protein degradation assay in which myc-tagged TRF1 and HA-tagged NS (or control vector, Ctrl) were coexpressed in HEK293 cells. Thirty-six hours after transfection, living cells were treated with cycloheximide for 0 to 12 h at 2-h intervals. The amounts of TRF1 and NS proteins were determined by anti-myc and anti-HA Western blots, respectively. Anti-α-tubulin (α-Tub) Western blots were used as loading controls. (C) The amounts of TRF1 protein at every time point were measured quantitatively from scanned images of four protein degradation experiments using the ImageJ 1.36b software and expressed as a percentage of the TRF1 protein amount at the 0-h time point. (D, E) Coexpression of NS did not alter the TIN2 protein stability examined by the same assay. The amounts of TIN2 and NS proteins were determined by anti-myc and anti-HA Western blots. Anti-α-tubulin (α-Tub) immunoblots were used as loading controls. The amounts of TIN2 protein at every time point were expressed as a percentage of the TIN2 protein amount at the 0-h time point. (F) The NS effect on the ubiquitination of TRF1 protein was measured in vivo by expressing His-tagged ubiquitin (His-Ub) and NS (or control plasmid) in HEK293 cells treated with a proteasome inhibitor MG132. TRF1 protein was detected by anti-TRF1 Western blots. Lysates were blotted with the anti-His antibody to show the ubiquitination effect (Ub) and the anti-α-Tub antibody for loading controls. Coexpression of NS did not increase the high-molecular-weight species of TRF1 (Ub-TRF1) compared to the control samples.
After its release from the telomere, the TRF1 protein was subjected to the ubiquitin-proteasome-mediated degradation pathway (5). To determine if NS regulated the protein stability of TRF1 in vivo, HEK293 cells were cotransfected with HA-tagged NS (or control plasmids) and myc-tagged TRF1. Thirty-six hours after transfection, cycloheximide (100 μg/ml) was added to block new protein synthesis, and lysates were collected at 2-h intervals from 0 to 12 h. Our results showed that, in the NS-transfected cells, the rate of TRF1 protein degradation was significantly accelerated compared to the control transfected samples (Fig. 9B). Using this assay, we estimated the TRF1 protein half-life to be 4.9 (± 0.4) h in the NS-transfected cells and 7.6 (± 0.6) h in the control transfected cells (P = 0.005) based on the analysis of four independently conducted experiments (Fig. 9C). Consistent with the lack of binding between NS and TIN2, NS did not affect the protein stability of TIN2 measured by the same method (Fig. 9D and E). Because the protein stability of TRF1 was regulated by the ubiquitin-proteasome pathway, we examined whether NS had an effect on the ubiquitination of TRF1 protein in vivo. His-tagged ubiquitin (His-Ub) and NS (or control vector) were coexpressed in HEK 293 cells, and the ubiquitination patterns of the TRF1 protein in the NS-expressing or control samples were revealed by anti-TRF1 Western blots. Despite the obvious ubiquitination of whole-cell proteins after the His-Ub transfection and MG132 treatment, coexpression of NS did not increase the amount of high-molecular-weight TRF1 bands compared to the control lysates receiving the same treatment (Fig. 9F). Together these results show that NS is capable of increasing the protein turnover of TRF1 without affecting its ubiquitination level.
DISCUSSION
In this report, we demonstrate that a complete NS loss of function causes embryonic lethality as early as E3.5, consistent with its high expression in ES cells. NS haploinsufficiency reduces the population doubling levels in the MEF culture, which correlates with increases in the percentage of cells entering senescence from P5 to P7. Cell cycle analyses show that the NS+/− MEF cultures contain more pre-G1 cells than the wild-type cultures do at P4 and P5, indicating an increased number of apoptotic cells. These phenotypes of NS haploinsufficiency are supported by a BAC transgenic model that elevates the expression of NS in a physiological manner. MEF cultures derived from this transgenic model display an increased population doubling number and a decreased SA-β-Gal+ cell percentage at late passages compared to the wild-type cultures. In the high-NS-expressing transgenic line, the mitotic activity of the MEF cultures is maintained for several more days after the wild-type MEFs cease to proliferate. These data place NS among a few genes, including TRF1 (11) and MDM2 (17), whose deletions were shown to cause embryonic lethality around implantation and provide functional evidence connecting a stem cell pathway with cellular aging.
Common causes for cellular senescence include reactive oxygen species, telomere attrition, genomic damages, and the ras oncogene. Oxidative stress is the major factor for mouse cells in culture to become senescent (19). NS is predominantly distributed in the nucleolus. Several nucleolar proteins, as well as a disruption of the nucleolar structure (21), are involved in p53 transactivation in response to a variety of cellular stresses. Despite the observation that NS could bind p53 (24), we did not detect any significant changes in the p53 expression level in the partial loss-of-function MEFs (see Fig. S2 in the supplemental material). Instead, we uncovered an interaction between NS and a telomere-binding protein, TRF1, and demonstrated that NS could increase the rate of TRF1 protein degradation. TRF1 provides a negative feedback mechanism for telomere length maintenance by blocking the access of telomerase to and the elongation of telomeres (25). In addition to its role in telomere maintenance, targeted deletion of TRF1 causes early embryonic lethality (day 5 to 6 postcoitus), suggesting that murine TRF1 has an essential function in early embryogenesis independent of telomere length regulation (11). Based on our findings, we propose that one of the functions of NS is to facilitate the degradation of TRF1, which promotes the elongation of telomeres and protects continuously dividing cells from telomere attrition (Fig. 10A). Because NS fails to increase the ubiquitination of TRF1, this activity of NS may occur after the ubiquitination step. This effect of NS may influence the aging of human cells more than it does on the mouse cells, which are known to senesce with high telomerase activities and long telomeres, and may also regulate the non-telomere-related functions of TRF1 during early embryogenesis and in the cell cycle checkpoint control. An F-box protein, FBX4, has been shown to promote the TRF1 protein degradation (14), suggesting a possible connection between NS and the FBX4-mediated pathway.
FIG. 10.
NS regulates the protein stability of TRF1 and controls cell proliferation and senescence. (A) Our findings support a model in which NS promotes the degradation of TRF1 protein without affecting its ubiquitination level. This activity of NS will favor the removal of TRF1 from the telomeres and allow telomerase to access and elongate the telomere. (B) NS exerts a threshold effect on dividing cells. Cells undergo continuous proliferation when their NS expression levels (y axis) are within a certain threshold (between H and M). When the expression of NS drops below the M point, cells begin to enter into senescence. Most cells will become mitotically inactive when NS falls below the low level (L). Paradoxically, excessive amounts of NS will inhibit cell proliferation, as seen in the P1 and P2 cultures of TG#17 MEFs. Over passages, NS expression in the NS+/− MEFs begins to fall below the M level first, followed by the WT, TG#1, and TG#17 cells, which explains why the effect of NS perturbation in these models is most obvious between P5 and P8.
In our NS gain-of-function paradigms, the PDL increase (ΔPDL) in the TG#17 MEFs was notably less than that of the wild-type MEFs in the P1 and P2 cultures but began to surpass the wild-type ΔPDL as the expression of NS started to decrease at later passages. These results suggest that an NS gain-of-function phenotype can only be achieved by an optimal level of overexpression and that a high-level overexpression of NS may inversely affect cell proliferation. Supporting this idea, transient overexpression of NS in U2OS cells was shown to cause a cell cycle block between the late-S and G2 phases (24). In addition, we selected stable U2OS cell lines that expressed a hemagglutinin-tagged NS transgene at different levels and demonstrated that the low-overexpression lines (clones 9 and B1) had a clear growth advantage over the wild-type cells, whereas the moderate (clone 1)- and high (clone 12)-overexpression lines displayed a similar or slowed growth rate compared to the control (see Fig. S3 in the supplemental material). In the MEF cultures, this negative effect of a high-level NS overexpression on cell proliferation turns into a positive one when the transcriptional activity controlling the NS expression decreases at later passages. As a result, the TG#17 MEF culture is able to maintain some mitotic activities after P7. Unlike the TG#17 cells, the NS+/−, TG#1, and wild-type MEF cultures become mitotically inactive at about the same time, indicating that the population growth plateau time in those cultures is determined primarily by the senescence-triggered downregulation of NS at P7. These results suggest a model in which cell proliferation and senescence are controlled by a threshold level of NS (Fig. 10B). Because the NS expression gradually decreases over passages, the NS+/− MEFs become the first to reach this threshold, followed sequentially by the wild-type, TG#1, and TG#17 MEFs, which explains why the differences in the PDL and SA-β-Gal+ percentage between the NS+/−, wild-type, TG#1, and TG#17 MEF cultures are most obvious from P5 to P7.
The loss of NS expression over passages in the transgenic MEFs is a result of the BAC transgenic design that retains the endogenous transcriptional control on the transgenic alleles. By comparing the Southern intensities of the transgenic and the NS-null alleles of the NS+/− TG+/− mice (Fig. 5A), we estimate the transgene copy numbers to be 2, 1, and 4 for TG#1, TG#5, and TG#17, respectively. While the TG#17 allele can rescue NS−/− embryos in vivo into adulthood, the TG#1 and TG#5 alleles are able to do so only until E12.5 (TG#1) or before (TG#5). Compared to the NS+/− littermates, the right ventricle and the outflow track of the TG#1-rescued E12.5 embryo (NS−/− TG#1+/−) were underdeveloped. Consistent with the transgene copy number, the NS−/− TG#5+/− embryo had even more severe cardiac phenotypes than the NS−/− TG#1+/− embryo, which include distended atria, small ventricles, and a double-outlet right ventricle with overriding aorta. The fact that the TG#5 and TG#1 alleles fail to rescue NS−/− embryos completely argues that, on a per-copy basis, the NS transgene is expressed at a lower level than the endogenous NS allele and that NS plays a critical role in the cardiac development around E12.5, which may not be revealed by our MEF studies. Failure of the NS−/− embryo to pass the blastula stage and the TG#1- and TG#5-rescued embryos to pass E14.5 demonstrate a lack of in vivo compensatory mechanisms for the NS function during the early and mid-embryonic development. Two NS-related genes, GNL3L (guanine-nucleotide binding protein 3-like protein) and Ngp1, are found in humans and rodents. Phylogenetically, NS and GNL3L are more closely related to each other than to Ngp1. A previous study showed that the human GNL3L gene was able to complement the function of Grn1p (the yeast homologue of NS and GNL3L) in fission yeasts, but the human NS failed to do so (7). Given that all three genes (NS, GNL3L, and Ngp1) are expressed in the mouse ES cells (unpublished data), our findings support the idea that NS has functionally diverged from GNL3L and Ngp1 in mice.
In summary, this work provides the first in vivo evidence demonstrating the essential role of NS in early embryogenesis. We also show that the endogenous expression level of NS inversely correlates with cellular senescence. Lowering or elevating NS expression is able to increase or decrease the senescence of MEFs, respectively. Finally, NS provides a link between stem cells and the aging process through its regulation of TRF1 protein stability.
Supplementary Material
Acknowledgments
We thank Jaime Bailey for help with the gene targeting experiment, Paul Swinton for technique support with the microinjection and blastocyst collection, and Neal Copeland for providing the BAC recombineering vectors. We also thank James Martin, Di Ai, Fen Wang, and Dekai Zhang for insightful comments on this project.
This work is supported by the TIRR/Mission Connect fund and Public Health Service grant CA113750 from the National Cancer Institute to R.Y.L.T.
Footnotes
Published ahead of print on 25 September 2006.
Supplemental material for this article may be found at http://mcb.asm.org/.
REFERENCES
- 1.Baddoo, M., K. Hill, R. Wilkinson, D. Gaupp, C. Hughes, G. C. Kopen, and D. G. Phinney. 2003. Characterization of mesenchymal stem cells isolated from murine bone marrow by negative selection. J. Cell. Biochem. 89:1235-1249. [DOI] [PubMed] [Google Scholar]
- 2.Blasco, M. A., W. Funk, B. Villeponteau, and C. W. Greider. 1995. Functional characterization and developmental regulation of mouse telomerase RNA. Science 269:1267-1270. [DOI] [PubMed] [Google Scholar]
- 3.Blasco, M. A., H. W. Lee, M. P. Hande, E. Samper, P. M. Lansdorp, R. A. DePinho, and C. W. Greider. 1997. Telomere shortening and tumor formation by mouse cells lacking telomerase RNA. Cell 91:25-34. [DOI] [PubMed] [Google Scholar]
- 4.Burns, C. E., and L. I. Zon. 2002. Portrait of a stem cell. Dev. Cell 3:612-613. [DOI] [PubMed] [Google Scholar]
- 5.Chang, W., J. N. Dynek, and S. Smith. 2003. TRF1 is degraded by ubiquitin-mediated proteolysis after release from telomeres. Genes Dev. 17:1328-1333. [DOI] [PMC free article] [PubMed] [Google Scholar]
- 6.Cooper, J. P., E. R. Nimmo, R. C. Allshire, and T. R. Cech. 1997. Regulation of telomere length and function by a Myb-domain protein in fission yeast. Nature 385:744-747. [DOI] [PubMed] [Google Scholar]
- 7.Du, X., M. R. Rao, X. Q. Chen, W. Wu, S. Mahalingam, and D. Balasundaram. 2006. The homologous putative GTPases Grn1p from fission yeast and the human GNL3L are required for growth and play a role in processing of nucleolar pre-rRNA. Mol. Biol. Cell 17:460-474. [DOI] [PMC free article] [PubMed] [Google Scholar]
- 8.Feng, J., W. D. Funk, S. S. Wang, S. L. Weinrich, A. A. Avilion, C. P. Chiu, R. R. Adams, E. Chang, R. C. Allsopp, J. Yu, et al. 1995. The RNA component of human telomerase. Science 269:1236-1241. [DOI] [PubMed] [Google Scholar]
- 9.Fortunel, N. O., H. H. Otu, H. H. Ng, J. Chen, X. Mu, T. Chevassut, X. Li, M. Joseph, C. Bailey, J. A. Hatzfeld, A. Hatzfeld, F. Usta, V. B. Vega, P. M. Long, T. A. Libermann, and B. Lim. 2003. Letter. Science 302:393. (Author's reply, 302:393.) [DOI] [PubMed] [Google Scholar]
- 10.Kafienah, W., S. Mistry, C. Williams, and A. P. Hollander. 2006. Nucleostemin is a marker of proliferating stromal stem cells in adult human bone marrow. Stem Cells 24:1113-1120. [DOI] [PubMed] [Google Scholar]
- 11.Karlseder, J., L. Kachatrian, H. Takai, K. Mercer, S. Hingorani, T. Jacks, and T. de Lange. 2003. Targeted deletion reveals an essential function for the telomere length regulator Trf1. Mol. Cell. Biol. 23:6533-6541. [DOI] [PMC free article] [PubMed] [Google Scholar]
- 12.Kim, S. H., P. Kaminker, and J. Campisi. 1999. TIN2, a new regulator of telomere length in human cells. Nat. Genet. 23:405-412. [DOI] [PMC free article] [PubMed] [Google Scholar]
- 13.Lee, E. C., D. Yu, J. Martinez de Velasco, L. Tessarollo, D. A. Swing, D. L. Court, N. A. Jenkins, and N. G. Copeland. 2001. A highly efficient Escherichia coli-based chromosome engineering system adapted for recombinogenic targeting and subcloning of BAC DNA. Genomics 73:56-65. [DOI] [PubMed] [Google Scholar]
- 14.Lee, T. H., K. Perrem, J. W. Harper, K. P. Lu, and X. Z. Zhou. 2006. The F-box protein FBX4 targets PIN2/TRF1 for ubiquitin-mediated degradation and regulates telomere maintenance. J. Biol. Chem. 281:759-768. [DOI] [PubMed] [Google Scholar]
- 15.Liu, P., N. A. Jenkins, and N. G. Copeland. 2003. A highly efficient recombineering-based method for generating conditional knockout mutations. Genome Res. 13:476-484. [DOI] [PMC free article] [PubMed] [Google Scholar]
- 16.Liu, S. J., Z. W. Cai, Y. J. Liu, M. Y. Dong, L. Q. Sun, G. F. Hu, Y. Y. Wei, and W. D. Lao. 2004. Role of nucleostemin in growth regulation of gastric cancer, liver cancer and other malignancies. World J. Gastroenterol. 10:1246-1249. [DOI] [PMC free article] [PubMed] [Google Scholar]
- 17.Montes de Oca Lunaqq, R., D. S. Wagner, and G. Lozano. 1995. Rescue of early embryonic lethality in mdm2-deficient mice by deletion of p53. Nature 378:203-206. [DOI] [PubMed] [Google Scholar]
- 18.Nakamura, T. M., G. B. Morin, K. B. Chapman, S. L. Weinrich, W. H. Andrews, J. Lingner, C. B. Harley, and T. R. Cech. 1997. Telomerase catalytic subunit homologs from fission yeast and human. Science 277:955-959. [DOI] [PubMed] [Google Scholar]
- 19.Parrinello, S., E. Samper, A. Krtolica, J. Goldstein, S. Melov, and J. Campisi. 2003. Oxygen sensitivity severely limits the replicative lifespan of murine fibroblasts. Nat. Cell Biol. 5:741-747. [DOI] [PMC free article] [PubMed] [Google Scholar]
- 20.Politz, J. C., I. Polena, I. Trask, D. P. Bazett-Jones, and T. Pederson. 2005. A nonribosomal landscape in the nucleolus revealed by the stem cell protein nucleostemin. Mol. Biol. Cell 16:3401-3410. [DOI] [PMC free article] [PubMed] [Google Scholar]
- 21.Rubbi, C. P., and J. Milner. 2003. Disruption of the nucleolus mediates stabilization of p53 in response to DNA damage and other stresses. EMBO J. 22:6068-6077. [DOI] [PMC free article] [PubMed] [Google Scholar]
- 22.Sijin, L., C. Ziwei, L. Yajun, D. Meiyu, Z. Hongwei, H. Guofa, L. Siguo, G. Hong, Z. Zhihong, L. Xiaolei, W. Yingyun, X. Yan, and L. Weide. 2004. The effect of knocking-down nucleostemin gene expression on the in vitro proliferation and in vivo tumorigenesis of HeLa cells. J. Exp. Clin. Cancer Res. 23:529-538. [PubMed] [Google Scholar]
- 23.Tsai, R. Y., and R. D. McKay. 2005. A multistep, GTP-driven mechanism controlling the dynamic cycling of nucleostemin. J. Cell Biol. 168:179-184. [DOI] [PMC free article] [PubMed] [Google Scholar]
- 24.Tsai, R. Y., and R. D. McKay. 2002. A nucleolar mechanism controlling cell proliferation in stem cells and cancer cells. Genes Dev. 16:2991-3003. [DOI] [PMC free article] [PubMed] [Google Scholar]
- 25.van Steensel, B., and T. de Lange. 1997. Control of telomere length by the human telomeric protein TRF1. Nature 385:740-743. [DOI] [PubMed] [Google Scholar]
- 26.Zhong, Z., L. Shiue, S. Kaplan, and T. de Lange. 1992. A mammalian factor that binds telomeric TTAGGG repeats in vitro. Mol. Cell. Biol. 12:4834-4843. [DOI] [PMC free article] [PubMed] [Google Scholar]
Associated Data
This section collects any data citations, data availability statements, or supplementary materials included in this article.


