Abstract
Infantile neuroaxonal dystrophy (INAD) is an autosomal recessive progressive neurodegenerative disease that presents within the first 2 years of life and culminates in death by age 10 years. Affected individuals from two unrelated Bedouin Israeli kindreds were studied. Brain imaging demonstrated diffuse cerebellar atrophy and abnormal iron deposition in the medial and lateral globus pallidum. Progressive white-matter disease and reduction of the N-acetyl aspartate:chromium ratio were evident on magnetic resonance spectroscopy, suggesting loss of myelination. The clinical and radiological diagnosis of INAD was verified by sural nerve biopsy. The disease gene was mapped to a 1.17-Mb locus on chromosome 22q13.1 (LOD score 4.7 at recombination fraction 0 for SNP rs139897), and an underlying mutation common to both affected families was identified in PLA2G6, the gene encoding phospholipase A2 group VI (cytosolic, calcium-independent). These findings highlight a role of phospholipase in neurodegenerative disorders.
Infantile neuroaxonal dystrophy (INAD) (MIM 256600) is a neurodegenerative disease characterized by pathologic axonal swelling and spheroid bodies in the CNS.1 Onset is within the first 2 years of life, and the disease culminates in death by age 10 years. Most patients with INAD show a progressive disorder with motor and mental deterioration, cerebellar ataxia, marked hypotonia of the trunk with later bilateral pyramidal tract signs, spastic tetraplegia, hyperreflexia, and early visual disturbances. Seizures are not reported. Electroencephalography shows characteristic high-voltage fast rhythms, with electromyography results consistent with chronic denervation. All patients have abnormal visual evoked potentials.2,3 T2-weighted magnetic resonance imaging (MRI) typically shows cerebellar atrophy with signal hyperintensity in the cerebellar cortex and, occasionally, hypointensity in the pallida and substantia nigra.4 Pathological hallmarks are marked neuroaxonal dystrophy, severe cerebellar atrophy, and degeneration of the lateral corticospinal tracts. Axonal endings show spheroid bodies, often detectable in the skin and conjunctivae.
The similar disorder pantothenate kinase-associated neurodegeneration (PKAN), also known as “Hallervorden-Spatz disease,” has overlapping clinical and pathologic features and is caused by mutations in the PANK2 gene (MIM *606157; GenBank accession number NM_153640).5 PKAN is described as an extrapyramidal syndrome with dystonia and choreoathetosis. In PKAN, the pattern of iron accumulation in the basal ganglia is unique and results in a characteristic “tiger eye” sign on brain MRI: a combination of high signal intensity in the center of the globus pallidum and low signal intensity in the surrounding region.6 This tiger eye phenomenon is typically absent in INAD. PKAN usually has a late-infantile or juvenile age at onset, with patients typically surviving into their 3rd decade.5 It is noteworthy that early-onset cases of PKAN and late-onset cases of INAD have been reported.5 Linkage analysis and molecular analysis5 excluded the PANK2 gene as causative in eight patients with INAD from seven families,1,4 indicating that INAD and PKAN are genetically distinct disorders.
Another disease to be considered in the differential diagnosis of INAD is Schindler disease type I, which is caused by mutations in α-N-acetylgalactosaminidase (NAGA). The resulting NAGA deficiency is a rare lysosomal storage disorder presenting as INAD with severe psychomotor retardation, myoclonic seizures, decorticate posture, optic atrophy, blindness, marked long-tract signs, and total loss of contact with the environment by age 3–4 years.7 Characteristic “spheroids” are observed histologically and ultrastructurally in terminal axons in gray matter. MRI of the brain shows diffuse white-matter abnormalities with a secondary, symmetrical demyelination. Diagnosis is achieved through urinary oligosaccharide measurements and enzymatic assays of NAGA activity in leukocytes or fibroblasts.8
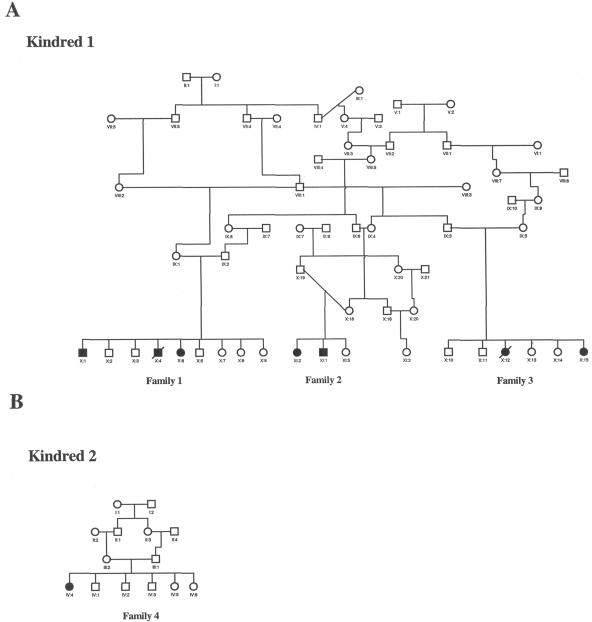
Here, in a study done independently of and in parallel to that by Morgan et al.,9 we report the identification of a homozygous mutation in PLA2G6 (MIM *603604), the gene encoding phospholipase A2 (PLA2) group VI (cytosolic, calcium-independent [Entrez Protein accession number NP_003551.2]), as being associated with INAD in two Israeli Bedouin families. Two consanguineous inbred Israeli Bedouin kindred presented with a similar, apparently autosomal recessive, severe progressive neurodegenerative phenotype affecting a total of 8 individuals (fig. 1). Of the 8 patients, 6 were available for detailed clinical and molecular analyses. The study was approved by the Soroka University Medical Center Institutional Review Board and by the Israel National Helsinki Committee in Genetics, and informed consent was obtained from all individuals tested. Affected individuals were free of symptoms at birth, achieved milestones such as initial walking and speaking several words, presented at age 10–18 mo with regression in cognitive and motor abilities, and progressed to a vegetative state by age 4 years and death at age 7–10 years. Clinical hallmarks were hypotonia of the trunk with enhanced tonus in the limbs (spastic quadriplegia), augmented tendon reflexes, and symmetric pyramidal tract signs. Combined vertical and horizontal nystagmus and pallor of the optic discs were evident. There was no dysmorphism and no defects or phenotypic stigmata other than the neurological phenotype.
Figure 1. .
Pedigrees of the investigated families. A, Kindred 1, in which 5 affected individuals and 15 unaffected individuals were available for genetic analysis. B, Kindred 2, in which one affected individual and two parents were available for genetic analysis. A high rate of consanguinity and an autosomal recessive pattern of inheritance can be observed.
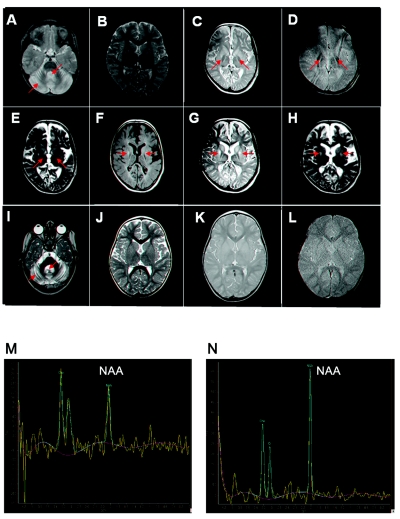
Of the 8 affected individuals, 6 had undergone CT or MRI studies, all showing the radiological hallmarks of INAD—namely, severe cerebellar atrophy and hypointensity in the pallida (suggestive of iron accumulation). Figure 2 shows index patients (from each of the two kindreds) who were subject, at various ages, to repeated MRI studies that showed a consistent pattern of progression of the radiological findings: at early stages, the sole findings were of cerebellar atrophy, which progressed with age. Later, they developed progressive disease of the white matter. Magnetic resonance spectroscopy (MRS) depicts the chemical composition of tissues on the basis of differences in resonance frequencies of tissue metabolites. In affected individuals, MRS of the white matter showed conversion of the normal pattern of the N-acetyl aspartate (NAA):chromium (Cr) and NAA:choline compounds (Cho) ratios (fig. 2N) to significant reduction of NAA, suggesting loss of myelinization (fig. 2M). Abnormal signals in the globus pallidum were noted as low signals on T2-, T2*-, and proton density (PD)–weighted images, suggestive of iron accumulation. It should be noted that the abnormal signals were seen in both the medial and lateral portions of the globus pallidum. Tiger eye sign was not seen on any of the MRI studies. Abnormal hyperintense signals on T2 and fluid attenuated inversion recovery sequences were seen in the medial aspect of the putamen, most probably as part of a degenerative process.
Figure 2. .
MRI studies. Patient X1:2 is shown at age 3 years (A and B) and, in a follow-up study, at age 9 years (C–H). A, PD-weighted brain MRI showing early atrophy of the cerebellum, with prominent folia and fourth ventricle. B, T2-weighted brain MRI of the supratentorial region is unremarkable; there are no signs of iron deposition in the globus pallidum. C–E, PD-, T2*-, and T2-weighted brain MRI, respectively, showing the development of iron deposition in the medial and lateral parts of the globus pallidum, as well as significant brain atrophy. Note absence of the tiger eye sign. F–H, T1-, T2-, and PD-weighted brain MRI, respectively, showing abnormal signal, in the medial part of the putamen, that was not present at an earlier age. Brain MRI of patient IV:4 is shown at age 2 years (I–L). I, T2-weighted brain MRI showing severe atrophy of the cerebellum, with very prominent folia and fourth ventricle. J–L, T2-, T2*-, and PD-weighted brain MRI, respectively, at the level of the basal ganglia, showing normal signal intensity of the globus pallidum and putamen, with no evidence of brain atrophy. M, MRS (echo time [TE]=144 ms) of the white matter of patient X1:2 at age 9 years, showing conversion of the normal pattern of NAA:Cr and NAA:Cho ratio to significant reduction of NAA. N, MRS of the brain (TE = 144 ms) of patient X1:2 at age 3 years, showing normal ratio of NAA to Cho and Cr.
The results of metabolic tests were all within normal limits. These tests included measurements of hepatic function, renal function, thyroid function, creatine phosphokinase, lactate, pyruvate, ammonia, carnitine (total and free), very long-chain fatty acids, urinary oligosaccharides, urinary organic acids, and blood and urinary amino acids. Transferrin electrophoresis (for carbohydrate-deficient glycoprotein syndrome) and karyotypes were also normal; specific enzymatic assays in affected individuals ruled out Krabbe disease, metachromatic leukodystrophy, and NAGA deficiency.
Whereas results of rectal and skin biopsies were normal, electron-microscopy analysis of sural nerve biopsy was consistent with INAD, with axons showing spheroid bodies. Results of muscle biopsies (gastrocnemius) were normal. It should be noted that spheroids are not expected to be seen in all biopsy specimens from patients with INAD.9
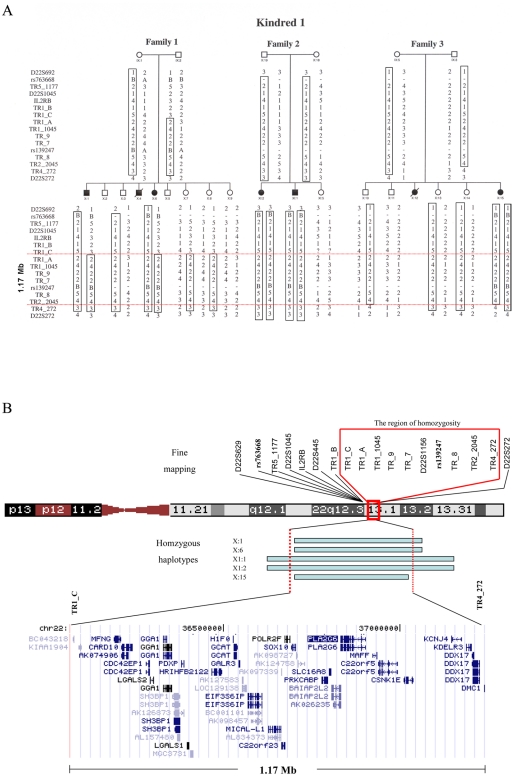
On the basis of the consanguinity of the families studied, we assumed a founder effect in the affected families. Affected individuals were shown to not be homozygous at the PANK2 locus, which ruled out PKAN (data not shown). Genomewide linkage analysis with the use of 400 polymorphic markers (ABI PRISM Linkage Mapping Set MD10 [Applied Biosystems]) was conducted with five affected individuals of kindred 1. The individuals tested were X:1, X:6, XI:1, XI:2, and X:15, depicted in figure 1A. None of the 400 polymorphic markers tested showed homozygosity in all five affected individuals. For four markers, four of five individuals were homozygous. However, fine mapping of those regions in DNA samples of 20 family members ruled out linkage to those loci (data not shown). We then proceeded to perform a genomewide linkage analysis of the same five patients and two obligatory carriers (parents of affected individuals), using the Affymetrix 10K SNP arrays. In all five individuals, 226 loci exhibited homozygosity. Of those loci, we selected five candidate loci on the basis of two criteria: the region of homozygosity was informative (homozygous in the affected individuals and heterozygous in the obligatory carriers) and was >2 Mb. Fine mapping of these five loci—by testing the 20 available DNA samples of kindred 1 with the use of polymorphic markers—ruled out linkage to four of the five loci (data not shown). The fifth locus, on chromosome 22q13.1 (harboring SNPs rs763668 and rs139897), was bordered by recombination events in affected individuals at adjacent SNPs rs132692 and rs926299, implying a homozygosity region of 2.58 Mb (fig. 3). Figure 3 shows that fine mapping of this locus in all available 20 DNA samples of kindred 1 defined a 1.17-Mb locus between TR1_C and TR4_272 as being associated with the disease (LOD score 4.82 at θ=0 for SNP rs139897, calculated using SUPERLINK10; TR1_C and TR4_272 are polymorphic markers designed using Tandem Repeats Finder,11 [sequences available on request]). It is interesting to note that, of the 10,000 SNPs assayed, only 2 adjacent ones in the defined locus were homozygous in all five affected individuals tested. The limited size of the homozygosity locus common to the affected family members demonstrates the advantages of high-density SNP arrays and explains why genomewide linkage analysis that used 400 polymorphic markers failed to identify the disease-associated locus.
Figure 3. .
Fine mapping of the 22q13.1 locus in kindred 1. A, Disease-associated haplotype is boxed. Minimal homozygosity locus associated with the disease is defined between the markers TR1_C and TR4_272 (region between the red lines). Sequences of TR1_C and TR4_272 are available on request. B, Schematic presentation of the defined locus. Markers TR5_1177, TR1_B, TR1_C, TR1_A, TR1_1045, TR_9, TR_7, TR_8, TR2_2045 and TR4_272 were designed using Tandem Repeats Finder.10 Primer sequences are available on request.
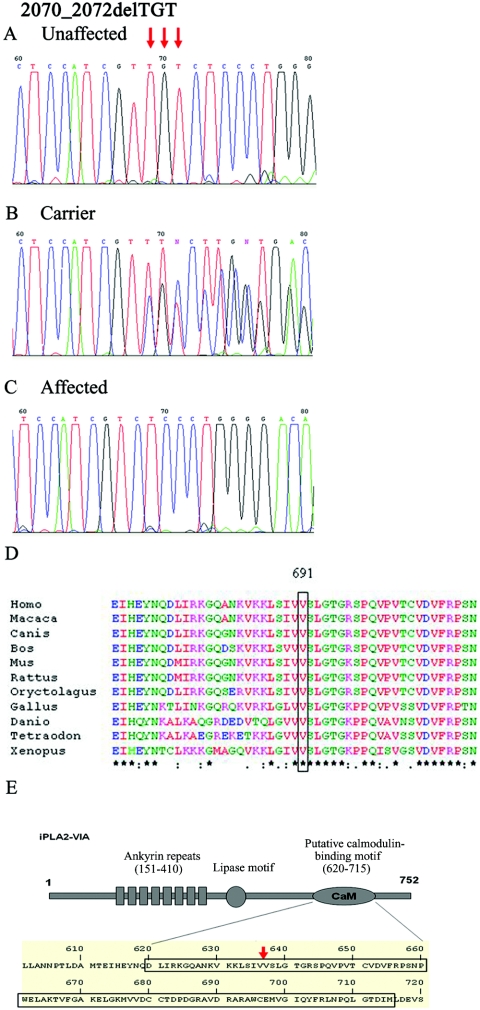
Sequencing of the coding region of 24 of the 37 genes within the 22q13.1 locus revealed no mutations (data not shown). As shown in figure 4, sequence analysis of PLA2G6 (GenBank accession number NM_003560.2) revealed a 2070_2072delTGT mutation in exon 15, which resulted in the deletion of valine at position 691 (V691del) of the encoded protein, PLA2 group VI (cytosolic, calcium-independent). An identical mutation was found in the affected individuals in kindred 2 (fig. 1). Denaturing high-pressure liquid chromatography (dHPLC) analysis of the entire two kindreds was compatible with the mutation being associated with the disease phenotype, implying full penetrance (data not shown; PCR primer sequences, amplification procedures used for sequencing, and dHPLC details are available on request). The mutation, in a heterozygous form, was found in only a single individual of 300 unrelated Bedouin controls tested by dHPLC analysis. Interestingly, both affected families and the unrelated carrier had the same haplotype surrounding the mutation. Further, in an independent study9 done in parallel to this study, the same PLA2G6 mutation was also reported in two patients unrelated to each other or to the families described here, which corroborates its association with the disease phenotype.
Figure 4. .
Mutation analysis of the 2070_2072delTGT mutation in exon 15 of PLA2G6. Sequence analysis is shown for an unaffected individual (A), an obligatory carrier (B), and an affected individual (C). D, ClustalW sequence alignment of human PLA2 group VI (cytosolic, calcium-independent) to orthologues. The V691del (boxed) of this protein is highly conserved throughout evolution. Conserved residues are indicated with asterisks. E, Deleted valine residing within a putative calmodulin-binding site of this phospholipase. Schematic is adapted from Jenkins et al.12
On the basis of these findings and those from the study by Morgan et al.,9 which demonstrated several other PLA2G6 mutations in INAD, molecular diagnosis of INAD can, at least in part, replace the invasive biopsies used in the diagnosis of this disease thus far. Moreover, carrier detection and prenatal diagnosis in affected families is made possible. In fact, we have already made molecular prenatal and presymptomatic diagnoses in two healthy siblings of affected individuals.
The function of the PLA2 enzymes is to catalyze the release of fatty acids from phospholipids. They display, therefore, a suite of physiological functions, including phospholipid remodeling, arachidonic acid release, leukotriene and prostaglandin synthesis, Fas-mediated apoptosis, and transmembrane ion flux in glucose-stimulated B-cells.13 The full-length PLA2G6 cDNA encodes an 806-aa protein with a lipase motif and seven ankyrin repeats.14,15 The human and rodent homologues of this protein share 90% amino acid sequence identity, with the human sequence differing in that it contains a 54-aa residue insertion that would interrupt the last putative ankyrin repeat. Five splice variants of the human gene are known to exist.14 Two of the alternatively spliced forms encode only the ankyrin repeat region of the protein. The three others also harbor the lipase motif (GXSXG).16 Figure 4 demonstrates that V691 of PLA2 group VI (cytosolic, calcium-independent), which is deleted in our patients, is extremely well conserved throughout evolution and resides within immediate proximity to a putative calmodulin-binding site of the phospholipase12,17 (fig. 4E). This putative calmodulin-binding motif exists in only two of the three lipase motif–containing splice variants.12 Calmodulin is known to inhibit activity of PLA2.12,17 A possible effect, if any, of the mutation on calmodulin binding, either enhancing or diminishing its inhibitory effect on the phospholipase activity, is yet to be demonstrated. However, a parallel study by Morgan et al.9 suggests that PLA2G6 mutations causing INAD are likely to result in loss of function. It is interesting to note that, in the adult rat brain (specifically including the cerebellum), the activity levels of PLA2 group VI (cytosolic, calcium-independent) are significantly higher than those of other PLA2 family members (i.e., cPLA2-IV, sPLA2-IIA, and sPLA2-V).18 Moreover, the activity of this enzyme in the rat brain is significantly augmented in the first few weeks of life, reaching a near plateau at age 10 wk.12 These facts are in line with the human PLA2G6 mutation causing the infantile-onset brain phenotype of INAD.
Acknowledgment
We thank the Kahn Family Foundation for its generous support of this project.
Web Resources
Accession numbers and URLs for data presented herein are as follows:
- Entrez Protein, http://www.ncbi.nlm.nih.gov/entrez/query.fcgi?db=Protein (for PLA2 group VI, cytosolic, calcium-independent [accession number NP_003551.2])
- GenBank, http://www.ncbi.nlm.nih.gov/Genbank/ (for PANK2 cDNA [accession number NM _153640] and PLA2G6 cDNA [accession number NM_003560.2])
- Online Mendelian Inheritance in Man (OMIM), http://www.ncbi.nlm.nih.gov/Omim/ (for INAD, PANK2, and PLA2G6)
- Tandem Repeats Finder, http://tandem.bu.edu/trf/trf.html
References
- 1.Nardocci N, Zorzi G, Farina L, Binelli S, Scaioli W, Ciano C, Verga L, Angelini L, Savoiardo M, Bugiani O (1999) Infantile neuroaxonal dystrophy: clinical spectrum and diagnostic criteria. Neurology 52:1472–1478 [DOI] [PubMed] [Google Scholar]
- 2.Aicardi J, Castelein P (1979) Infantile neuroaxonal dystrophy. Brain 102:727–748 [DOI] [PubMed] [Google Scholar]
- 3.Dorfman LJ, Redley TA, Thorp BR, Scheithauer BW (1978) Juvenile neuroaxonal dystrophy: clinical, electrophysiological, and neuropathological features. Ann Neurol 3:419–428 10.1002/ana.410030511 [DOI] [PubMed] [Google Scholar]
- 4.Farina L, Nardocci N, Bruzzone MG, D’Incerti L, Zorzi G, Verga L, Morbin M, Savoiardo M (1999) Infantile neuroaxonal dystrophy: neuroradiological studies in 11 patients. Neuroradiology 41:376–380 10.1007/s002340050768 [DOI] [PubMed] [Google Scholar]
- 5.Hortnagel K, Nardocci N, Zorzi G, Garavaglia B, Botz E, Meitinger T, Klopstock T (2004) Infantile neuroaxonal dystrophy and pantothenate kinase-associated neurodegeneration: locus heterogeneity. Neurology 63:922–924 [DOI] [PubMed] [Google Scholar]
- 6.Gregory AM, Hayflick SJ (2005) Neurodegeneration with brain iron accumulation. Folia Neuropathol 43:286–296 [PMC free article] [PubMed] [Google Scholar]
- 7.Schindler D, Bishop DF, Wolfe DE, Wang AM, Egge H, Lemieux RU, Desnick RJ (1989) Neuroaxonal dystrophy due to lysosomal alpha-N-acetylgalactosaminidase deficiency. New Engl J Med 320:1735–1740 [DOI] [PubMed] [Google Scholar]
- 8.Bakker HD, de Sonnaville MLCS, Vreken P, Abeling NGGM, Groener JEM, Keulemans JLM, van Diggelen OP (2001) Human alpha-N-acetylgalactosaminidase (alpha-NAGA) deficiency: no association with neuroaxonal dystrophy? Eur J Hum Genet 9:91–96 [DOI] [PubMed] [Google Scholar]
- 9.Morgan NV, Westaway SK, Morton JE, Gregory A, Gissen P, Sonek S, Cangul H, et al (2006) PLA2G6, encoding a phospholipase A(2), is mutated in neurodegenerative disorders with high brain iron. Nat Genet 38:752–754 10.1038/ng1826 [DOI] [PMC free article] [PubMed] [Google Scholar]
- 10.Fishelson M, Geiger D (2002) Exact genetic linkage computations for general pedigrees. Bioinformatics 18:S189–S198 [DOI] [PubMed] [Google Scholar]
- 11.Benson G (1999) Tandem repeats finder: a program to analyze DNA sequences. Nucleic Acids Res 27:573–580 10.1093/nar/27.2.573 [DOI] [PMC free article] [PubMed] [Google Scholar]
- 12.Jenkins CM, Wolf MJ, Mancuso DJ, Gross RW (2001) Identification of the calmodulin-binding domain of recombinant calcium-independent phospholipase A2β: implications for structure and function. J Biol Chem 276:7129–7135 10.1074/jbc.M010439200 [DOI] [PubMed] [Google Scholar]
- 13.Tang J, Kriz RW, Wolfman N, Shaffer M, Seehra J, Jones SS (1997) A novel cytosolic calcium-independent phospholipase A2 contains eight ankyrin motifs. J Biol Chem 272:8567–8575 10.1074/jbc.272.13.8567 [DOI] [PubMed] [Google Scholar]
- 14.Larsson PK, Claesson HE, Kennedy BP (1998) Multiple splice variants of the human calcium-independent phospholipase A2 and their effect on enzyme activity. J Biol Chem 273:207–214 10.1074/jbc.273.1.207 [DOI] [PubMed] [Google Scholar]
- 15.Akiba S, Sato T (2004) Cellular function of calcium-independent phospholipase A2. Biol Pharm Bull 27:1174–1178 10.1248/bpb.27.1174 [DOI] [PubMed] [Google Scholar]
- 16.Balsinde J, Balboa MA (2005) Cellular regulation and proposed biological functions of group VIA calcium-independent phospholipase A2 in activated cells. Cell Signal 17:1052–1062 10.1016/j.cellsig.2005.03.002 [DOI] [PubMed] [Google Scholar]
- 17.Jenkins CM, Yan W, Mancuso DJ, Gross RW (2006) Highly selective hydrolysis of fatty acyl-CoAs by calcium-independent phospholipase A2β: enzyme autoacylation and acyl-CoA-mediated reversal of calmodulin inhibition of phospholipase A2 activity. J Biol Chem 281:15615–15624 10.1074/jbc.M511623200 [DOI] [PubMed] [Google Scholar]
- 18.Yang HC, Mosior M, Ni B, Dennis EA (1999) Regional distribution, ontogeny, purification, and characterization of the Ca2+-independent phospholipase A2 from rat brain. J Neurochem 73:1278–1287 10.1046/j.1471-4159.1999.0731278.x [DOI] [PubMed] [Google Scholar]


