

Abstract
Complex I (NADH:ubiquinone oxidoreductase) is the first enzyme of the membrane-bound electron transport chain in mitochondria. It conserves energy, from the reduction of ubiquinone by NADH, as a protonmotive force across the inner membrane, but the mechanism of energy transduction is not known. The structure of the hydrophilic arm of thermophilic complex I supports the idea that proton translocation is driven at (or close to) the point of quinone reduction, rather than at the point of NADH oxidation, with a chain of iron–sulfur clusters transferring electrons between the two active sites. Here, we describe experiments to determine whether complex I, isolated from bovine heart mitochondria, operates via a Q-cycle mechanism analogous to that observed in the cytochrome bc1 complex. No evidence for the ‘reductant-induced oxidation’ of ubiquinol could be detected; therefore no support for a Q-cycle mechanism was obtained. Unexpectedly, in the presence of NADH, complex I inhibited by either rotenone or piericidin A was found to catalyse the exchange of redox states between different quinone and quinol species, providing a possible route for future investigations into the mechanism of energy transduction.
Keywords: bovine heart mitochondria, electron transport chain, NADH:ubiquinone oxidoreductase (complex I), Q-cycle mechanism, reductant-induced oxidation, respiratory chain
Abbreviations: complex I, NADH:ubiquinone oxidoreductase; DDM, n-dodecyl-β-D-maltopyranoside; DQ, decylubiquinone; DQH2, decylubiquinol; LSQ, least-squares error value; Q, quinone; Q2, ubiquinone-2 (ubiquinone with two isoprenoid units); Q2H2, ubiquinol-2; QH2, quinol; SMP, submitochondrial particle
INTRODUCTION
Complex I (NADH:ubiquinone oxidoreductase) is the first enzyme of the membrane-bound electron transport chain in mitochondria [1,2]. It oxidizes NADH, produced predominantly by the tricarboxylic acid cycle in the mitochondrial matrix, and reduces Q (ubiquinone) in the inner mitochondrial membrane. The QH2 (ubiquinol) is reoxidized by the cytochrome bc1 complex and the electrons are used ultimately to reduce oxygen. In addition, complex I conserves energy as a protonmotive force across the inner mitochondrial membrane, supporting ATP synthesis.
Complex I from bovine heart mitochondria has a molecular mass of approx. 1 MDa and comprises 45 different subunits [3,4]. It has an L-shaped structure, with one arm in the membrane plane and the other extending into the mitochondrial matrix (Scheme 1A) [5]. The hydrophilic arm contains the active site for NADH oxidation (containing a FMN), and eight iron–sulfur clusters, two [2Fe-2S] clusters and six [4Fe-4S] clusters [6,7]. In the bovine enzyme the hydrophilic arm contains at least 14 subunits, and seven of them are conserved throughout all known complexes I [3,4]. Recently, a structural model of the hydrophilic arm of complex I from Thermus thermophilus, containing homologues to these seven subunits, has been reported, confirming that the clusters form a chain between the FMN and the Q-binding site [6].
Scheme 1. Mechanistic models for catalysis by complex I.

(A) Schematic representation of complex I in the inner mitochondrial membrane catalysing NADH oxidation, quinone reduction and proton translocation. (B) Proposed Q-cycle mechanism of catalysis (reduction of two quinones and oxidation of one quinol for every NADH oxidized). Top: Q is reduced by one electron from the iron–sulfur chain (derived from NADH) and by one electron from quinol to form QH2 and a semiquinone (right). Bottom: a second Q is reduced to form a second QH2 and the SQ is oxidized to Q (left). Q, quinone; SQ, semiquinone; QH2, quinol.
Many varied reaction mechanisms have been proposed for proton translocation by complex I (see, for recent reviews, [8–10]). However, the structure of the hydrophilic arm [6] supports the notion that proton translocation is driven at (or close to) the point of quinone reduction. The iron–sulfur clusters are likely to act predominantly as innocent electron carriers, although the final cluster in the chain, cluster N2, is close to the putative quinone-binding site and may play a more intimate role in catalysis. Consequently, realistic mechanistic proposals for energy transduction by complex I fall into three categories: directly coupled proton translocation (as observed in cytochrome c oxidase [11]), indirectly coupled proton translocation {proton transfer is driven by (or drives) a reaction at a remote site, as in ATP synthesis [12,13]} and Q-cycle mechanisms (as in the cytochrome bc1 complex [14,15]). Here, we aim to determine whether complex I operates by a Q-cycle-type mechanism.
Various Q-cycle mechanisms have been proposed previously for catalysis by complex I [16,17]. We focus on the elegant but simple proposal of Dutton et al. [17] that the Q-cycle mechanism in complex I is the ‘mirror image’ of that established for the cytochrome bc1 complex. Because a direct analogy of the mechanism of the bc1 complex alone can account for only two of the four protons that are pumped by complex I for every NADH oxidized, an additional ‘proton-pumping’ component was incorporated into Dutton's mechanism [17]. The strategy adopted here does not address this component. A number of experimental observations are consistent with a Q-cycle in complex I, including evidence for more than one Q-binding site [18], and observations of semiquinone intermediates, at least one of which responds to the protonmotive force [19]. However, no bound cofactor has yet been identified in the membrane domain of complex I to mediate electron transfer between two Q-sites located on opposite sides of the membrane, and evidence has been presented also which challenges proposals for more than one Q-binding site [20].
Here, we describe experiments designed to test whether a Q-cycle mechanism can be detected in complex I from bovine mitochondria. The principle of our experiment is to ask whether ‘reductant-induced oxidation’ of QH2 occurs during catalysis. Thus our experiment is inspired by the transient increase in reduction of the b-haems in the cytochrome bc1 complex, observed by chance upon a pulse of oxygen to slowly respiring mitochondria [21], which led to development of the modified Q-cycle mechanism [14]. In the bc1 complex the status of the individual cofactors can be defined spectroscopically, but the poor spectroscopic signals of the cofactors in complex I (flavin, iron–sulfur clusters and quinones) preclude this option. Consequently, our experiments are aimed at detecting the oxidation of QH2, induced by the reduction of complex I by NADH.
EXPERIMENTAL
Preparation of complex I from bovine mitochondria
Mitochondria were isolated from bovine hearts and used to prepare mitochondrial membranes [22,23]. Complex I was purified as described previously [24], at 4 °C, with minor modifications. Membranes (30 ml) (protein ∼12 mg·ml−1) were solubilized with 1% DDM (n-dodecyl-β-D-maltopyranoside; Anatrace) for 30 min in the presence of 2 mM dithiothreitol (Melford Laboratories) and 0.005% PMSF (Sigma) and centrifuged (30 min, 48000 g). The supernatant was loaded on to a 70 ml Q-Sepharose column (Amersham Biosciences), equilibrated with buffer A [20 mM Tris/HCl, 2 mM EDTA, 0.1% DDM, 0.005% asolectin (Fluka, partially repurified by washing with acetone [25]) and 10% ethylene glycol, pH 8] and eluted using an NaCl gradient. Complex I-containing fractions were pooled, concentrated in a Vivaspin concentrator (100 kDa cut-off), applied to a Sephacryl S-300 gel-filtration column (Amersham Biosciences) and eluted in 20 mM sodium phosphate, 150 mM NaCl, 0.1% DDM, 10% glycerol and 0.1 mM TCEP [Tris(carboxyethyl) phosphine; Sigma] (pH 7.5). Complex I-containing fractions were pooled, concentrated and stored in liquid nitrogen.
Assays of the complex I activity
Complex I (2 μl of 10–20 mg·ml−1) was placed in the bottom of a cuvette and mixed with 40 μl of 1% asolectin [solubilized in 1% CHAPS (Calbiochem)]. Assay buffer (938 μl) (20 mM potassium phosphate, pH 7.5, at 30 °C) and 100 μM NADH (Sigma; 10 μl of a 10 mM solution) were added, and the solution was mixed and incubated at 30 °C for 2 min to remove a ‘lag phase’, attributed to a deactive form of the enzyme [26,27]. The assay was initiated by addition of 100 μM DQ (decylubiquinone) or Q2 (ubiquinone-2, ubiquinone with two isoprenoid units) (Sigma; 10 μl of a 10 mM solution in ethanol) and NADH oxidation was monitored spectrophotometrically [340–380 nm; molar absorption coefficient (ϵ)=4.8 mM−1·cm−1].
Preparation and storage of DQH2 (decylubiquinol) and Q2H2 (ubiquinol-2)
DQH2 and Q2H2 were prepared in an anaerobic glovebox (Belle Technology, O2<2 p.p.m.) [28]. Approximately 2 mg of DQ or Q2 was dissolved in 1 ml of diethyl ether and then 2 ml of sodium dithionite (2.3 mM in 1 M potassium phosphate, pH 7) was added and the mixture was shaken vigorously. The aqueous and organic phases were allowed to separate, the bottom aqueous layer was discarded, and the process repeated. The colourless organic phase was then washed twice with a saturated NaCl solution containing 10 mM HCl, and passed through a small column of anhydrous sodium sulfate. The diethyl ether was removed by evaporation and the resulting powder redissolved in ethanol containing 6 mM HCl. The final quinol concentration was determined spectrophotometrically or by HPLC analysis, which showed that typically 2–5% of the quinone remains oxidized. The quinols could be stored anaerobically in acidified ethanol at −20 °C, and HPLC analysis demonstrated less than 1% reoxidation after a week. However, after 1 h of exposure to air, 17% reoxidation was observed. Consequently, all experiments involving quinols were carried out in the anaerobic glovebox. HPLC experiments carried out at various flow rates confirmed that quinol reoxidation during the HPLC run is negligible.
Reverse-phase HPLC separation and quantification of Q and QH2 species
HPLC analysis was carried out using an Agilent 1100 series HPLC system equipped with a manual injector (Rheodyne injection valve), column thermostat (30 °C) and multiple wavelength detector, and controlled by an Agilent ChemStation. DQ, DQH2, Q2 and Q2H2 were eluted from a Nucleosil C18 column (5 μm, 25 cm×3.2 mm; Hichrom) in a mobile phase of 50 mM sodium perchlorate in 53:25:22:0.1 (by vol.) ethanol/water/methanol/70% HClO4, with detection at 278 and 290 nm (adapted from a published protocol [29]). All solvents were HPLC grade (Sigma) and water was from a MilliQ purification system. The four Q species were separated at 0.4 ml·min−1 during a run time of 40 min, and eluted at ∼8.2 min (Q2H2), ∼12.0 min (Q2), ∼14.5 min (DQH2) and ∼23.0 min (DQ). The molar absorption coefficients are discussed below and reported in Table 1. Standard solutions were prepared in the HPLC mobile phase at concentrations between 0 and 100 μM.
Table 1. Molar absorption coefficients for the two quinone and quinol species.
Molar absorption coefficients for DQ and Q2 were determined in ethanol and in the HPLC mobile phase, and the values determined in ethanol are consistent with values reported previously (enclosed in {}). Molar absorption coefficients for DQH2 and Q2H2 were determined in the HPLC mobile phase only. The value for DQH2 matches previously reported values in ethanol but the value for Q2H2 does not. The error values reported are 95% confidence intervals.
| ϵ in ethanol (mM−1·cm−1) | ϵ in mobile phase (mM−1·cm−1) | |||
|---|---|---|---|---|
| 278 nm | 290 nm | 278 nm | 290 nm | |
| DQ | 16.17±1.16 | 9.09±0.54 | 16.63±1.09 | 11.55±0.71 |
| {14 [28,31]; 16 [37]; 14.5 [33]} | ||||
| Q2 | 12.97±1.37 | 5.87±0.95 | 12.75±0.22 | 6.68±0.34 |
| {13.7 (275 nm) [31]; 14.5 [33]} | ||||
| DQH2 | − | {3.9–4 [28,38]} | 3.08±0.43 | 4.10±0.51 |
| Q2H2 | {16 (methanol) [39]} | − | 2.65±0.08 | 3.22±0.32 |
Preparation of samples for HPLC analysis
Complex I (24 μl of 10–20 mg·ml−1) was placed in the bottom of a glass vial and mixed with either 30 μl of 1% bovine heart polar phospholipids (Avanti Polar Lipids) or 45 μl of 1% asolectin (solubilized in 2 or 1% CHAPS respectively). Approximately 2850 μl (calculated for a final volume of 3 ml) of 10 mM Hepes buffer (pD 7.5 in 2H2O, 30 °C) and 100 μM NADH (30 μl from a 10 mM stock solution) were added, and the solution was mixed and incubated for 2 min while stirring slowly. The reaction was initiated by addition of the appropriate Q species to a final concentration of approx. 100 μM (60 μl of a 50× concentrated stock solution in acidified ethanol). Aliquots of 100 μl were removed at set time points and added to 300 μl of quenching solution [53:22 (v/v) ethanol/methanol], allowing analysis by HPLC without further manipulation. HPLC analysis confirmed that this procedure quenched all reactions efficiently. The samples were sealed anaerobically, frozen and stored in liquid nitrogen. For analysis, they were removed one at a time from the liquid nitrogen, thawed, filtered using a 0.2 μm filter (Sartorius Minisart RC 4) and loaded into the injection syringe (all procedures in the glove box) and then injected quickly on to the HPLC column. The NADH concentration of each aliquot was determined by UV–visible spectroscopy (340 nm, ϵ=6.37 cm−1·mM−1 in this solvent mixture).
Data modelling calculations
Data sets from HPLC analysis were fit by minimizing the LSQ (least-squares error value) between calculated curves and experiental data sets. The initial concentration of each Q species was allowed to vary within a small range to account for experimental error, and rate constants were defined by calculating curves for a wide range of possible values, then refining the best fit values. Analytical solutions describing concentration as a function of time were used when possible. Otherwise, digital step calculations were used. Digital simulations use rate equations to calculate small changes in concentration which occur upon small steps in time – when decreasing the step size does not alter the results the simulation has converged to the analogue solution.
RESULTS AND DISCUSSION
Experimental strategy
Scheme 1(A) depicts complex I in the inner mitochondrial membrane, catalysing the oxidation of NADH coupled with the reduction of Q and to proton translocation. The mechanism of proton translocation is not defined. Scheme 1(B) illustrates one possible mechanism: complex I catalysing by a modified Q-cycle mechanism analogous to that employed by the cytochrome bc1 complex [17]. Quinone (Q) binds at the matrix side of the membrane and is reduced by two electrons, one from the iron–sulfur clusters (derived from NADH) and the other from a quinol (QH2) bound on the outside membrane face. This step is the reverse of the bifurcation reaction in the bc1 complex [14,15] and it leads to a bound semiquinone on the outside face, which is oxidized completely upon reduction of a second quinone. Thus oxidation of one NADH is coupled with the reduction of two quinones and to the oxidation of one quinol, with spatial separation of the redox processes providing net proton translocation. The experimental strategy applied here is to provide complex I with different (distinguishable) species of Q and QH2 and to ask whether any QH2 is oxidized during catalysis (see Figure 1). Directly or indirectly (conformationally) coupled mechanisms of proton translocation should not lead to ‘reductant-induced oxidation’ (Figure 1A), whereas a Q-cycle mechanism should result in the oxidation of one QH2 for every NADH oxidized (Figure 1B).
Figure 1. Experimental strategy aimed at detecting a Q-cycle in complex I.

(A) Complex I catalyses the simple reduction of quinone (Q) to quinol (QH2), so that a different species of quinol (Q*H2) is unaffected and remains reduced throughout. (B). Complex I catalyses a Q-cycle reaction (two quinones reduced and one quinol oxidized for every NADH oxidized), so that at the start of the reaction the oxidation of Q*H2 to Q* is observed. As the reaction progresses both Q* and Q are reduced to their corresponding quinols completely. Thus detection of Q* is indicative of ‘reductant-induced oxidation’ and indicative of a Q-cycle mechanism. +, Concentration of NADH.
Key requirements for the success of our strategy are: (i) the availability of two quinone species with similar physical and catalytic properties; (ii) a method of accurately quantifying the four quinone/ol species present; and (iii) the absence of significant alternative routes for the oxidation of QH2. DQ and Q2 both contain 10-carbon side chains and have similar physical properties [30,31]. The reactions of both of them with complex I have been studied [31–36], and the general picture is that they are both reduced by complex I in an inhibitor-sensitive manner and their reduction is coupled with proton translocation. However, differences in their catalytic properties have been observed, notably Q2 supports a lower rate of turnover than DQ [31,33,35], and Q2 shows a greater tendency than DQ to react at the ‘inhibitor-insensitive site’ on complex I, commensurate with its higher hydrophilicity [33]. Here, we have taken these differences into account by, first, quantifying the behaviour of both quinones under the conditions used here (Scheme 2A), and secondly, by carrying out all experiments in duplicate (interchanging the identities of each of the quinone/quinol species) to balance out any variations. Importantly, both oxidation states of DQ and Q2 are readily distinguished and quantified by HPLC analysis (see below). The main obstacle to our strategy was found to be the ‘self-exchange reaction’ between Q and QH2 (Scheme 2B) [28], which exchanges the redox states of the two species and provides an alternative route for QH2 oxidation. This reaction precluded an end-point or ‘pulse’ approach (taking catalytic turnover to completion with varying amounts of NADH), and required catalysis to be analysed during an experimental time course. However, the exchange reaction could be quantified accurately according to a simple bimolecular reaction (Scheme 2B); thus, providing that its rate is not prohibitively high, it can be readily factored into simulations of experimental data.
Scheme 2. Reaction schemes corresponding to the equations presented in Table 3.

(A) Reduction of a single quinone species (reaction rate determined by the reduction of Q, not the oxidation of NADH), inhibited competitively by quinol. (B) The quinone:quinol self-exchange reaction. (C) The inhibitor-insensitive reduction of Q by complex I. (D) The reaction scheme in (A) expanded to describe the reduction of both DQ and Q2, inhibited by both DQH2 and Q2H2.
Quantification of DQ, Q2, DQH2 and Q2H2 by HPLC
The reverse-phase HPLC method was capable of separating and quantifying all four species in a single experiment (see Figure 2). For each species, peak area was directly proportional to the concentration loaded on to the column and determinations of the concentration of an unknown sample were reproducible (multiple injections gave values that differed by less than 1%), with a limit of quantification of approx. 1 μM.
Figure 2. HPLC analysis of a mixture of the four quinone species.

A mixture (20 μl) containing DQ (2.2 μM), DQH2 (4.1 μM), Q2 (3.2 μM) and Q2H2 (5.8 μM) was loaded on to a Nucleosil C18 column and eluted using a mobile phase of 50 mM sodium perchlorate in 53:25:22:0.1 (by vol.) ethanol/water/methanol/70% HClO4 (0.4 ml·min−1), and monitored at 290 nm [reported in mAU (milli-absorption units)]. The four species elute at approx. 8.2 min (Q2H2), 12.0 min (Q2), 14.5 min (DQH2) and 23.0 min (DQ).
Accurate values of molar absorption coefficients in the HPLC mobile phase and in ethanol were determined as follows. The UV–visible spectra of stock solutions of DQ and Q2 were recorded over a range of dilutions. Then, complex I was used to catalyse the reaction between NADH (0–100 μM) and different estimated concentrations of DQ or Q2 (0–100 μM) under standard assay conditions. The reaction was incubated until no further NADH oxidation was observed (∼10 min), and the total amount of NADH oxidized was calculated. HPLC analysis confirmed that when [NADH]>[Q] only negligible quinone remained (<2 μM). The amount of DQ or Q2 present in the stock solution was calculated and the molar absorption coefficient determined. Each determination was carried out at least three times, and the values found agree well with published values [28,31,33,37] (see Table 1). Corresponding values for the quinols were calculated by an analogous method: upon reaction with NADH the decrease in quinone concentration is equal to the increase in quinol concentration, so that comparison of the HPLC peak areas from sets of experiments from the same stock solution defined the ratio of the molar absorption coefficients (see Table 1). Comparison with previously reported values shows good agreement for DQH2 [28,38] but significant discrepancy with the single reported value for Q2H2 [39]. However, this published value is not consistent with reported values from other quinols. All data reported below have been calculated using the molar absorption coefficients determined as described above.
Development of a protocol for preparing samples for HPLC analysis
The quinone–quinol self-exchange reaction (Scheme 2B) is slow relative to enzyme turnover, but fast enough to perturb the reaction mixture significantly after a 10 min incubation. Because it occurs in water, but not significantly in ethanol or methanol, a range of conditions was investigated in an attempt to minimize its rate. A mixture of Q2 and DQH2 was incubated for 10 min at 30 °C in various test solutions and then evaluated by HPLC. Exchange is slower at lower pH (6.0<7.5<9.0, consistent with results described previously for plastoquinol-1 and ubiquinone-1 [28]), slower in 2H2O than in H2O (at equivalent pL), and accelerated by phospholipids. Different types and amounts of detergent, ethylene glycol, the ionic strength [28] and the order in which the different reagents (buffer, phospholipid and quinones) were added exerted no significant effect. However, the relative rates (exchange versus catalysis) are most important here, and catalysis is retarded significantly in the absence of phospholipids [24], and at pH 6.0 or 9.0 relative to 7.5, whereas exchanging H2O for 2H2O had little effect. Therefore the chosen conditions were 0.1 mg·ml−1 of bovine heart phospholipids or 0.15 mg·ml−1 asolectin (decreased below the optimal ‘catalytic’ level to minimize the exchange reaction), in 2H2O, at pD 7.5 and 30 °C. The enzyme was incubated for 2 min in the presence of 100 μM NADH before the reaction was initiated with the Q/QH2 mixture. Finally, quenching the reaction with a 3-fold excess of ethanol/methanol (53:22) rapidly stopped both catalysis and exchange and allowed storage and anaerobic freeze–thawing without alteration in composition. In addition, the quenched mixture could be injected directly on to the HPLC column, and NADH in the solution was stable, allowing its analysis by UV-visible spectroscopy.
The reduction of DQ and Q2 by NADH and validation of the experimental approach
In catalytic activity assays, variation in the initial rate of NADH oxidation as a function of the concentrations of DQ and Q2 defines apparent values for Km and kcat (in applying the Michaelis–Menten equation no assumption about the actual mechanism is intended). Values of Km and kcat derived here are reported in Table 2 and compared with published values. First, the Km values are significantly higher than values derived using SMPs (submitochondrial particles) [31,40], but not necessarily higher than the values of Hano et al. [35] derived using isolated complex I. Km is known to depend strongly on the hydrophobic phase volume [31], as the concentration of quinone in the hydrophobic phase is much higher than the average concentration in the cuvette. Previously, Fato et al. [31] calculated ‘true’ Km values of 120–138 mM for DQ and 11.5–36 mM for Q2, the Km for endogenous Q10 is in the millimolar range in membrane lipids [41], and values recorded here varied according to phospholipid concentration. Thus the smaller values determined using SMPs probably correspond to small hydrophobic phase volumes. Secondly, kcat values of 3.1 μmol·min−1·mg−1 (DQ) and 1.8 μmol·min−1·mg−1 (Q2) were typical under the conditions employed in generating samples for HPLC analysis, although, as expected, they are slightly lower than corresponding values recorded previously [24] because of the decreased phospholipid concentration in the assay buffer. As expected, kcat is smaller for Q2 than for DQ, and although the absolute rates differ between preparations, good agreement in kcat(DQ)/kcat(Q2) is found throughout Table 2. All catalytic rates described here are >90% sensitive to inhibition by rotenone or piericidin A (the sensitivity of DQ is higher than that of Q2, as described previously [33]).
Table 2. Values for Km, kcat and Ki for DQ, Q2, DQH2 and Q2H2 determined in the present study and compared with values reported previously.
Error values are 95% confidence intervals. CI, complex I.
| DQ Km (μM) | DQH2Ki (μM) | Q2Km (μM) | Q2H2Ki (μM) | DQ kcat (μmol·min−1·mg−1) | Q2kcat (μmol·min−1·mg−1) | kcat(DQ)/kcat(Q2) | Conditions | Reference |
|---|---|---|---|---|---|---|---|---|
| 24.0±7.5 | 26.0±10 | 20.4±3.9 | 15.3±4.4 | 3.1±1.2 | 1.8±1.0 | 2.5±0.8 | Isolated CI (pH 7.5), 100 μM NADH | This work |
| 86 | − | 5 | − | 1.85 | 0.55 | 3.4 | Isolated CI (pH 8.0), 5 μM NADH | [35] |
| 6 | − | 2 | − | 0.45* | 0.21* | 2.1 | SMPs (pH 7.4), 50 μM NADH | [40] |
| 1.8 | − | 1.3 | − | 0.58±0.15* | 0.29* | 2.0 | SMPs, 75 μM NADH | [31,34] |
*Value reported per mg of total protein.
In significant quinol concentrations, the characteristics of product inhibition should also be defined. Product inhibition in complex I is poorly understood. Ohshima et al. [40] suggested that quinols are competitive inhibitors and showed that 40 μM Q2H2 was sufficient to inhibit Q1 reduction in SMPs completely. However, for other combinations of Q and QH2 only 40% inhibition could be attained, incompatible with a simple competitive inhibition model. Later, Nakashima et al. [42] suggested that Q1H2 is a competitive inhibitor of Q1 reduction, but no kinetic parameters were reported. In fact, it would be surprising if quinol inhibition did conform to any simple pattern. For example, the relative binding affinities of Q and QH2 are likely to depend on the oxidation states of the enzyme's redox cofactors and so to depend on the relative rates of NADH oxidation and Q reduction – and complex I may adopt multiple conformations during the proton pumping cycle also. In addition, appropriate experiments are technically difficult (for example, quinols are sensitive to O2) and difficult to interpret (for example, because of differences in the solubility and partition coefficients of the reactant and product species). In the experiments described here we found that a naïve competitive inhibition model (Scheme 2A) was able to reproduce measured data satisfactorily, although it is unlikely to reflect the actual mechanism. Thus sets of ten assay traces, covering a range of initial DQ and DQH2 (or Q2 and Q2H2) concentrations, were recorded and modelled according to Scheme 2(A), using the corresponding equation in Table 3 and the Km values in Table 2. Then, effective values for Ki(DQH2) and Ki(Q2H2) were estimated by optimizing the fit between the model and the results (Table 2).
Table 3. Rate equations describing the four reactions shown in Scheme 2.
x is the amount of the starting material that has reacted to form products after time t and [A]0 is the concentration of species A at time zero. In (D), only the rate equation for the decrease in DQ at constant Q2 concentration is given; an analogous equation is readily derived for Q2.
| Rate equation | Integrated rate equation | |||
|---|---|---|---|---|
| A. Catalysis: single Q with product inhibition |
|
|
||
|
||||
|
||||
| B. Exchange reaction |
|
|
||
| ∑Q is the sum of the concentrations of all the Q and QH2 species. | ||||
| C. Inhibitor-insensitive reaction |
|
|
||
| D. Catalysis: two Qs with product inhibition |
|
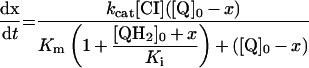
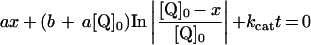

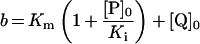

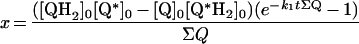
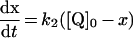
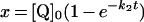
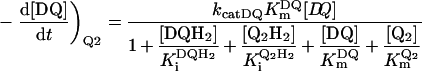
Figure 3 shows how the reduction of a single quinone species (DQ or Q2), by complex I and NADH, could be monitored accurately using HPLC and modelled using Scheme 2(A) and the values reported in Table 2. In Scheme 2(A), the rate is controlled completely by quinone reduction, not NADH oxidation, because NADH:ferricyanide or hexaammine ruthenium oxidoreduction by complex I is significantly faster than NADH:ubiquinone oxidoreduction [26,43,44], showing that NADH oxidation is not rate-limiting. Figure 3 validates Scheme 2(A) and our experimental approach because: (i) the total amount of quinone species (Q+QH2) calculated using the molar absorption coefficients reported in Table 1 remains constant throughout; (ii) the decrease in NADH concentration matches the decrease in the quinone concentration and the increase in the quinol concentration; and (iii) agreement between the experimentally recorded data and the model is excellent, and the errors in each data point are small.
Figure 3. The reduction of DQ and Q2 by NADH, catalysed by complex I.

The reaction was initiated by the addition of approx. 100 μM DQ or Q2 to the assay buffer containing NADH, complex I and asolectin phospholipids, and monitored by HPLC analysis (◆, DQ; ■, Q2; ◇, DQH2; □, Q2H2) and UV–visible spectroscopy (+,NADH). (A) Conversion of DQ into DQH2 modelled using Km=24 μM, Ki=26 μM and kcat=3.0 mol−1·dm3·s−1. (B) Conversion of Q2 into Q2H2 modelled using Km=20.4 μM, Ki=15.7 μM and kcat=1.2 mol−1·dm3·s−1.
Quantitative characterization of the exchange reaction
Figure 4 shows data from HPLC analysis of the exchange reaction. In all cases the total amounts of each species {DQ+DQH2} and {Q2+Q2H2}, and of each oxidation state {DQ+Q2} and {DQH2+Q2H2} remain constant throughout. Scheme 2(B) shows the reaction mechanism used to model the data, a bimolecular reaction between quinol and quinone, where k1 refers to both the forward and backward reactions [28]. Figure 4 shows clearly that the equation derived from Scheme 2(B) (see Table 3) describes the experimental data accurately. Only slight improvements (typically the LSQ value decreases by ∼5%) resulted from letting the forward and backward rate constants differ. The measured exchange rate constants are summarized in Table 4, demonstrating that the rate constant does not depend on the combination of quinones used (rows 1 and 2 versus 3 and 4) or on the presence of NADH, complex I, or inhibitor alone (rows 1–4), but that it is larger in the presence of bovine phospholipids than asolectin phospholipids (rows 1 and 3 versus 2 and 4).
Figure 4. The self-exchange reaction of Q and QH2.

Different species of Q and QH2 were incubated together in the assay buffer at 30 °C, and their self-exchange reaction was monitored over time by HPLC analysis (◆, DQ; ■, Q2; ◇, DQH2; □, Q2H2). (A) DQ and Q2H2 incubated in the presence of complex I and bovine heart phospholipids, modelled using k1=15 mol−1·dm3·s−1. (B) DQ and Q2H2 incubated in the presence of NADH and asolectin, modelled using k1=7 mol−1·dm3·s−1. (C) DQH2 and Q2 incubated in the presence of complex I and asolectin, modelled using k1=8 mol−1·dm3·s−1.
Table 4. Rate constants for the self-exchange reaction measured under different control conditions.
In data rows 1–4, there was no significant difference in the measured rate constants if the reaction was carried out in the absence of NADH or complex I (CI), or if an inhibitor was added (2.3 μM rotenone or 0.25 μM piericidin A). The rate constants for the reactions between DQ and Q2H2 and DQH2 and Q2 do not differ significantly, but the exchange reaction is faster in bovine phospholipids than in asolectin. In data rows 5–8, all the components of the assay are present and complex I is inhibited by either rotenone (2.3 or 11.5 μM) or piericidin A (0.25 or 1.25 μM). The rate constant does not depend on which inhibitor is present, on which combination of quinones is investigated, or on whether the reaction is carried out in bovine phospholipids or asolectin. All values are reported±their 95% confidence interval.
| Quinone species | Phospholipid | Control condition | Rate constant (mol−1·dm3·s−1) |
|---|---|---|---|
| DQ+Q2H2 | Bovine | −NADH or −CI | 14.4±4.6 |
| ±inhibitor | |||
| DQ+Q2H2 | Asolectin | −NADH or −CI | 8.9±2.6 |
| ±inhibitor | |||
| Q2+DQH2 | Bovine | −NADH or −CI | 18.3±7.3 |
| ± inhibitor | |||
| Q2+DQH2 | Asolectin | −NADH or −CI | 9.1±3.0 |
| ±inhibitor | |||
| DQ+Q2H2 or Q2+DQH2 | Bovine | +NADH+CI | 68.0±35.4 |
| +rotenone or piericidin A | |||
| DQ+Q2H2 or Q2+DQH2 | Asolectin | +NADH+CI | 76.5±15.7 |
| +rotenone or piericidin A | |||
| DQ+Q2H2 or Q2+DQH2 | Bovine or | +NADH+CI | 74.8±23.2 |
| asolectin | +rotenone | ||
| DQ+Q2H2 or Q2+DQH2 | Bovine or | +NADH+CI | 72.3±19.6 |
| asolectin | +piericidin A |
Reactions to quantify the self-exchange reaction were also carried out in the presence of all the components of the assay (buffer, phospholipids, complex I, NADH, Q and QH2) but with a complex I inhibitor (rotenone or piericidin A) present (see Figure 5). Complex I is thought to reduce quinone at two different sites: the ‘inhibitor-sensitive site’ is associated with hydrophobic quinone substrates and proton translocation, while the ‘inhibitor-insensitive site’ accepts more hydrophilic substrates and is decoupled from the protonmotive force [33,45–47]. The two substrates used here, DQ and Q2, display a small component of inhibitor-insensitive activity, so that the inhibited enzyme exhibits a low rate of Q reduction. Quinone substrates with higher hydrophobicity (to increase the inhibitor-sensitivity) are precluded by their insolubility in aqueous buffers [31–34]. Figure 5 shows three typical data sets, and the data fits obtained using Scheme 2(B) in conjunction with Scheme 2(C) to describe the inhibitor-insensitive reduction (see Table 3). The agreement between the data and the model is excellent, and Table 4 includes the rate constants derived for the exchange reaction. Unexpectedly, the exchange reaction is accelerated significantly in the presence of inhibited complex I (all the substrates are present and turnover is actively inhibited). Because the inhibitor-insensitive reaction is not associated with proton translocation [33] the increased exchange rate is unlikely to be associated with energy transduction. Possible explanations are discussed below.
Figure 5. The self-exchange reaction of Q and QH2 in the presence of inhibited complex I.

Different species of Q and QH2 were incubated together in the assay buffer at 30 °C, in the presence of complex I, phospholipids, NADH and either rotenone or piericidin A, and their self-exchange reaction was monitored over time by HPLC analysis (◆, DQ; ■, Q2; ◇, DQH2; □, Q2H2). (A) DQ and Q2H2 in the presence of complex I inhibited by piericidin A (bovine phospholipids) modelled using k1=52 mol−1·dm3·s−1 (inhibitor-insensitive catalysis, k2=17 mol−1·dm3·s−1). (B) DQH2 and Q2 incubated in the presence of complex I inhibited by rotenone (asolectin) modelled using k1=65 mol−1·dm3·s−1 (inhibitor-insensitive catalysis, k2=44 mol−1·dm3·s−1). (C) DQH2 and Q2 incubated in the presence of complex I inhibited by piericidin A (asolectin) modelled using k1=77 mol−1·dm3·s−1 (inhibitor-insensitive catalysis, k2=33 mol−1·dm3·s−1).
Catalysis of NADH:ubiquinone oxidoreduction in the presence of QH2
Figure 6 shows two data sets from the complex I-catalysed reduction of either DQ or Q2, in the presence of Q2H2 or DQH2 respectively. In each case the total amount of each Q-species remains constant throughout the assay, and the decrease in the total quinone concentration is equal to the increase in the total quinol concentration and to the decrease in the concentration of NADH. Therefore both data sets are internally consistent. At first sight it is obvious that Figure 6 resembles Figure 1(B), rather than Figure 1(A), indicating the operation of a Q-cycle mechanism. However, as described below, the transient quinol oxidation may be explained quantitatively by a combination of the model of Figure 1(A) with the known rate of the self-exchange reaction. Consequently, our experiments do not provide any evidence for the operation of a Q-cycle mechanism in complex I.
Figure 6. The reduction of a quinone by complex I, in the presence of a different species of quinol.

The quinone and quinol [DQ and Q2H2 (A) or Q2 and DQH2 (B)] were added to an assay buffer at 30 °C, containing complex I, phospholipids (asolectin) and NADH, and the reaction was monitored over time by HPLC analysis (◆, DQ; ■, Q2; ◇, DQH2; □, Q2H2) and UV–visible spectroscopy (‘+’ indicates NADH). The points belonging to different data sets are joined for simplicity (the lines are not from data modelling).
It is immediately apparent, from the relative rates of NADH oxidation and quinone reduction, that Q2H2 slows the reduction of DQ severely, and that DQH2 slows the reduction of Q2 also. The relative effects of Q2H2 and DQH2 in this ‘cross-over’ re-action were confirmed in solution assays, but are only qualitatively consistent with the values of Km, kcat and Ki reported in Table 2 (calculated according to Scheme 2D and the corresponding equations in Table 3). It is likely that Scheme 2(D) is not a sufficient (or correct) description of the mechanism. Consequently, instead of attempting to apply Scheme 2(D) to the data shown in Figure 6, a pragmatic approach (avoiding any definition of the characteristics of product inhibition) was adopted as follows. The NADH concentration, at a given time, defines the total amount of quinone that has been reduced. Thus changes in the individual quinone and quinol concentrations can be estimated from the amount of NADH oxidized, provided that the ‘preference’ of the enzyme to react with either DQ or Q2 is known. First, calculations using Scheme 2(D) and the Km and kcat values given in Table 2 suggest that complex I should display a slight preference for DQ. For example, in the presence of 50 μM DQ and 50 μM Q2, DQ reduction is expected to account for 59% (not 50%) of the overall reduction rate. DQ (50 μM) and 50 μM Q2 is the point (in a total concentration of 100 μM Q) at which complex I is predicted to deviate most from a ‘chance encounter’ model, in which the enzyme reacts simply according to the concentration of the different species that are present (for example, in 70 μM DQ and 30 μM Q2, DQ reduction would account for 70% of the overall rate). Subsequently, experiments employing HPLC to analyse a range of DQ and Q2 concentrations suggested that the chance encounter model actually provides an accurate picture, with very little deviation found in any case [the ratio of (DQ reduced/total reduction) to (DQ concentration/total concentration) varied only from 0.95 to 1.05]. Therefore the simple chance encounter model was applied to model the data presented in Figure 6. Future investigations, using a wider range of quinones, may help to define whether the chance encounter model reflects the catalytic mechanism, or whether its accuracy, in this case, results simply from the similarity in the apparent Km and kcat values (Table 2).
Figure 7 shows that excellent agreement with the experimental data is obtained by using the chance encounter model in combination with measured changes in NADH concentration. The fits in Figure 7 rely on only a single variable, the exchange rate constant (k1 in Table 3), and derived values from different data sets lie between 40 and 75 mol−1·dm3·s−1. Thus the data reported in Figure 7 can be explained without using a Q-cycle mechanism, and by using an exchange rate constant equivalent to values measured in the presence of inhibited complex I (see Table 4). Clearly, this is evidence against the operation of a Q-cycle mechanism. However, the exchange rate constants required to fit the data are those from the inhibited enzyme (complex I+NADH+inhibitor), and they are significantly larger than equivalent values from complex I alone, NADH alone, or complex I+inhibitor in the absence of NADH. Two features are common to the inhibited complex I and to complex I during turnover. (i) The flavin and the iron–sulfur clusters are reduced in each case (NADH oxidation is much faster than Q reduction during catalysis). (ii) The slow, inhibitor-insensitive reaction occurs in both cases. If the reduced, inhibited enzyme facilitates the self-exchange reaction, then it may reflect the existence of an alternative conformation, or a state in which the environment of one or more redox-active centres is altered. However, it is perhaps more likely that the inhibitor-insensitive reaction increases exchange via the formation of semiquinone intermediates. Interestingly, redox equilibration between duroquinol and Q2 has been reported to be catalysed by the cytochrome bc1 complex also [48]. The reaction proceeds by reduction of cofactors in the enzyme by duroquinol, followed by the reduction of Q2 to Q2H2. However, it is unlikely that complex I catalyses the reaction by this mechanism as the oxidized enzyme does not increase the exchange rate, and because Q2H2 and DQH2 have much higher potentials than any of the known complex I cofactors. As expected, no evidence for any reduced iron–sulfur clusters was observed by EPR when DQH2 or Q2H2 was used to attempt to reduce complex I, irrespective of whether an inhibitor was present or not.
Figure 7. The reduction of a quinone by complex I, in the presence of a different species of quinol, modelled using the change in NADH concentration.

The quinone and quinol [DQ and Q2H2 (A) or Q2 and DQH2 (B)] were added to an assay buffer at 30 °C, containing complex I, phospholipids (asolectin) and NADH, and the reaction was monitored over time by HPLC analysis (◆, DQ; ■, Q2; ◇, DQH2; □, Q2H2; data reproduced from Figure 6). The modelled values were calculated using the change in NADH concentration (smoothed data derived from that shown in Figure 6) and the ‘chance encounter’ model (see text) with self-exchange rate constants of 44 mol−1·dm3·s−1 (A) and 75 mol−1·dm3·s−1 (B).
Finally, note that the experimental data can also be fit reasonably well by using an analogous approach, but with a mechanism that comprises the reaction of two quinones and one quinol, again using a chance-encounter model. However, the fits are compromised because data sets acquired using DQ and Q2H2 can be fit well only if the rate of exchange is zero (with the best fits using slightly negative values) and because those acquired using Q2 and DQH2 show systematic errors with LSQ values several times higher than provided by the simple model. Consequently, although our data do not support a Q-cycle mechanism in complex I, we must accept that the increased rate of the exchange reaction observed during turnover and with the inhibited enzyme (observations that are worthy of future investigation) compromises the certainty of our conclusion.
Implications for the mechanism of complex I
The experiments described here provide no support for the operation of a Q-cycle mechanism in complex I, and all data can be explained accurately by the ‘simple’ reduction of Q to QH2. However, our data do not exclude a Q-cycle mechanism unambiguously. First, the increased rate of Q/QH2 exchange, catalysed by the inhibited enzyme and proposed to occur also during turnover, remains unexplained and is worthy of future consideration. We believe that it does not indicate a Q-cycle mechanism because ‘inhibitor-insensitive’ catalysis is not coupled with the protonmotive force. Secondly, we cannot exclude the possibility that Q, generated from QH2, is retained in the vicinity of the ‘reducing’ active site, promoting its immediate re-reduction and so precluding its detection. Most simply, Q could be released from the enzyme at a point that is close to the entry to the Q-binding site (at present no information on the spatial arrangement of the Q-binding sites in complex I exists). An additional possibility is that Q is retained in the enzyme and ‘switched’ internally to the second active site, requiring controlled directional uptake and release of protons from a single large site to alternate sides of the membrane. A semiquinone ‘switch’ mechanism has been proposed previously, conforming to this suggestion [49]. Finally, if complex I does not catalyse by a Q-cycle-type mechanism, then it is likely to translocate protons either by direct coupling at cluster N2 or at the site of quinone reduction, or to use a conformational change mechanism (see, for recent reviews, [8–10]). Clearly, determination of the mechanism of energy transduction by this complicated enzyme will require new structural information and creative approaches to functional studies of catalysis.
Acknowledgments
This work was supported by The Medical Research Council. We thank Dr R. J. Shannon (MRC) for advice on HPLC analysis.
References
- 1.Schultz B. E., Chan S. I. Structures and proton-pumping strategies of mitochondrial respiratory enzymes. Annu. Rev. Biophys. Biomol. Struct. 2001;30:23–65. doi: 10.1146/annurev.biophys.30.1.23. [DOI] [PubMed] [Google Scholar]
- 2.Saraste M. Oxidative phosphorylation at the fin de siècle. Science. 1999;283:1488–1493. doi: 10.1126/science.283.5407.1488. [DOI] [PubMed] [Google Scholar]
- 3.Hirst J., Carroll J., Fearnley I. M., Shannon R. J., Walker J. E. The nuclear encoded subunits of complex I from bovine heart mitochondria. Biochim. Biophys. Acta. 2003;1604:135–150. doi: 10.1016/s0005-2728(03)00059-8. [DOI] [PubMed] [Google Scholar]
- 4.Walker J. E. The NADH-ubiquinone oxidoreductase (complex I) of respiratory chains. Q. Rev. Biophys. 1992;25:253–324. doi: 10.1017/s003358350000425x. [DOI] [PubMed] [Google Scholar]
- 5.Hofhaus G., Weiss H., Leonard K. Electron-microscopic analysis of the peripheral and membrane parts of mitochondrial NADH dehydrogenase (complex I) J. Mol. Biol. 1991;221:1027–1043. doi: 10.1016/0022-2836(91)80190-6. [DOI] [PubMed] [Google Scholar]
- 6.Sazanov L. A., Hinchliffe P. Structure of the hydrophilic domain of respiratory complex I from Thermus thermophilus. Science. 2006;311:1430–1436. doi: 10.1126/science.1123809. [DOI] [PubMed] [Google Scholar]
- 7.Ohnishi T. Iron–sulphur clusters/semiquinones in complex I. Biochim. Biophys. Acta. 1998;1364:186–206. doi: 10.1016/s0005-2728(98)00027-9. [DOI] [PubMed] [Google Scholar]
- 8.Brandt U., Kerscher S., Dröse S., Zwicker K., Zickermann V. Proton pumping by NADH:ubiquinone oxidoreductase. A redox driven conformational change mechanism? FEBS Lett. 2003;545:9–17. doi: 10.1016/s0014-5793(03)00387-9. [DOI] [PubMed] [Google Scholar]
- 9.Hirst J. Energy transduction by respiratory complex I – an evaluation of current knowledge. Biochem. Soc. Trans. 2005;33:525–529. doi: 10.1042/BST0330525. [DOI] [PubMed] [Google Scholar]
- 10.Yagi T., Matsuno-Yagi A. The proton-translocating NADH-quinone oxidoreductase in the respiratory chain: the secret unlocked. Biochemistry. 2003;42:2266–2274. doi: 10.1021/bi027158b. [DOI] [PubMed] [Google Scholar]
- 11.Belevich I., Verkhovsky M. I., Wikström M. Proton-coupled electron transfer drives the proton pump of cytochrome c oxidase. Nature. 2006;440:829–832. doi: 10.1038/nature04619. [DOI] [PubMed] [Google Scholar]
- 12.Stock D., Gibbons C., Arechaga I., Leslie A. G. W., Walker J. E. The rotary mechanism of ATP synthase. Curr. Opin. Struct. Biol. 2000;10:672–679. doi: 10.1016/s0959-440x(00)00147-0. [DOI] [PubMed] [Google Scholar]
- 13.Toyoshima C., Nomura H., Sugita Y. Structural basis of ion pumping by Ca2+-ATPase of sarcoplasmic reticulum. FEBS Lett. 2003;555:106–110. doi: 10.1016/s0014-5793(03)01086-x. [DOI] [PubMed] [Google Scholar]
- 14.Trumpower B. L. The protonmotive Q cycle. J. Biol. Chem. 1990;265:11409–11412. [PubMed] [Google Scholar]
- 15.Berry E. A., Guergova-Kuras M., Huang L.-S., Crofts A. R. Structure and function of cytochrome bc complexes. Annu. Rev. Biochem. 2000;69:1005–1075. doi: 10.1146/annurev.biochem.69.1.1005. [DOI] [PubMed] [Google Scholar]
- 16.Brandt U. Proton-translocation by membrane-bound NADH:ubiquinone-oxidoreductase (complex I) through redox-gated ligand conduction. Biochim. Biophys. Acta. 1997;1318:79–91. doi: 10.1016/s0005-2728(96)00141-7. [DOI] [PubMed] [Google Scholar]
- 17.Dutton P. L., Moser C. C., Sled V. D., Daldal F., Ohnishi T. A reductant-induced oxidation mechanism for complex I. Biochim. Biophys. Acta. 1998;1364:245–257. doi: 10.1016/s0005-2728(98)00031-0. [DOI] [PubMed] [Google Scholar]
- 18.Esposti M. D. Inhibitors of NADH-ubiquinone reductase: an overview. Biochim. Biophys. Acta. 1998;1364:222–235. doi: 10.1016/s0005-2728(98)00029-2. [DOI] [PubMed] [Google Scholar]
- 19.Magnitsky S., Toulokhonova L., Yano T., Sled V. D., Hägerhall C., Grivennikova V. G., Burbaev D. S., Vinogradov A. D., Ohnishi T. EPR characterisation of ubisemiquinones and iron–sulphur cluster N2, central components of the energy coupling in the NADH-ubiquinone oxidoreductase (complex I) in situ. J. Bioenerg. Biomembr. 2002;34:193–208. doi: 10.1023/a:1016083419979. [DOI] [PubMed] [Google Scholar]
- 20.Okun J. G., Lümmen P., Brandt U. Three classes of inhibitors share a common binding domain in mitochondrial complex I (NADH:ubiquinone oxidoreductase) J. Biol. Chem. 1999;274:2625–2630. doi: 10.1074/jbc.274.5.2625. [DOI] [PubMed] [Google Scholar]
- 21.Chance B. Coupling between cytochromes c1, bT and bK. In: Ernster L., Estabrook R. W., Slater E. C., editors. Dynamics of Energy Transducing Membranes. Amsterdam: Elsevier Scientific Publishing Company; 1974. pp. 553–578. [Google Scholar]
- 22.Smith A. L. Preparation, properties and conditions for assay of mitochondria: slaughterhouse material, small scale. Methods Enzymol. 1967;10:81–86. [Google Scholar]
- 23.Walker J. E., Skehel J. M., Buchanan S. K. Structural analysis of NADH:ubiquinone oxidoreductase from bovine heart mitochondria. Methods Enzymol. 1995;260:14–34. doi: 10.1016/0076-6879(95)60127-9. [DOI] [PubMed] [Google Scholar]
- 24.Sharpley M. S., Shannon R. J., Draghi F., Hirst J. Interactions between phospholipids and NADH:ubiquinone oxidoreductase (complex I) from bovine mitochondria. Biochemistry. 2006;45:241–248. doi: 10.1021/bi051809x. [DOI] [PubMed] [Google Scholar]
- 25.Darley-Usmar V. M., Capaldi R. A., Takamiya S., Millett F., Wilson M. T., Malatesta F., Sarti P. Reconstitution and molecular analysis of the respiratory chain. In: Darley-Usmar V. M., Rickwood D., Wilson M. T., editors. Mitochondria, A Practical Approach. Oxford University Press; 1987. pp. 143–144. [Google Scholar]
- 26.Vinogradov A. D. Catalytic properties of the mitochondrial NADH-ubiquinone oxidoreductase (complex I) and the pseudo-reversible active/inactive enzyme transition. Biochim. Biophys. Acta. 1998;1364:169–185. doi: 10.1016/s0005-2728(98)00026-7. [DOI] [PubMed] [Google Scholar]
- 27.Maklashina E., Kotlyar A. B., Cecchini G. Active/de-active transition of respiratory complex I in bacteria, fungi and animals. Biochim. Biophys. Acta. 2003;1606:95–103. doi: 10.1016/s0005-2728(03)00087-2. [DOI] [PubMed] [Google Scholar]
- 28.Rich P. R. Electron transfer reactions between quinols and quinones in aqueous and aprotic media. Biochim. Biophys. Acta. 1981;637:28–33. [Google Scholar]
- 29.Takada M., Ikenoya S., Yuzuriha T., Katayama K. Studies on reduced and oxidised coenzyme Q (ubiquinones) Biochim. Biophys. Acta. 1982;679:308–314. doi: 10.1016/0005-2728(82)90301-2. [DOI] [PubMed] [Google Scholar]
- 30.Rich P. R., Harper R. Partition coefficients of quinones and hydroquinones and their relation to biochemical reactivity. FEBS Lett. 1990;269:139–144. doi: 10.1016/0014-5793(90)81139-f. [DOI] [PubMed] [Google Scholar]
- 31.Fato R., Estornell E., di Bernardo S., Pallotti F., Castelli G. P., Lenaz G. Steady-state kinetics of the reduction of coenzyme Q analogues by complex I (NADH:ubiquinone oxidoreductase) in bovine heart mitochondria and submitochondrial particles. Biochemistry. 1996;35:2705–2716. doi: 10.1021/bi9516034. [DOI] [PubMed] [Google Scholar]
- 32.Estornell E., Fato R., Pallotti F., Lenaz G. Assay conditions for the mitochondrial NADH:coenzyme Q oxidoreductase. FEBS Lett. 1993;332:127–131. doi: 10.1016/0014-5793(93)80498-j. [DOI] [PubMed] [Google Scholar]
- 33.Degli Esposti M., Ngo A., McMullen G. L., Ghelli A., Sparla F., Benelli B., Ratta M., Linnane A. W. The specificity of mitochondrial complex I for ubiquinones. Biochem. J. 1996;313:327–334. doi: 10.1042/bj3130327. [DOI] [PMC free article] [PubMed] [Google Scholar]
- 34.Lenaz G. Quinone specificity of complex I. Biochim. Biophys. Acta. 1998;1364:207–221. doi: 10.1016/s0005-2728(98)00028-0. [DOI] [PubMed] [Google Scholar]
- 35.Hano N., Nakashima Y., Shinzawa-Itoh K., Yoshikawa S. Effect of the side chain structure of coenzyme Q on the steady state kinetics of bovine heart NADH:coenzyme Q oxidoreductase. J. Bioenerg. Biomembr. 2003;35:257–265. doi: 10.1023/a:1024663715931. [DOI] [PubMed] [Google Scholar]
- 36.Sakamoto K., Miyoshi H., Ohshima M., Kuwabara K., Kano K., Akagi T., Mogi T., Iwamura H. Role of the isoprenyl tail of ubiquinone in reaction with respiratory enzymes: studies with bovine heart mitochondrial complex I and Escherichia coli bo-type ubiquinol oxidase. Biochemistry. 1998;37:15106–15113. doi: 10.1021/bi981193u. [DOI] [PubMed] [Google Scholar]
- 37.Trumpower B. L., Edwards C. A. Purification of a reconstitutively active iron–sulphur protein (oxidation factor) from succinate–cytochrome c reductase complex of bovine heart mitochondria. J. Biol. Chem. 1979;254:8697–8706. [PubMed] [Google Scholar]
- 38.Ouchane S., Agalidis I., Astier C. Natural resistance to inhibitors of the ubiquinol cytochrome c oxidoreductase of Rubrivivax gelatinosus: sequence and functional analysis of the cytochrome bc1 complex. J. Bacteriol. 2002;184:3815–3822. doi: 10.1128/JB.184.14.3815-3822.2002. [DOI] [PMC free article] [PubMed] [Google Scholar]
- 39.Bennett M. C., Mlady G. W., Kwon Y.-H., Rose G. M. Chronic in vivo sodium azide infusion induces selective and stable inhibition of cytochrome c oxidase. J. Neurochem. 1996;66:2606–2611. doi: 10.1046/j.1471-4159.1996.66062606.x. [DOI] [PubMed] [Google Scholar]
- 40.Ohshima M., Miyoshi H., Sakamoto K., Takegami K., Iwata J., Kuwabara K., Iwamura H., Yagi T. Characterisation of the ubiquinone reduction site of mitochondrial complex I using bulky synthetic ubiquinones. Biochemistry. 1998;37:6436–6445. doi: 10.1021/bi9800202. [DOI] [PubMed] [Google Scholar]
- 41.Lenaz G., Castelli G. P., Fato R., D'Aurelio M., Bovina C., Formiggini G., Marchetti M., Estornell E., Rauchova H. Coenzyme Q deficiency in mitochondria: kinetic saturation versus physical saturation. Mol. Aspects Med. 1997;18:s25–s31. doi: 10.1016/s0098-2997(97)00029-0. [DOI] [PubMed] [Google Scholar]
- 42.Nakashima Y., Shinzawa-Itoh K., Watanabe K., Naoki K., Hano N., Yoshikawa S. Steady-state kinetics of NADH:coenzyme Q oxidoreductase isolated from bovine heart mitochondria. J. Bioenerg. Biomembr. 2002;34:11–19. doi: 10.1023/a:1013862502185. [DOI] [PubMed] [Google Scholar]
- 43.Ragan C. I. NADH-ubiquinone oxidoreductase. Biochim. Biophys. Acta. 1976;456:249–290. doi: 10.1016/0304-4173(76)90001-x. [DOI] [PubMed] [Google Scholar]
- 44.Kussmaul L., Hirst J. The mechanism of superoxide production by NADH:ubiquinone oxidoreductase (complex I) from bovine heart mitochondria. Proc. Natl. Acad. Sci. U.S.A. 2006;103:7607–7612. doi: 10.1073/pnas.0510977103. [DOI] [PMC free article] [PubMed] [Google Scholar]
- 45.Schatz G., Racker E. Partial resolution of the enzymes catalysing oxidative phosphorylation. J. Biol. Chem. 1966;241:1429–1438. [PubMed] [Google Scholar]
- 46.Di Virgilio F., Azzone G. F. Activation of site I redox-driven H+ pump by exogenous quinones in intact mitochondria. J. Biol. Chem. 1982;257:4106–4113. [PubMed] [Google Scholar]
- 47.Ragan C. I. The role of phospholipids in the reduction of ubiquinone analogues by the mitochondrial reduced nicotinamide–adenine dinucleotide–ubiquinone oxidoreductase complex. Biochem. J. 1978;172:539–547. doi: 10.1042/bj1720539. [DOI] [PMC free article] [PubMed] [Google Scholar]
- 48.Marres C. A. M., de Vries S. Reduction of the Q-pool by duroquinol via the two quinone-binding sites of the QH2: cytochrome c oxidoreductase. A model for the equilibrium between cytochrome b-562 and the Q-pool. Biochim. Biophys. Acta. 1991;1057:51–63. doi: 10.1016/s0005-2728(05)80083-0. [DOI] [PubMed] [Google Scholar]
- 49.Brandt U. Proton translocation in the respiratory chain involving ubiquinone – a hypothetical semiquinone switch mechanism for complex I. BioFactors. 1999;9:95–101. doi: 10.1002/biof.5520090203. [DOI] [PubMed] [Google Scholar]