

Abstract
In modern genetic epidemiology studies, the association between the disease and a genomic region, such as a candidate gene, is often investigated using multiple SNPs. We propose a multilocus test of genetic association that can account for genetic effects that might be modified by variants in other genes or by environmental factors. We consider use of the venerable and parsimonious Tukey’s 1–degree-of-freedom model of interaction, which is natural when individual SNPs within a gene are associated with disease through a common biological mechanism; in contrast, many standard regression models are designed as if each SNP has unique functional significance. On the basis of Tukey’s model, we propose a novel but computationally simple generalized test of association that can simultaneously capture both the main effects of the variants within a genomic region and their interactions with the variants in another region or with an environmental exposure. We compared performance of our method with that of two standard tests of association, one ignoring gene-gene/gene-environment interactions and the other based on a saturated model of interactions. We demonstrate major power advantages of our method both in analysis of data from a case-control study of the association between colorectal adenoma and DNA variants in the NAT2 genomic region, which are well known to be related to a common biological phenotype, and under different models of gene-gene interactions with use of simulated data.
The identification of a large number of SNPs across the human genome has created great opportunity for fine mapping disease susceptibility loci (DSL) through population-based association studies.1–5 An increasingly popular design of association studies has been the indirect approach, in which the association between the disease and a genomic region, such as a candidate gene, is studied using a set of marker SNPs that themselves may or may not have causal effects but would be likely to be in linkage disequilibrium (LD) with the underlying causal variants, if any exist. The availability of LD information across the human genome from the International HapMap project6,7 and a number of other emerging databases8,9 is now enabling researchers to select informative sets of tagging SNPs that could be used as markers in indirect association studies.10–13
A central statistical issue for indirect association studies is how to optimally analyze the association of a disease phenotype with multiple tightly linked SNPs within a genomic region. A locus-by-locus approach could be optimal if one of the genotyped SNPs itself is causal. In contrast, multilocus tests that assess the association of a disease with multiple marker SNPs simultaneously could be superior when several SNPs may be associated with the disease because of either their direct causal effects or their LD with the underlying causal variant(s) in the region. Two classes of multivariate tests, one based on multilocus genotype data12,14 and the other based on reconstructed haplotype information,15,16 are now popularly used in practice.
Another important issue for identification of DSL in complex diseases is that the etiologic effects of the underlying causal variants are likely to be complex because of a number of factors, including but not limited to gene-gene and gene-environment interactions. It has been long recognized that failing to account for these sources of heterogeneity could dramatically reduce the power of detecting DSLs in both linkage and association studies. Since the late 1980s, a variety of multipoint methods have been developed to account for gene-gene interaction in linkage analysis.17–21 Methods for linkage scans accounting for gene-environment interactions have also received some attention.22,23 More recently, a number of powerful methods also have been developed for incorporating gene-gene interactions in association studies.24,25 These methods, however, are mostly suitable for direct association studies involving candidate SNPs and cannot exploit the structure of indirect association studies involving groups of tightly linked SNPs that could be statistically correlated because of LD or functionally related because of underlying common biological mechanisms.
In this article, we propose a novel method for incorporating gene-gene and gene-environment interactions into association studies. When several SNPs are involved within a gene, the number of parameters required in standard statistical models of gene-gene and gene-environment interactions could easily become very large, potentially causing loss of power due to either the use of increased dfs or the need for multiple-testing adjustments. We consider use of Tukey’s 1-df model of interaction.26,27 We show that this parsimonious form of interaction can be motivated through a conceptual framework in which the observed SNPs within a gene affect the risk of the disease through an underlying common causal mechanism. Modern association studies in which tagging SNPs are selected as potential surrogates for underlying causal variants fit into this framework. Other examples where the framework is very natural are also discussed.
We propose a novel multilocus test of genetic association, based on Tukey’s model, that can efficiently exploit the LD pattern among SNPs within a gene and can simultaneously account for their interactions with SNPs in another gene or with an environmental exposure. We simulate case-control data, in a way that mimics modern association study designs, to evaluate type I errors and powers of the proposed testing strategy. We also apply the proposed methodology to a case-control study designed to investigate the association between colorectal adenoma and DNA variants in N-acetyltransferase 2 (NAT2 [MIM 243400]), a candidate gene that plays an important role in detoxification of aromatic amine carcinogens present in cigarette smoke. Both the simulated and real data examples demonstrate major power advantages for the proposed methodology over two alternative tests of association, one ignoring interactions and the other incorporating a saturated model of interactions.
Material and Methods
A Latent-Variable Model and Tukey’s 1-df Form of Interaction
Suppose that G1 and G2 are two candidate genes of interest for which K1 and K2 marker SNPs, respectively, have been genotyped. Let S1=(S11,S21,…,SK11) and S2=(S12,S22,…,SK22) denote the genotype data for the corresponding sets of markers. In this article, we assume that each marker genotype Sij is recorded as “0,” “1,” or “2,” counting the number of copies of the minor or variant allele. Figure 1 shows a schematic diagram for a hypothesized model describing the relationship between the marker SNPs and the disease through an underlying causal mechanism. The model assumes that, for each gene Gi, the marker data Si act as a surrogate for an underlying biological phenotype, Zi, that is causally related to the disease. The associations between the markers and the biological phenotypes for the two genes are described by two separate linear models (fig. 1, upper two boxes), where the error terms ε1 and ε2 are assumed to be mean zero independent random variables. The risk of the disease, given the causal variables Z1 and Z2, is specified by a standard logistic model that involves both main and interaction effects (fig. 1, lower box). It is also implicitly assumed that, given the true biological exposures Z1 and Z2, the risk of the disease does not depend on the markers S1 and S2.
Figure 1. .

A conceptual framework for modeling gene-gene interactions in indirect-association studies.
Before one proceeds further, it is useful to understand what the latent variables Z1 and Z2 may be in practice. If the gene Gi contains a single causal locus Li, the variable Zi could represent the genotype data for Li itself. If, for example, one of the selected markers is the causal locus and Zi denotes the count for the corresponding variant allele, then the assumed linear model describing the relationship between Zi and Si would fit perfectly—that is, the error term εi would vanish, by the setting of γik=1 for the causal locus and γik=0 for all the other markers. If the causal locus is not selected as a marker, then the error term will not generally disappear, but the magnitude of it could be expected to be small for modern association studies that aim to select the markers to be a panel of tagging SNPs that would have a very high degree of LD, as measured by the R2 criterion, with all the genetic variations of the regions, including any possible causal ones. The validity of the proposed framework, however, does not depend on the existence of a single causal locus in each gene. The variable Zi could, for example, represent a quantitative biological phenotype that may be governed by several different variants within the same gene Gi. In the study of colorectal adenoma (see the “Results” section), the underlying biological phenotype for the gene of interest, NAT2, is the N-acetyltransferase enzymatic activity level, which has been shown to be determined by several single–base-pair substitutions in the gene and the associated haplotypes/diplotypes.28,29
The logistic model shown in figure 1 (lower box) cannot be used directly for association testing because, typically, the variables Z1 and Z2 are not observable. However, in this model, expressing Z1 and Z2 in terms of S1 and S2 with use of the corresponding linear-regression models and assuming small variances for the error terms ε1 and ε2, a risk model for the disease (D), in terms of the observable SNPs, can be derived approximately in the formula
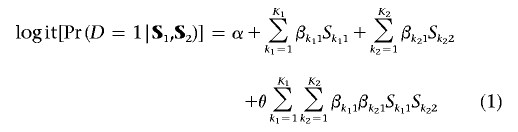 |
(see appendix A for details). We observe that equation (1) resembles a traditional logistic-regression model, except that the SNPs across two genes have the parsimonious Tukey’s 1-df form of interaction.26,27 Thus, postulating the biological effect of the observed SNPs to be determined by a smaller set of casual variables leads to a very parsimonious model for gene-gene interactions.
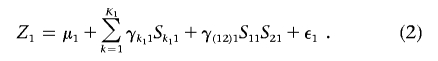
The motivation of Tukey’s 1-df model for interaction through the above latent-variable framework also allows extension of the model in a number of different ways. For example, if some of the SNPs within a gene are known a priori to have functional significance, then it may be desirable to capture possible interactions between these functional SNPs of the same gene. Suppose S11 and S21 are two such SNPs for gene G1. Then, the regression model for Z1 could be extended to allow for interaction between S11 and S21, as
 |
With the assumption that the models for Z2 and Pr(D=1|Z1,Z2) remain the same as before, the model for the risk of the disease, in terms of the SNP data S1 and S2, can now be derived in the formula
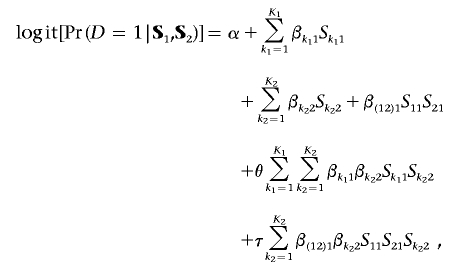 |
which includes both second- and third-order interactions. One could also account for SNP-SNP interactions within a gene by specifying the disease risk in terms of haplotypes instead of locus-specific genotypes.
The proposed modeling framework can be easily extended to incorporate gene-environment interactions. Suppose that the genomic region G1 (e.g., NAT2) is believed to involve a biological pathway through which an environmental variable X (e.g., smoking) may act on the risk of a disease (e.g., colorectal adenoma). Again, on the basis of the latent-variable approach, a model for the disease risk in terms of the marker-SNPs S1 and the environmental variable X can be derived in the form
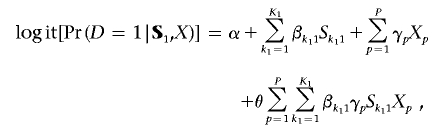 |
where {X1,X2,…XP} is a set of suitably chosen design variables, such as dummy variables for categorical exposures, for representing the effects of the exposure X.
Association Testing
In this section, we study methods for hypothesis testing based on the proposed model. When data on multiple putative risk factors, such as multiple candidate genes, are available, one could test a number of different types of hypotheses regarding the role of these factors in the risk of the disease. For association studies, the primary goal is to establish which of the factors, if any, are related to the risk of the disease. If multiple factors are found to be related to the disease, then a secondary hypothesis of interest could be generated to test for specific forms of interaction among the established risk factors. It is important, however, to realize that, although the test of interaction itself may be of only secondary interest, accounting for heterogeneity of genetic effects due to interactions can be vital for enhancing the power of the primary hypothesis of association testing.
In the following sections, we develop an association-testing framework involving two candidate genes, G1 and G2. The same framework can also be used to develop tests of associations involving a candidate gene and an environmental exposure. We assume a population-based case-control design of unrelated subjects. All of the methods, however, are easily extendable to alternative study designs, including family-based case-control and case-parent–trio designs. For possible strategies for using the methodology in general association studies that involve numerous candidate genes, see the “Discussion” section.
The general principle
We focus on the test of association for G1; the methods for G2 are symmetric. In model (1), the null hypothesis of no association of disease with G1 can be statistically stated as
which implies conditional independence of D and G1, given G2. The parameter βk11 not only appears in the model as the main effect for the marker Sk11 but also contributes to all K2 interaction terms that could be defined involving Sk11 and the K2 SNPs in G2. Thus, it is best to describe βk11, k1=1,…,K1 as a set of “generalized association parameters” instead of as traditional “main” or “interaction” effects.
A complication of association testing in model (1) is that, under the null hypothesis of H(1)0, the parameter θ disappears from the model and, hence, is not estimable from the data. Thus, standard statistical tests, such as score- or likelihood-ratio tests, which require estimation of all nuisance parameters of the model under the null hypothesis, are not applicable. However, for each fixed value of θ, irrespective of whether or not it is the true value for the population, model (1) gives a valid way of testing the null hypothesis H(1)0. In particular, for each fixed value of θ, the likelihood score function for the parameter vector β1=(β11,…,βK11) can be shown to have zero expectation under the null hypothesis of H(1)0. Thus, for each fixed value of θ, an unbiased score statistic could be formed for testing H(1)0. Varying the value of θ, one can get a family of score statistics. We propose to use the maximum value of such score statistics over a suitable range of θ as the final test statistics to be used.
Steps for deriving the test statistics
We assume that N1 cases and N0 controls have been sampled in the study and that, for each subject, i, the SNP-genotype vectors Sli and S2i have been recorded. In the following list, we describe the four major steps for deriving the test statistics associated with G1. The test statistics for G2 could be derived by symmetry.
-
1.
Obtain maximum-likelihood estimate α and β2=(β12,…,βK22) under the local null hypothesis H(1)0. Under H(1)0, the model (1) becomes equivalent to a standard logistic-regression model involving the main effects of the SNPs in G2. Thus, a standard logistic software package can be used to obtain
 . Let
. Let  denote Pr(D=1|S1,S2)=Pr(D=1|S2) evaluated at β1=0 and
  .
. -
2. For a fixed value of θ, evaluate the score functions for the parameters βk11 and k1=1,…,K1 at β1=0 and
 , using the formula
which, in a vectorized form, can be written as
Interestingly, the score functions (eq. [3]) resemble those obtained from a standard logistic-regression model, except that the design vector S1i has been replaced by
 , a quantity incorporating design variables for both the main and the interaction effects of S1.
 -
3. Estimate the inverse of the variance-covariance matrix for Sβ1(θ), using the formula
where the expressions for the component information matrices—Iβ1β1(θ)=∂L/∂β1∂βT1,Iβ1ψ(θ)=∂L/∂β1∂ψT and Iψψ=∂L/∂ψ∂ψT—evaluated at β1=0 and
 are given in the formulae (A2), (A3), and (A4) (in appendix A). All these quantities can be conveniently computed using standard logistic-regression software, by simply setting the design vector for each subject to be
  .
. -
4. For fixed value of θ, obtain the score statistics
Compute the final test statistics as
 , where L and U denote some prespecified values for lower and upper limits of θ, respectively.
Simulating the null distribution of the test statistics
In appendix A, we show an asymptotic equivalent representation of the score statistics T1(θ) as UT(θ)V-1(θ)U(θ), where
 |
denotes the efficient score function for β1 for fixed θ (see formula [A5]) and V(θ) is the limit of  . Further, under β1=0, we show that U(θ), as a stochastic process in θ, converges to a K1-variate Gaussian process, 𝒵(θ), with mean zero and variance-covariance function
 |
We propose to generate realization of the process 𝒵(θ) as
 |
where Wi and i=1,…,N are independent standard normal random variables that are also independent of the data.30 The null distribution of the test statistics T1 is then simulated by repeatedly generating data as  , where, in each replication, a new realization of UT0(θ) is obtained by regenerating the random numbers (W1,…,WN).
We also considered simulating the null distribution of T*1, using a permutation-based resampling method. We randomly permuted the value of the vector S1i over different subjects i=1,…,N0+N1 while holding Di and S2i to be fixed at their observed values. This yields a valid way of generating null data under the assumption that S1 and S2 are independent in the underlying population, because, in this case, the null hypothesis of β1=0 corresponds to independence of S1i and (Di,S2i). By permuting all the components of S1i simultaneously and keeping (Di,S2i) fixed, the procedure allows within-gene LD patterns and marginal association structures of Di and G2 to be the same as the original data.
Design for Simulation Study
We studied performance of the proposed test of association, using simulated case-control studies. We assumed that the true risk model involves two potentially interacting causal SNPs, S*1 and S*2, residing on two separate candidate genes, G1 and G2, respectively. For each gene, we assumed that genotype data are available on six marker SNPs, none of which is the causal SNP. To simulate a realistic LD pattern among the markers, we used real haplotype data on glutathione peroxidase 3 (GPX3 [MIM 138321]) and glutathione peroxidase 4 (GPX4 [MIM 138322]), two candidate genes for prostate cancer that have been resequenced using a sample of 29 white subjects at the Core Genotyping Facility of the National Cancer Institute (NCI). In our simulation, we chose the marker SNPs for G1 and G2 to correspond to two sets of six tagging SNPs that have been respectively selected for GPX3 and GPX4 with use of the original resequencing data. Table 1 shows the distribution of the associated haplotypes.
Table 1. .
Haplotype Frequencies Used for Simulating Genotype Data on Marker SNPs for Two Candidate Genes
| Haplotype | Frequency |
| G1: | |
| 000000 | .3211 |
| 001101 | .1204 |
| 010000 | .0909 |
| 000001 | .0785 |
| 111001 | .0722 |
| 110001 | .0708 |
| 000010 | .0610 |
| 011001 | .0523 |
| 110000 | .0468 |
| 100000 | .0353 |
| 001000 | .0279 |
| 010001 | .0228 |
| G2: | |
| 100010 | .3506 |
| 010001 | .2819 |
| 010100 | .1274 |
| 100000 | .0678 |
| 000000 | .0407 |
| 101100 | .0401 |
| 000010 | .0307 |
| 010010 | .0237 |
| 010000 | .0226 |
| 100001 | .0144 |
To define haplotypes for each gene, including the causal locus, we allowed the major mass of the causal SNP to lie mainly on one marker haplotype: 001101 for G1 and 010100 or 101100 for G2, depending on whether a scenario with a common or rare variant, respectively, was considered. We fixed the marginal frequency for a causal SNP to be the same as that for the corresponding main haplotype: 12% for G1 and 12.7% (common) or 4.1% (rare) for G2. To allow for imperfect LD between the causal and the marker SNPs, we allowed for a small amount of recombination between the causal SNP and a set of other marker haplotypes: {000001,000010} for G1 and {100000,101100} or {000010,010010} for G2, depending on whether a scenario with the common or rare variant was considered. We varied the recombination fraction (δ) at three different values to generate different degrees of LD between the causal and marker SNPs. The values of R2geno, defined as the squared multiple correlation between the genotypes at the causal loci and those at the corresponding marker loci, were 90%, 75%, and 60% in these three settings.
Given the set of haplotype frequencies, in each simulation we first generated diplotype (haplotype-pair) data for a random sample of subjects, assuming random mating and no LD between genes. For each subject, we generated a binary disease end point, D=0 or D=1, assuming a general logistic-regression model of the formula
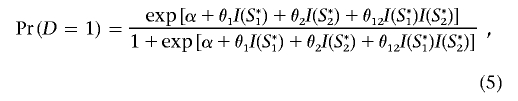 |
where I(S*1) and I(S*2) are binary indicator variables for the presence of the variant allele at the respective causal loci. For each given set of parameter values θ1, θ2, and θ12, the intercept parameter α was chosen in such a way that the marginal probability of the disease in the underlying population is fixed at 1%. In each replication, we first generated data for a large random sample of subjects, which we then treated as the “study base” to further select a case-control sample of given size. During analysis of each set of simulated data, we assumed that genotype data are variable for the marker SNPs but not for the causal SNPs.
We computed the empirical significance level of the proposed testing procedure, by simulating data under two different settings, both of which corresponded to the null hypothesis of no association of the disease with G1. In the first setting, we assumed all the association parameters—θ1, θ2, and θ12—to be zero, which implied that both G1 and G2 were not associated with the disease. In the second setting, we assumed θ1 and θ12 to be null but allowed nonzero values for θ2, so that G2 could be associated with the disease even if G1 is not. The significance thresholds for the test statistics T*1 were obtained using two methods: (1) permutation-based resampling of the genotype data of SNPs in G1 and (2) the asymptotic-based method, which requires generation of normal numbers.
To evaluate power, we simulated data using five different models for the joint effect of the two causal SNPs (see table 2). Assuming rare disease, these settings correspond to (1) the purely epistatic form, which assumes that the effect of one variant exists only in the presence of the other and vice versa; (2) the multiplicative form, which assumes that the joint effect of the two variants is given by the product of the main effects of the individual variants31; (3) the purely additive form, an approximation to the genetic heterogeneity model,18 which assumes that the joint effect of the two variants is given by the sum of main effects of the individual variants; and (4) the crossover model, which assumes that the second variant has no effect by itself but that it reverses the effect of the first variant. For each model, we varied the value of the free risk parameter(s) in a way that the marginal relative risk (MRR)—the relative risk of the disease associated with one variant when the presence of the other is ignored—associated with S*1 ranges in the set {1.2,1.4,1.6,1.8,2.0}. For the epistatic and multiplicative models, the MRR for S*2 also varied in the same range. For the additive model, we fixed the MRR for S*2 to be 2.0 (low penetrant) and 5.0 (high penetrant) in the common and rare variant scenarios, respectively. For the crossover model, we assumed φ1=0.90(<1), which implies a modest protective effect of S*1 in the absence of S*2.
Table 2. .
Approximate Relative-Risk Models Used for Simulating Disease End Points, Given the Genotypes for Two Causal Loci in Candidate Genes G1 and G2
| No. of Alleles |
||||
| Model | (S*1=0, S*2=0)a | (S1⩾1, S2=0) | (S1=0, S2⩾1) | (S1⩾1, S2⩾1) |
| General form | 1 | exp(θ1) | exp(θ2) | exp(θ1+θ2+θ12) |
| Purely epistatic | 1 | 1 | 1 | φ |
| Multiplicative | 1 | φ | φ | φ2 |
| Additive | 1 | φ1 | φ2 | φ1+φ2-1 |
| Crossover | 1 | φ1 (<1) | 1 | φ12 (>1) |
S*1 and S*2 refer to the number of copies of the variant allele in the causal loci of G1 and G2, respectively.
We compared power for three different G1-specific tests of association: (1) LogMain, an omnibus 6-df χ2 test based on a logistic-regression model that involves the main effects of only the six marker SNPs in G112; (2) LogMain&Int, an omnibus 42-df χ2 test based on a logistic-regression model that involves the main effects of all the SNPs in G1 and G2 and all pairwise interactions between SNPs across the two genes (the null model in this test involves only the main effects of the SNPs in G2); and (3) TukAssoc, the proposed test of association based on Tukey’s model of interaction. In each method, the genotype data for the marker SNPs were coded as continuous variables representing the count for the respective minor alleles. Asymptotic-based significance thresholds were used for all three test statistics. Both type I errors and powers were obtained empirically, on the basis of 1,000 simulated data sets.
Results
Simulation Study
Table 3 shows the empirical type I error rates for the proposed testing procedure at a significance level of α=0.01. Both methods performed well in maintaining the nominal significance level in all the different settings considered.
Table 3. .
Empirical Significance Level for Test of Association with Region G1
| Relative Risk for Causal SNP in G2 (θ2) |
||
| R2geno,a f2,b and Method | 1.0 | 2.0 |
| 90%: | ||
| .04: | ||
| Permutation | .008 | .012 |
| Asymptotic | .008 | .011 |
| .13: | ||
| Permutation | .013 | .011 |
| Asymptotic | .012 | .009 |
| 75%: | ||
| .04: | ||
| Permutation | .010 | .009 |
| Asymptotic | .009 | .008 |
| .13: | ||
| Permutation | .009 | .004 |
| Asymptotic | .009 | .004 |
| 60%: | ||
| .04: | ||
| Permutation | .011 | .012 |
| Asymptotic | .012 | .012 |
| .13: | ||
| Permutation | .009 | .009 |
| Asymptotic | .009 | .008 |
Multiple R2 between genotypes and causal and marker loci.
Allele frequency for causal SNP in G2.
Figures 2–5 show the empirical power of different procedures for testing the association of the disease with G1 at a significance level of 0.01 under different models for the joint effects of the underlying causal variants. Similar examples showing power at a significance level of 0.0001 are provided in figures 6–9.
Figure 2. .

Empirical power, at α=0.01, to detect the association of the disease with candidate gene G1 as a function of the MRR of the underlying causal SNP, S*1. The joint effect of causal SNPs in G1 and G2 follows the purely epistatic model (see table 2). f1 and f2 denote minor-allele frequencies for causal SNPs in G1 and G2, respectively, and R2geno denotes the value of multiple R2 between the causal and marker loci within a gene.
Figure 3. .

Empirical power, at α=0.01, to detect the association of the disease with candidate gene G1 as a function of the MRR of the underlying causal SNP, S*1. The joint effect of causal SNPs in G1 and G2 follows the purely multiplicative model, with φ1=φ2 (see table 2). f1 and f2 denote minor-allele frequencies for causal SNPs in G1 and G2, respectively, and R2geno denotes the value of multiple R2 between the causal and marker loci within a gene.
Figure 4. .

Empirical power, at α=0.01, to detect the association of the disease with candidate gene G1 as a function of the MRR of the underlying causal SNP, S*1. The joint effect of causal SNPs in G1 and G2 follows the additive model, with φ2 chosen so that MRR2=2.0 when f2=0.12 and MRR2=5.0 when f2=0.04 (see table 2). f1 and f2 denote minor-allele frequencies for causal SNPs in G1 and G2, respectively, and R2geno denotes the value of multiple R2 between the causal and marker loci within a gene.
Figure 5. .

Empirical power, at α=0.01, to detect the association of the disease with candidate gene G1 as a function of the MRR of the underlying causal SNP, S*1. The joint effect of causal SNPs in G1 and G2 follows the crossover model, with φ1=0.90 (see table 2). f1 and f2 denote minor-allele frequencies for causal SNPs in G1 and G2, respectively, and R2geno denotes the value of multiple R2 between the causal and marker loci within a gene.
Figure 6. .

Empirical power, at α=0.0001, to detect the association of the disease with candidate gene G1 as a function of the MRR of the underlying causal SNP, S*1. The joint effect of causal SNPs in G1 and G2 follows the purely epistatic model (see table 2). f1 and f2 denote minor-allele frequencies for causal SNPs in G1 and G2, respectively, and R2geno denotes the value of multiple R2 between the causal and marker loci within a gene.
Figure 7. .

Empirical power, at α=0.0001, to detect the association of the disease with candidate gene G1 as a function of the MRR of the underlying causal SNP, S*1. The joint effect of causal SNPs in G1 and G2 follows the purely multiplicative model, with φ1=φ2 (see table 2). f1 and f2 denote minor-allele frequencies for causal SNPs in G1 and G2, respectively, and R2geno denotes the value of multiple R2 between the causal and marker loci within a gene.
Figure 8. .

Empirical power, at α=0.0001, to detect the association of the disease with candidate gene G1 as a function of the MRR of the underlying causal SNP, S*1. The joint effect of causal SNPs in G1 and G2 follows the additive model, with φ2 chosen so that MRR2=2.0 when f2=0.12 and MRR2=5.0 when f2=0.04 (see table 2). f1 and f2 denote minor-allele frequencies for causal SNPs in G1 and G2, respectively, and R2geno denotes the value of multiple R2 between the causal and marker loci within a gene.
Figure 9. .

Empirical power, at α=0.0001, to detect the association of the disease with candidate gene G1 as a function of the MRR of the underlying causal SNP, S*1. The joint effect of casual SNPs in G1 and G2 follows the crossover model, with φ1=0.90 (see table 2). f1 and f2 denote minor-allele frequencies for causal SNPs in G1 and G2, respectively, and R2geno denotes the value of multiple R2 between the causal and marker loci within a gene.
When the true effects of the causal SNPs were purely epistatic (fig. 2), the proposed test of association (TukAssoc), which accounts for interactions, clearly outperformed the standard main-effect–based test (LogMain) in detecting the association of the disease with G1. Given the same marginal-effect size for the causal SNP in G1, the gain in power was larger when the causal SNP in the background gene, G2, was rarer, because it corresponded to larger magnitude of the interaction parameter θ12. In this rare-variant setting, the test based on the saturated model of interaction (LogMain&Int) also performed better than the main-effect–based test (LogMain) but lost major power compared with TukAssoc because of the use of large dfs. As the correlation between the causal and marker SNPs decreased, the absolute power of all of the different methods, as expected, decreased. Interestingly, the power of both interaction-based tests, LogMain&Int and TukAssoc, relative to LogMain, also decreased as R2geno decreased.
When the true effects of the causal SNPs were multiplicative (fig. 3), LogMain, which assumes no multiplicative interaction, as expected, had the highest power. The proposed test, TukAssoc, although not the best, remained a close second. In contrast, LogMain&Int, which used the saturated model for interaction, performed very poorly. When the true model was additive (fig. 4), the power of TukAssoc remained very close to that of LogMain when the causal SNP, S*2, in the background gene, G2, was “common low penetrant.” In contrast, under the same model, when S*2 was “rare high penetrant,” TukAssoc showed a major gain in power over LogMain. Finally, under the crossover model (fig. 5), in which the causal variant in G2 reversed the effect of that in G1, TukAssoc had much higher power than LogMain. Often, LogMain&Int also performed better than LogMain but remained far inferior to TukAssoc. As observed under the epistatic model, the power of both TukAssoc and LogMain&Int relative to LogMain decreased for lower values of R2geno.
Under each setting described above, the power advantage of TukAssoc compared with the other two procedures further increased when the significance level was chosen to be 0.0001 instead of 0.01 (see figs. 6–9).
A Study of NAT2 Acetylation Activity, Smoking, and Risk of Colorectal Adenoma
Cigarette smoking has been consistently associated with the risk of colorectal adenoma, a recognized precursor to colorectal cancer (MIM 114500). Thus, there is interest to study the risk of adenoma associated with candidate genes encoding N-acetyltransferase enzymes that are involved in the metabolism of aromatic amines derived from tobacco smoke. N-acetyltransferase 2 (NAT2), located at 8p21.3, is a candidate gene known to play an important role in the detoxification of certain aromatic carcinogens and, after N-hydroxylation, in the activation of other amine protocarcinogens to their ultimate carcinogenic form. We recently completed a report32 on a case-control study of the association between NAT2 genetic variants and colorectal adenoma, in relation to tobacco smoking, which used “case” individuals with left-sided prevalent advanced adenoma and sex- and age-matched “control” individuals selected from the screening arm of the large, ongoing Prostate, Lung, Colorectal and Ovarian (PLCO) Cancer Screening Trial.33,34 The study selected six SNPs (C282T, T341C, C481T, G590A, A803G, and G857A) for genotyping that are known to be informative for reconstructing diplotypes that have been described elsewhere and categorized in laboratory studies as having “slow,” “intermediate,” or “rapid” N-acetyltransferase enzymatic activity. On the basis of genotype data, 685 cases and 693 controls in the study were assigned diplotype and related phenotype status with use of an algorithm developed at the University of Louisville.28,29 The frequency distribution of these diplotypes and associated phenotypes are shown in table 4. Questionnaire data on the smoking histories of these subjects were also available. We categorized subjects, on the basis of smoking history, as “current,” “former,” or “never.”
Table 4. .
Distribution of Cases and Controls by NAT2 Diplotype and Acetylation Phenotype in the PLCO Adenoma Study
| Diplotype | Acetylation Phenotypea | Cases | Controls |
| *5B/*6A | 0 | 155 | 124 |
| *5B/*5B | 0 | 121 | 98 |
| *6A/*6A | 0 | 59 | 73 |
| *5A/*5B | 0 | 16 | 18 |
| *5B/*7B | 0 | 16 | 17 |
| *5B/*5C | 0 | 16 | 10 |
| *6A/*7B | 0 | 10 | 12 |
| *5A/*6A | 0 | 8 | 10 |
| *5C/*6A | 0 | 7 | 9 |
| *4/*5B | 1 | 109 | 138 |
| *4/*6A | 1 | 86 | 104 |
| *4/*7B | 1 | 17 | 8 |
| *4/*5A | 1 | 9 | 6 |
| *4/*4 | 2 | 37 | 41 |
| Rare | … | 19 | 25 |
For acetylation phenotype, 0 is slow, 1 is intermediate, and 2 is rapid.
Clearly, in the original study,32 the availability of the prior data to group the numerous diplotypes into a smaller number of phenotypic categories provided us an opportunity to investigate the association between NAT2 and adenoma in a very powerful way. In the current study, we compared the power of alternative tests that relied on the original diplotypes themselves, pretending as if the underlying phenotype variable was not observed. It is to be noted that, for most genomic regions, the phenotypic significance of the variants is not well understood and, thus, the opportunity for grouping the observed genetic variants into a smaller number of categories may not exist. Using the diplotype information shown in table 4, we performed three different tests of association between NAT2 and adenoma: (D1) LogMain, an omnibus χ2 test based on a logistic-regression model that involves a main-effect term for each of the 14 nonreferent diplotypes (df=14); (D2) LogMain&Int, an omnibus χ2 test based on a logistic-regression model that involves the main effects of the diplotypes and all the interactions between the diplotypes and the two nonreferent categories of smoking; the null model in this test includes only the main effects of the smoking categories (df=14+14×2=42); and (D3) TukAssoc, an omnibus test of association for NAT2 diplotypes, based on the model
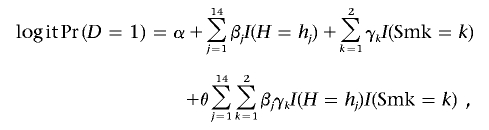 |
where I(H=hj), j=1,…,14, and I(Smk=k),k=1,2 denote the dummy variables for the diplotypes and the smoking categories. In addition, we also performed two phenotype-based tests: (P1), a 1-df test for the trend effect of the phenotype variable that codes it as a continuous variable—”0” for “slow,” “1” for “intermediate,” and “2” for “fast”; and (P2), an omnibus test for the main effect and interactions (with smoking categories) for the continuous phenotype variable (df=1+2=3). All of the phenotype- and diplotype-based tests were adjusted for age and sex by including appropriate main-effect terms in the corresponding logistic-regression model. For computation of P values, we relied on permutation-based resampling, instead of on the asymptotic-based method, because of the small number of subjects in some of the diplotype categories.
From the results shown in table 5, it is clear that, in this example, the test that captures both the main and the interaction effects of the phenotype variable was the most sensitive in detecting the association of adenoma with NAT2. Among the diplotype-based methods, TukAssoc, although not significant at the traditional 5% level, provided more evidence of association than the other two methods considered. This example illustrates two important points. First, it shows how incorporating interaction can improve the power to discover genetic associations. Second, it shows that the most powerful test for a genetic association could be obtained when the phenotypic significance of the underlying variants are well understood a priori. If such prior data are not available but the variants within a genomic region are likely to be functionally related by a common biological mechanism, such as NAT2 acetylation activity, then the proposed test of association based on Tukey’s 1-df model of interaction could be a promising approach.
Table 5. .
Test of Association of Adenoma with NAT2, with and without Accounting for NAT2-Smoking Interaction
| Test | Test Statistic | df | P |
| Acetylation-baseda: | |||
| LogMain | 3.30 | 1 | .069 |
| LogMain&Int | 14.23 | 3 | .003 |
| Diplotype-basedb: | |||
| LogMain | 18.25 | 14 | .200 |
| LogMain&Int | 54.41 | 42 | .156 |
| TukAssoc | 26.45 | … | .071 |
Uses continuous phenotype variable codes 0, 1, and 2.
Uses diplotypes shown in table 4.
Discussion
In summary, we have proposed a powerful method for testing genetic association in case-control studies, by accounting for heterogeneity in disease risk due to gene-gene and gene-environment interactions. By considering a conceptual framework in which multiple SNPs within a gene are postulated to be related to a common causal mechanism, we motivate the use of a low-dimensional 1-df model for gene-gene and gene-environment interactions. On the basis of this model, we have developed an omnibus gene-specific test of association that can simultaneously account for the main effects of the variants within the region as well as for their interactions with the variants of another region or with an environmental exposure. We used both simulated and real data to study the efficiency of the proposed method relative to two standard logistic-regression–based tests, one ignoring interactions and the other incorporating a saturated model for interactions. These studies suggest that the proposed method can improve the power of genetic association tests in the presence of nonmultiplicative effects of the underlying causal variants. When the true effects are close to multiplicative, the proposed method, although it may not be the best, generally has robust power.
Gene-gene and gene-environment interactions can cause the effect size of a genetic variant to be heterogeneous for different subgroups of the population. Tests of genetic association that ignore such heterogeneity may lack power, since the “marginal” effect of a variant when subgroups are ignored can be quite small, even though its effect can be quite large in specific subgroups. Under an extreme form of interaction in which the effect of a variant may be in opposite directions in different subgroups, there may be no marginal effects even if there are very strong subgroup effects. Accounting for interaction in association testing allows one to exploit the full variation in the effects of the causal variants, at the risk of increasing the number of parameters to be tested. Our applications involving the saturated model for interaction suggest that the power advantage of interaction-based tests may be negated if too many dfs are spent on model for interaction. The proposed test based on Tukey’s 1-df model for interaction provides a good compromise between detecting large genetic effects versus testing for many parameters.
When multiple SNPs are involved within a gene, one could attempt to reduce the dfs for related association tests on the basis of a derived variable that can combine information across multiple SNPs by using prior knowledge about possible directionality of the effects of the variants.35 The acetylation phenotype for the gene used in our data analysis, NAT2, is a derived variable defined on the basis of prior data. The scope of such analysis, however, is limited for contemporary association studies because of the lack of such prior data on the SNPs. The proposed method, which also uses derived variables—namely, the latent factors Z1 and Z2—does not require any explicit prior data on the directionality of the effects of the SNPs under study. In particular, the generalized association parameters (β) allow one to estimate the directionality as well as the strength of association from the data. Thus, the proposed method can use a low-df model for interaction without requiring explicit prior knowledge about the potential effects of the SNPs.
An alternative approach to reduce the df for association tests could be to follow a two-stage procedure in which SNPs are first tested for their main effects and, then, interaction-based tests involving only those SNPs for which main effects were found to be significant are considered. In general, obtaining the correct type I error rates for such sequential procedures is quite complex. A recent report suggested a conservative but simple approach for finding critical values for SNP-based two-stage tests.36 In a limited simulation study, we found the power of such a procedure to be similar to the proposed gene-based one-stage test, TukAssoc, when each candidate gene under study involved only a single causal variant. In contrast, when the individual candidate genes involved multiple causal variants, TukAssoc was clearly superior. Further work is needed to develop more-efficient two-stage tests of association.
Computationally, the proposed score-test statistic is remarkably simple and can be implemented using standard logistic-regression software. We have described a simple and fast way of generating the asymptotic null distribution of the test statistics. The methodology can be easily generalized to alternative types of study designs and outcome traits by simply replacing the logistic model with a suitable alternative regression model. Moreover, the methods can be used to test for the collective effect of any group of functionally related SNPs, which need not be restricted to candidate genes.
The results from our simulation studies involving two candidate genes are quite intuitive. When the true effects of the causal loci across two genes were multiplicative, tests that were based on the marker SNPs of individual genes and that ignored gene-gene interactions were optimal. This result can be explained mathematically by the observation that, under the multiplicative model, the likelihood for case-control data can be factored into two pieces, each depending on the marker data from a single gene.20 When the true effects of the causal loci were additive—a nonmultiplicative model that is often considered to be the default for specifying the joint effects of two exposures acting on nonoverlapping pathways18,37—the proposed test performed similarly to or substantially better than the main-effect–based test, depending on the strength of the main effects of the causal variants. When the main effects for both causal variants were modest, the additive model corresponded to only a small departure from multiplicative effects and, thus, TukAssoc performed similarly to LogMain. In contrast, when the main effect of the causal variant in one gene was large, the additive model corresponded to a large departure from multiplicative effects, and TukAssoc became superior. The largest gains in power for TukAssoc over LogMain were seen for the epistatic and crossover models, both of which corresponded to a large departure from multiplicative effects.
As expected, the absolute power of all the methods decreased as R2geno, the correlation between the causal and the marker SNPs, decreased. Interestingly, the power of both interaction-based tests, LogMain&Int and TukAssoc, relative to LogMain also decreased as R2geno decreased. When the markers have low correlation with the respective causal SNPs, the joint risk of the disease in terms of the markers may appear close to the multiplicative model (with nonnull main effects), even if the true effects of the causal variants are highly epistatic. Thus, for low values of R2, models involving only the main effects of the markers may perform well, even if the true effects of the causal loci are highly interactive. In the context of association testing using single binary markers, a similar robustness property for the multiplicative model has been noted elsewhere.38
In this article, we focused on tests of association for one candidate gene by exploiting its interaction with another candidate gene or an environmental exposure. In practice, however, an association study may involve a variety of candidate genes and environmental exposures, each of which may interact with all the others. Clearly, if all the possible interactions are to be accounted for, the number of potential tests could be very large. To examine the effect of the associated multiple-testing problem, we performed a small simulation study. We used the same setting as shown in figure 2 but added eight null genes to the analysis. Similarly as we did for the two genes that contained the causal loci, for each of the null genes we assumed that genotype data are available on six marker SNPs. We used TukAssoc to assess the significance of a specific gene by pairing it with each of the other nine genes and then taking the maximum of the corresponding nine different test statistics. To evaluate the critical value of the final test statistic, we used permutation-based resampling that adjusts for multiple testing in an efficient way, by taking into account the correlation among the different test statistics. Alternatively, we used the standard main-effect–based test LogMain to test for each gene individually, ignoring interactions. For both TukAssoc and LogMain, the test for each specific gene was performed at the significance level of 0.01/10=0.001, to maintain an overall significance level of 0.01. Even with multiple-testing adjustment, TukAssoc remained substantially more powerful than LogMain in a number of different settings. For example, in the setting of R2=90, f2=0.13, and MRR=1.6, the power for detecting the association of the disease with G1 was 54% with use of TukAssoc and 34% with use of LogMain. With f2=0.04 and R2 and MRR remaining the same as the values above, the power for TukAssoc became 75%, whereas that for LogMain remained at 34%. In the context of a much-larger-scale study involving a whole-genome scan, a recent report has made a similar observation that tests that account for interactions among pairs of SNPs could be substantially more powerful than those based only on the main effects of the SNPs, even though the former class of tests may require a much higher level of multiple-testing adjustment.36
Nevertheless, we believe that the power advantage of interaction-based tests would be best realized if the number of interactions to be considered could be reduced a priori, on the basis of biological knowledge, previous data, or/and some prescreening methods. Biological knowledge of a pathway, for example, may help investigators choose a few “high-prior” candidate genes that are likely to have central roles in mediating the biological effects of various genetic and environmental exposures. In such a setting, the power of association for the other candidate genes in that pathway can be improved by accounting for their interactions with the selected high-prior genes. Data from previous linkage and association studies could also guide the selection of such high-prior candidates.
A prescreening method could also reduce the number of interactions to be tested. For case-control studies involving candidate SNPs, Millstein et al.25 described a method that first screens for potential interactions by testing for the significance of the correlations among pairs of SNPs in the pooled case-control sample. If, for a pair of SNPs, no LD is expected in the population but correlation is evident in the pooled case-control data, it indicates nonmultiplicative effects of the variants on the risk of the disease. Moreover, because the screening is done only on the basis of the genotype data of the subjects, without regard to their case-control status, subsequent tests of association do not require adjustment. Similar ideas can be adopted to reduce the number of gene-gene interactions in our setting. For example, one may use a global test of independence between two sets of SNPs to decide whether the corresponding gene-gene interaction should be included in the subsequent association analysis.
In conclusion, the proposed method, given its efficiency, computational simplicity, and broad applicability, seems a promising approach for testing genetic association in the presence of gene-gene and gene-environment interactions. Future work is needed to develop and evaluate practical strategies for the applications of the methodology in large-scale association studies involving specific biologic pathways or the whole genome.
Acknowledgments
We thank Drs. Glen Satten and Alice Whittemore and two anonymous reviewers for their positive comments on an earlier version of this article. Resequencing of the GPX3 and GPX4 genes and genotyping assays for the NAT2 gene were performed at the Core Genotyping Facility at the NCI Advanced Technology Center, in Gaithersburg, MD.39 This research was supported by the Intramural Program of the National Institutes of Health.
Appendix A
Heuristic Derivation of Tukey’s 1-df Model of Interaction
Let  for j=1,2, and define the function
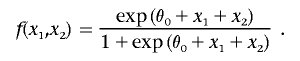 |
By substituting the regression formula for Z1 and Z2 (fig. 1, upper boxes) into the disease-risk model (lower box) and taking a Taylor’s series expansion, with respect to ε1 and ε2, one can write
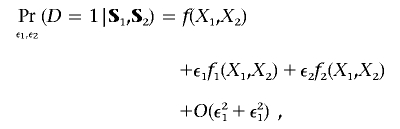 |
where fj(x1,x2)=∂f(x1,x2)/∂xj, j=1,2, and O(ε21+ε21) denotes a term that can be bounded above by K(ε21+ε21) for a suitable positive constant K. Noting that ε1 and ε2 are mean zero random variables (conditional on S1 and S2), we can write
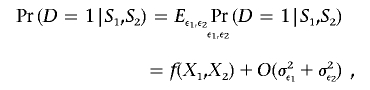 |
where σ2εj denotes the variance of εj and j=1,2. Thus, if σ2εj and j=1,2 are small, then Pr(D=1|S1,S2)≈f(X1,X2), which is precisely the model shown in equation (1), with α=θ0+θ*1μ1+θ*2μ2+θ12μ1μ2, βkjj=θ*jγkjj, kj=1,…,Kj;j=1,2, and θ=θ12/(θ*1×θ*2), where θ*j=θj+θ12μ3-j,j=1,2.
Log-Likelihood, Score Function, and Information Matrices
Let Pα,β1,β2;θ(S1,S2) denote Pr(D=1|S1,S2), as defined by the proposed model in equation (1). The log-likelihood of the data under case-control design can be written as
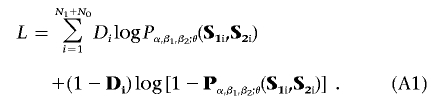 |
Under the null hypothesis that βk11=0 for all k1, the maximum-likelihood estimates of the parameters ψ=(α,β2), for each fixed value of θ, can be obtained by solving the score equation Sψ(ψ;θ)=0, where
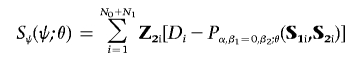 |
and Z2i=(1,ST2i)T. Note that the quantity Pα,β1,β2;θ does not depend on θ when β1=0, and Sψ(ψ;θ)≡Sψ(ψ) corresponds to standard logistic-regression score function that involves only main-effect terms for the marker SNPs in G2. Let the maximum-likelihood estimates of ψ under β1=0 be denoted by  . Further, let
  denote
  . Now, for a fixed value of θ, the score function for the association parameters βk11 and k1=1,…,K1, evaluated under the null hypothesis that βk11=0 for all k1, can be written in the form of equation (3).
Define Z2=(1,ST2) to be a design matrix associated with the standard logistic-regression analysis of the data that allows for the constant intercept term α and a main-effect term for each of the markers in G2. Ignoring terms with expectation zero, the formulae for the information matrices in equation (4), evaluated at β1=0 and  , can be written as
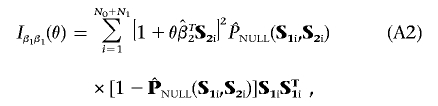 |
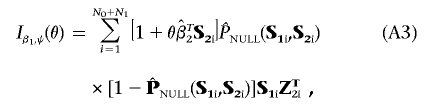 |
and
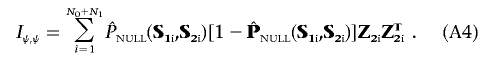 |
Efficient Score Function and Asymptotic Theory
Let Sβ1,i(θ) be the contribution of the i-th subject in the score vector Sβ1(θ) defined in equation (3). Similarly, let  be the contribution of the i-th subject to the score vector Sψ(ψ), evaluated at
  . Define iβ1,β1(θ), iβ1,ψ(θ), and iψ,ψ to be the asymptotic limits of the scaled information matrices N-1Iβ1β1(θ), N-1Iβ1ψ(θ), and N-1Iψ,ψ. By using a standard Taylor's series argument, one can represent the score vector Sβ1(θ) in its asymptotic form
 |
where Ui(θ) denotes the efficient influence function defined by
and op(1) represents the term that converges to zero in probability. On the basis of the standard central-limit theorem, one can then show that, for any fixed value of θ and under the null hypothesis of β1=0, N-1/2Sβ1(θ) converges to K1-variate normal distribution with zero mean and variance-covariance matrix given by iβ1,β1(θ)-iβ1,ψ(θ)i-1ψ,ψiβ1,ψ(θ)T. Moreover, on any given compact interval  for θ, the convergence of the score vector N-1/2Sβ1(θ) to the corresponding normal distribution can be shown to be uniform over θ. Thus, it follows that N-1/2Sβ1(θ), as a K1-dimensional stochastic process in θ, converges to a zero mean Gaussian process for which the covariance function for the pair of value (θ1,θ2) is given by the asymptotic limit of
  .
.
Web Resources
The URLs for data presented herein are as follows:
- NCI Advanced Technology Center, http://cgf.nci.nih.gov/
- Online Mendelian Inheritance in Man (OMIM), http://www.ncbi.nlm.nih.gov/Omim/ (for NAT2, GPX3, GPX4, and colorectal cancer)
References
- 1.Risch N, Merikangas K (1996) The future of genetic studies of complex human diseases. Science 273:1516–1517 10.1126/science.273.5281.1516 [DOI] [PubMed] [Google Scholar]
- 2.Risch NJ (2000) Searching for genetic determinants in the new millennium. Nature 405:847–856 10.1038/35015718 [DOI] [PubMed] [Google Scholar]
- 3.Cardon LR, Bell JI (2001) Association study designs for complex diseases. Nat Rev Genet 2:91–99 10.1038/35052543 [DOI] [PubMed] [Google Scholar]
- 4.Carlson CS, Eberle MA, Kruglyak LA, Nickerson DA (2004) Mapping complex disease loci in whole-genome association studies. Nature 429:446–452 10.1038/nature02623 [DOI] [PubMed] [Google Scholar]
- 5.Wang WYS, Barratt BJ, Clayton DG, Todd JA (2005) Genome-wide association studies: theoretical and practical concerns. Nat Rev Genet 6:109–118 10.1038/nrg1522 [DOI] [PubMed] [Google Scholar]
- 6.International HapMap Consortium (2003) The International HapMap Project. Nature 426:789–796 10.1038/nature02168 [DOI] [PubMed] [Google Scholar]
- 7.International HapMap Consortium (2005) A haplotype map of the human genome. Nature 437:1299–1320 10.1038/nature04226 [DOI] [PMC free article] [PubMed] [Google Scholar]
- 8.Sachidanandam R, Weissman D, Schmidt SC, Kakol JM, Stein LD, Marth G, Sherry S, et al (2001) A map of human genome sequence variation containing 1.42 million single nucleotide polymorphisms. Nature 409:928–933 10.1038/35057149 [DOI] [PubMed] [Google Scholar]
- 9.Hinds DA, Stuve LL, Nilsen GB, Halperin E, Eskin E, Ballinger DG, Frazer KA, Cox DR (2005) Whole-genome patterns of common DNA variation in three human populations. Science 307:1072–1079 10.1126/science.1105436 [DOI] [PubMed] [Google Scholar]
- 10.Johnson GC, Esposito L, Barratt BJ, Smith AN, Heward J, Genova GD, Ueda H, Cordell HJ, Eaves IA, Dudbridge F, Twells RC, Payne F, Hughes W, Nutland S, Stevens H, Carr P, Tuomilehto-Wolf E, Tuomilehto J, Gough SC, Clayton DG, Todd JA (2001) Haplotype tagging for the identification of common disease genes. Nat Genet 29:233–237 10.1038/ng1001-233 [DOI] [PubMed] [Google Scholar]
- 11.Stram DO, Haiman CA, Hirschhorn JN, Altshuler D, Kolonel LN, Henderson BE, Pike MC (2003) Choosing haplotype-tagging SNPs based on unphased genotype data using a preliminary sample of unrelated subjects with an example from the Multiethnic Cohort Study. Hum Hered 55:27–36 10.1159/000071807 [DOI] [PubMed] [Google Scholar]
- 12.Chapman JM, Cooper JD, Todd JA, Clayton DG (2003) Detecting disease associations due to linkage disequilibrium using haplotype tags: a class of tests and the determinants of statistical power. Hum Hered 56:18–31 10.1159/000073729 [DOI] [PubMed] [Google Scholar]
- 13.Carlson CS, Eberle MA, Rieder MJ, Yi Q, Kruglyak L, Nickerson DA (2004) Selecting a maximally informative set of single-nucleotide polymorphisms for association analyses using linkage disequilibrium. Am J Hum Genet 74:106–120 [DOI] [PMC free article] [PubMed] [Google Scholar]
- 14.Clayton DG, Chapman JM, Cooper J (2004) Use of unphased multilocus genotype data in indirect association studies. Genet Epidemiol 27:415–428 10.1002/gepi.20032 [DOI] [PubMed] [Google Scholar]
- 15.Fallin D, Cohen A, Essioux L, Chumakov I, Blumenfeld M, Cohen D, Schork NJ (2001) Genetic analysis of case/control data using estimated haplotype frequencies: application to APOE locus variation and Alzheimer’s disease. Genome Res 11:143–151 10.1101/gr.148401 [DOI] [PMC free article] [PubMed] [Google Scholar]
- 16.Schaid D, Rowland C, Tines D, Jacobson R, Poland G (2002) Score tests for association between traits and haplotypes when linkage phase is ambiguous. Am J Hum Genet 70:425–434 [DOI] [PMC free article] [PubMed] [Google Scholar]
- 17.Lander ES, Botstein D (1986) Strategies for studying heterogeneous genetic traits in humans by using a linkage map of restriction fragment length polymorphisms. Proc Natl Acad Sci USA 83:7353–7357 10.1073/pnas.83.19.7353 [DOI] [PMC free article] [PubMed] [Google Scholar]
- 18.Risch N (1990) Linkage strategies for genetically complex traits. I. Multilocus models. Am J Hum Genet 46:222–228 [PMC free article] [PubMed] [Google Scholar]
- 19.Schork NJ, Boehnke M, Terwilliger JD, Ott J (1993) Two-trait-locus linkage analysis: a powerful strategy for mapping complex genetic traits. Am J Hum Genet 53:1127–1136 [PMC free article] [PubMed] [Google Scholar]
- 20.Dupuis J, Brown PO, Siegmund D (1995) Statistical methods for linkage analysis of complex traits from high-resolution maps of identity by descent. Genetics 140:843–856 [DOI] [PMC free article] [PubMed] [Google Scholar]
- 21.Cordell HJ, Wedig GC, Jacobs KB, Elston RC (2000) Multilocus linkage tests based on affected relative pairs. Am J Hum Genet 66:1273–1286 [DOI] [PMC free article] [PubMed] [Google Scholar]
- 22.Gauderman WJ, Siegmund KD (2001) Gene-environment interaction and affected sib pair linkage analysis. Hum Hered 52:34–46 10.1159/000053352 [DOI] [PubMed] [Google Scholar]
- 23.Peng J, Tang HK, Siegmund D (2005) Genome scans with gene-covariate interaction. Genet Epidemiol 29:173–184 10.1002/gepi.20100 [DOI] [PubMed] [Google Scholar]
- 24.Ritchie MD, Hahn LW, Moore JH (2003) Power of multifactor dimensionality reduction for detecting gene-gene interactions in the presence of genotyping error, missing data, phenocopy, and genetic heterogeneity. Genet Epidemiol 24:150–157 10.1002/gepi.10218 [DOI] [PubMed] [Google Scholar]
- 25.Millstein J, Conti DV, Gilliland FD, Gauderman WJ (2006) A testing framework for identifying susceptibility genes in the presence of epistasis. Am J Hum Genet 78:15–27 [DOI] [PMC free article] [PubMed] [Google Scholar]
- 26.Tukey JW (1949) One degree of freedom for non-additivity. Biometrics 5:232–242 10.2307/3001938 [DOI] [Google Scholar]
- 27.Scheffe H (1959) The analysis of variance. John Wiley and Sons, New York, pp 129–134 [Google Scholar]
- 28.Hein D, Ferguson R, Doll M, Rustan T, Gray K (1994) Molecular genetics of human polymorphic N-acetyltransferase: enzymatic analysis of 15 recombinant wild-type, mutant, and chimeric NAT2 allozymes. Hum Mol Genet 3:729–734 [DOI] [PubMed] [Google Scholar]
- 29.Hein DW, Doll MA, Ferguson RJ (1995) Metabolic activation of carcinogenic arylamines by rapid acetylator, slow acetylator, and chimeric recombinant Syrian hamster NAT2 allozymes. Proc West Pharmacol Soc 38:59–62 [PubMed] [Google Scholar]
- 30.Lin DY, Zou F (2004) Assessing genomewide statistical significance in linkage studies. Genet Epidemiol 27:202–214 10.1002/gepi.20017 [DOI] [PubMed] [Google Scholar]
- 31.Hodge SE (1981) Some epistatic two-locus models of disease. I. Relative risks and identity-by-descent distributions in affected sib pairs. Am J Hum Genet 33:381–395 [PMC free article] [PubMed] [Google Scholar]
- 32.Moslehi R, Chatterjee N, Church TR, Chen J, Yeager M, Weissfield J, Hein DW, Hayes RB (2006) Cigarette smoking, N-acetyltransferase genes and the risk of advanced colorectal adenoma. Pharmacogenomics 7:819–829 10.2217/14622416.7.6.819 [DOI] [PubMed] [Google Scholar]
- 33.Hayes RB, Reding D, Kopp W, Subar AF, Bhat N, Rothman N, Caporaso N, Ziegler RG, Johnson CC, Weissfeld, Hoover RN, P PH, Palace C, Gohagan JK, Prostate Lung Colorectal and Ovarian Cancer Screening Trial Project Team (2000) Etiologic and early marker studies in the Prostate, Lung, Colorectal and Ovarian (PLCO) Cancer Screening Trial. Control Clin Trials 21:349S–355S 10.1016/S0197-2456(00)00101-X [DOI] [PubMed] [Google Scholar]
- 34.Hayes RB, Sigurdson A, Moore L, Peters U, Huang WY, Pinsky P, Reding D, Gelmann EP, Rothman N, Pfeiffer RM, Hoover RN, Berg CD, for the PLCO Trial Team (2005) Methods for etiologic and early marker investigations in the PLCO trial. Mutat Res 592:147–154 [DOI] [PubMed] [Google Scholar]
- 35.Schaid DJ, McDonnell SK, Hebbring SJ, Cunningham JM, Thibodeau SN (2005) Nonparametric tests of association of multiple genes with human disease. Am J Hum Genet 76:780–793 [DOI] [PMC free article] [PubMed] [Google Scholar]
- 36.Marchini J, Donnelly P, Cardon LR (2005) Genome-wide strategies for detecting multiple loci that influence complex diseases. Nat Genet 37:413–417 10.1038/ng1537 [DOI] [PubMed] [Google Scholar]
- 37.Thompson WD (1991) Effect modification and the limits of biological inference from epidemiologic data. J Clin Epidemiol 44:221–232 10.1016/0895-4356(91)90033-6 [DOI] [PubMed] [Google Scholar]
- 38.Pfeiffer RM, Gail MH (2003) Sample size calculations for population- and family-based case-control association studies on marker genotypes. Genet Epidemiol 25:136–148 10.1002/gepi.10245 [DOI] [PubMed] [Google Scholar]
- 39.Packer BR, Yeager M, Burdett L, Welch R, Beerman M, Qi L, Sicotte H, Staats B, Acharya M, Crenshaw A, Eckert A, Puri V, Gerhard D, Chanock SJ (2006) SNP500Cancer: a public resource for sequence validation, assay development, and frequency analysis for genetic variation in candidate genes. Nucleic Acids Res 34:D617–D621 10.1093/nar/gkj151 [DOI] [PMC free article] [PubMed] [Google Scholar]