

Abstract
Intravascular hemoglobin limits the amount of endothelial-derived nitric oxide (NO) available for vasodilation. Cell-free hemoglobin scavenges NO more efficiently than red blood cell encapsulated hemoglobin. Hemolysis has recently been suggested to contribute to endothelial dysfunction based on a mechanism of NO scavenging by cell-free hemoglobin. Although experimental evidence for this phenomenon has been presented, support from a theoretical approach has, until now, been missing. Indeed, due to the low amounts of cell-free hemoglobin present in these pathological conditions, the role of cell-free hemoglobin scavenging of NO in disease has been questioned. In this study, we model the effects of cell-free hemoglobin on NO bioavailability, focusing on conditions that closely mimic those under known pathological conditions. We find that as little as one micromolar cell-free intra-luminal hemoglobin (heme concentration) can significantly reduce NO bioavailability. In addition, extravasation of hemoglobin out of the lumen has an even greater effect. We also find that low hematocrit associated with anemia increases NO bioavailability but also leads to increased susceptibility to NO scavenging by cell-free hemoglobin. These results support the paradigm that cell-free hemoglobin released into plasma during intravascular hemolysis in human disease contributes to the experimentally observed reduction in NO bioavailability and endothelial dysfunction.
Keywords: red blood cell, sickle cell disease, vasodilation
Abbreviations: NO—Nitric oxide, Hb—Hemoglobin, RBC—Red blood cell, HBOC—Hemoglobin based oxygen carrier, Hct—Hematocrit, PNH—Paroxysmal nocturnal hemoglobinuria
Introduction
Nitric oxide (NO) is synthesized in endothelial cells by nitric oxide synthase and then diffuses to smooth muscle cells where it activates soluble guanylate cyclase, resulting in cyclic guanylyl monophosphate-dependent vasodilation [1–5]. In 1994, Lancaster pointed out that given the great efficiency that hemoglobin (Hb) reacts with NO (on the order of 107 M−1s−1) and the abundance of total red cell hemoglobin in blood (on the order of 10 mM in heme or 16 g/dL), it is difficult to understand how NO can function as the endothelium-dependent vasodilator [6]. The paradox surrounding how NO can escape Hb scavenging and function as the endothelium-derived relaxation factor is partially resolved by its compartmentalization in the red blood cell (RBC) [7–17]. Intraerythrocytic Hb scavenges NO less effectively than cell-free Hb due to (1) a cell-free zone that is created due to pressure/velocity gradients in laminar flow that result in the RBCs being pushed inward towards the center of the lumen so that the rate of NO uptake by RBCs is at least partially limited by the time it takes for NO to diffuse from the endothelium to the RBCs [8,10,11]; (2) an unstirred layer surrounding the RBCs, the diffusion through which also potentially decreases the overall NO uptake rate [7,14]; and, (3) a physical RBC membrane barrier that limits the rate that NO diffuses into the RBC [12,13,15,16,18,19]. The relative contribution of each of these mechanisms is currently under investigation [20]. Many theoretical studies and reviews have been conducted investigating the effects of RBC encapsulated Hb on NO bioavailability [21–26]. Here we focus on the particular effects of relatively small amounts of cell-free Hb.
The hypertension, increased systemic and pulmonary vascular resistance, morbidity and mortality associated with administration of hemoglobin-based oxygen carriers (HBOCs or “blood substitutes”) [27–43] has been widely attributed to the enhanced ability of cell-free Hb to scavenge NO. It should be pointed out that an additional mechanism for the vaso-pressor effect of HBOCs has been suggested in which enhanced or pre-mature oxygen delivery to the resistance arterioles results in systemic vasoconstriction [44,45]. Previous models of the effect of cell-free Hb on NO bioavailablity were developed in the context of HBOC administration [46,47]. In one study, the concentration of intraluminal HBOC was set at 1.5 mM in heme (2.4 g/dL Hb) and extravasation was varied from 0 to 100% with the lowest non-zero value being 0.3% (about 5 μM in heme) [47]. An increase in the rate of the reaction of the HBOC with NO was found to decrease the NO bioavailability and extravasation of 5% or more also lowered the concentration of NO at the smooth muscle [47]. In a more recent study, hemodilution from 45% hematocrit (Hct) to 15% Hct resulted in an increase in the steady state NO concentration ([NO]) at the smooth muscle from about 25 nM to 140 nM [46]. Addition of 3 mM cell-free Hb reduced this to 8 nM and extravasation of 100 μM further reduced this to 2 nM [46]. The authors concluded that most of the NO scavenging was due to that within the lumen [46]. It is not surprising that millimolar quantities of cell-free Hb would have a significant impact on NO bioavailability. On the other hand, the ability of small amounts of cell-free Hb (present for example in sickle cell disease) to affect NO bioavailbility (when there is so much more RBC encapsulated Hb present) has been questioned [48]. In this paper, we focus on the question of whether much smaller amounts of cell-free Hb that are found under pathological conditions would impact NO bioavailability.
Until recently, little attention has been paid to complications due to NO scavenging by cell-free Hb in hemolytic disease [49,50]. Patients with sickle cell disease have variable amounts of cell-free Hb in the plasma, ranging from about 0 to 20 μM (in heme) with an average of 4.2 ± 1.1 μM compared to 0.2 ± 0.1 μM for control normal volunteers [50]. This amount has been observed to increase several fold during sickle cell crisis [51,52]. Consistent with a study showing reduced NO responsiveness in rabbit tissues infused with 6 μM Hb [53], Reiter et al found that responsiveness to NO administration was blunted by 80% in patients with sickle cell anemia who had plasma heme concentrations greater than or equal to 6 μM [50]. Indeed, accumulating animal and human epidemiological evidence supports a role for hemolysis in the pathobiology of sickle cell disease and other hemolytic anemias [54–60]. Despite these data, this mechanism is not universally accepted - perhaps due to the traditional belief that anemia per se in sickle cell disease has few pathological consequences and skepticism that so little cell-free Hb could affect physiological function when compared to the vast quantities of RBC-encapsulated Hb [48,61]. Indeed, if a few micromolar cell-free Hb resulting from hemolysis contributes to the pathophysiology of hemolysis through a mechanism of NO scavenging, then cell-free hemoglobin should have a significant effect on NO bioavailability in the background of the ten millimolar or so RBC encapsulated Hb that is present within the vascular lumen. Therefore, the major goal of this study was to explore this question using a computational modeling approach. We find that the quantities of cell-free plasma Hb present in human disease exert a significant effect on NO bioavailability at the smooth muscle and this effect is largely determined by the ability of this hemoglobin to enter the cell-free zone and extravasate out of the vascular lumen.
Materials and Methods
We used a two-dimensional model for NO availability within blood vessels, taking into account the particulate nature of blood (Figure 1). Our model examines the production, diffusion, and consumption of NO in various compartments within the vascular area, including the intracellular space of the RBCs, the RBC membrane, the extracellular space in the vessel lumen surrounding the RBCs, a cell-free zone within the lumen, the endothelium around the blood vessel wall, and the surrounding smooth muscle cells. Modeling the RBCs as individual particles accounts for effects of the unstirred layer. Our modeling work is based on that developed by El-Farra et al. [18].
Figure 1.
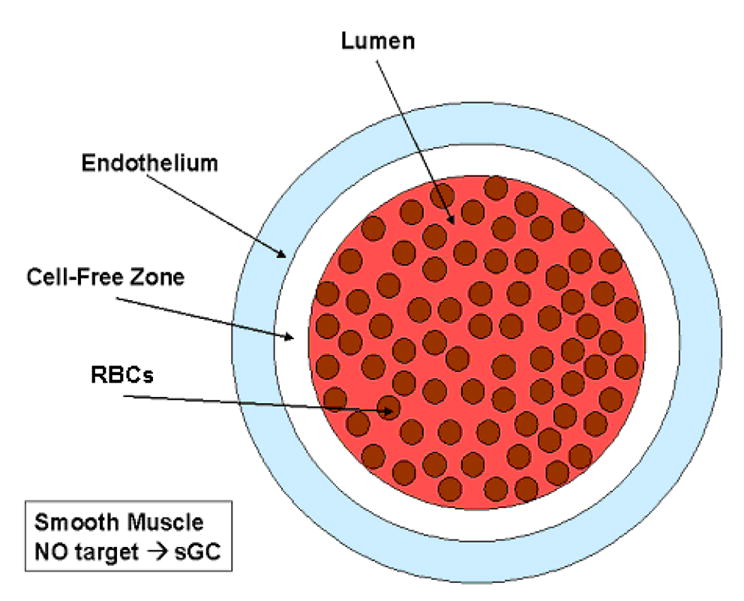
Illustration of regions modeled. RBCs are in the lumen of the blood vessel, which includes a red blood cell-free zone. NO is produced in the endothelium which is on the exterior of the blood vessel. The smooth muscle is the outermost layer around the blood vessel. The rate of NO production, scavenging, and diffusion is defined separately for each compartment as described in the materials and methods section. For example, Equation 4, only applies inside of the individual RBCs. This schematic of the modeled regions is not drawn to scale.
The production, transport, and consumption of NO within all the model compartments are governed by partial differential equations and boundary conditions based on values obtained experimentally. Based on El-Farra et al. [18], the following modeling assumptions are made: (1) transport of NO via convection is ignored (an assumption that has been rationalized previously [47]); (2) [NO] is at steady state; (3) the diffusion of NO is isotropic and the NO diffusion coefficient is the same in all directions within a given area; (4) the NO reaction with Hb dominates in the blood and is taken as a pseudo-first order reaction [62]; (5) the main reaction with NO in the smooth muscle is with oxygen and is second order, with a rate constant that combines all other reactions occurring in the tissue resulting in NO decomposition [62]; and lastly, (6) the production of NO in the endothelium is based on that found by Malinski et al. [63] and assumed to be constant [10,18].
Setting and ∇CNO · ν= 0 (assumptions (1) and (2)), the general mass balance equation for NO becomes,
| (1) |
where CNO is the NO concentration, DNO is the diffusion coefficient for NO, RNO is the rate of consumption or production of NO.
In our simulations, the reaction of NO in the smooth muscle area was based on the following second-order reaction,
| (2) |
where ksm is the rate constant for the reaction which factors in all reactions of NO within the smooth muscle and CNO refers to the concentration of NO. Similarly, the consumption rate of NO in the endothelium, Ren, is shown in Equation 3,
| (3) |
where QNO refers to the production of NO in the endothelium. The total production of NO in the endothelium was taken as 42.4 μM s−1.
Inside the RBCs, NO is consumed by Hb with a rate given by Equation 4,
| (4) |
where kHb is the rate constant of NO binding to oxyHb and CHb,RBC is the Hb concentration in the RBC. Note that this equation only applies inside the RBC. Also, it should be noted that in this paper, concentrations of Hb (and rate constants based on these concentrations) are presented in terms of the heme concentration. Conversion to other common units can be accomplished by noting that 10 mM in heme is equal to 2.5 mM in Hb tetramers or 16 g/dL. The concentration of hemoglobin in the RBC was taken as 20 or 23 mM. In calculations where 20 mM was used, no difference in the results was obtained if 23 mM was used instead. The intravascular Hb concentration (in heme) due to RBC encapsulated Hb is given by the product of the Hct and the intracellular Hb concentration (23 or 20 mM). In the extracellular space in the blood vessel lumen, where there is no Hb (simulations without hemolysis), RNO was set to zero. In cases evaluating hemolysis, where Hb is found outside the RBC in the blood vessel lumen, the rate in the lumen is given by Equation 5,
| (5) |
where CHb,lu refers to the concentration of cell-free Hb in the lumen of the blood vessel. The concentration of cell-free hemoglobin in the lumen was based upon values obtained for specific disease states such as sickle cell disease and paroxysmal nocturnal hemoglobinuria (PNH). These diseases were chosen as they reflect the extremes of pathophysiological hemolysis, with diseases such as thalassemia intermedia, malaria, thrombotic thrombocytopenic purpura, hemolytic uremic syndrome and conditions such as cardiopulmonary bypass falling within these ranges. Additionally, for cases involving extravasation of cell-free Hb into the interstitial space between the endothelium and smooth muscle, the expression for the rate is given by Equation 6,
| (6) |
in which Equation 3 has been modified to include the additional reaction of NO with cell-free Hb, where CHb,en is the concentration of cell-free Hb in the endothelium. The values for cell-free Hb extravasated into the interstitial space were also based on those found during hemolytic conditions. The amount of extravasated oxygenated Hb was assumed to be constant, despite depletion that may occur due to NO dioxygenation. Equation 6 is valid for a particular steady state condition that may vary over time according to rates of hemolysis/extravasation and Hb oxidation. For cases involving hemolytic diseased states, the concentration of Hb in RBCs corresponded to values found during those conditions.
NO can freely diffuse from the endothelium into either the smooth muscle area where it binds to its target, sGC, resulting in vasodilation or into the lumen of the blood vessel where it is scavenged by Hb. Within the blood vessel lumen, NO diffusion into the RBCs is limited by the permeability of the RBC membrane. The diffusion of NO through the RBC membrane is governed by Equation 7
| (7) |
where CNO,lu is the concentration of NO in the lumen, CNO,RBC is the concentration of NO inside the RBC, and Pmem is the membrane permeability of the RBC, defined as Pmem = Dmem/δRBC where Dmem is the diffusion coefficient and δRBC is the membrane thickness. Simulations were run comparing high and low permeability of the RBC membrane. The membrane permeability for cases evaluating high permeability was set to 9x105 μm−1 s−1 and that for low permeability was 450 μm−1 s−1. The following boundary equations were applied:
| (8) |
| (9) |
Modeling for all of the scenarios at steady state was performed using FEMLAB software (COMSOL Inc., Burlington, MA). The parameters, based on values from El-Farra et al. [18], that were used in the simulations are listed in Table 1. Values used in the simulations examining hemolysis and extravasation are listed in Table 2 [51,55,57,64–66]. The concentration of NO at a particular radial distance was found to be independent of the azimuthal angle chosen, based on calculations done along perpendindicular directions. In addition, placement of the RBCs did not significantly affect [NO] for the simulations we performed.
Table 1.
List of symbols, their meanings and values used in simulations of NO diffusion.
| Parameter | Symbol | Value |
|---|---|---|
| Extracellular NO diffusion coefficient | Dex | 3300 μm2s−1 |
| Intracellular NO diffusion coefficient | Din | 880 μm2s−1 |
| RBC membrane permeability- low | Plow | 450 μms−1 |
| RBC membrane permeability- high | Phi | 9x10⁵ μms−1 |
| NO reaction rate constant in Smooth Muscle & Endothelium | ksm | 0.05 μM−1s−1 |
| OxyHb-NO reaction rate constant | kHb | 8.9x10⁷ M−1s−1 |
| Total NO production rate | QNO | 42.4 μMs−1 |
| Hb concentration in RBC | CHb,RBC | 23 mM |
| Hb concentration in lumen | CHb,lu | 0 μM |
| Hb concentration in endothelium | CHb,en | 0 μM |
| Hct | Hct | 44, 45, 50 % |
| Blood vessel radius | R | 50 μm |
| Cell-free zone thickness | δ | 2.5 μm |
| Endothelium thickness | ɛ | 2.5 μm |
| Radius of RBC | a | 3.39 μm |
| RBC membrane thickness | δRBC | 0.0078 μm |
Table 2.
List of symbols, their meanings and values used in simulations of hemolytic conditions.
| Parameter | Symbol | Value |
|---|---|---|
| [Hb] in RBC | CHb,RBC | 20 mM |
| Cell-free [Hb]in lumen-SCD_Steady State | CHb,lu | 4, 25 μM |
| Cell-free [Hb] in lumen-SCD_Crisis | CHb,lu | 4, 25 μM |
| Cell-free [Hb] in lumen-PNH | CHb,lu | 30, 125, 625 μM |
| [Hb] in endothelium-SCD_Steady State | CHb,en | 1, 2, 3, 4, 5, 6, 7, 8, 9, 10 μM |
| [Hb] in endothelium-SCD_Crisis | CHb,en | 1, 2, 3, 4, 5, 6, 7, 8, 9, 10 μM |
| [Hb]in endothelium-PNH | CHb,en | 1, 2, 3, 4, 5, 6, 7, 8, 9, 10 μM |
| Hematocrit-SCD_Steady State | Hct | 25 % |
| Hematocrit-SCD_Crisis | Hct | 18 % |
| Hematocrit-PNH | Hct | 25 % |
Results
We first examined the effect of Hct on [NO] in the absence and presence of a red blood cell-free zone (Figure 2). The concentration of NO is plotted against the distance from the center of a 100 μm diameter vessel. The concentration of NO in the lumen is virtually zero, and it then goes up rapidly at the endothelial layer. As the distance from the center of the vessel increases further, the [NO] decreases. We conducted simulations at three Hcts: 45%, 25%, and 18% which represent those under normal physiology, and sickle cell disease during steady state and crisis respectively [51,57,65]. As the Hct increases the [NO] decreases at all blood vessel locations. We also find that the [NO] is higher when there is a cell-free zone than when it is absent, consistent with earlier work [8,10,11]. As it is widely believed that a cell-free zone is present in arterioles in vivo, all our subsequent simulations included the cell-free zone.
Figure 2.
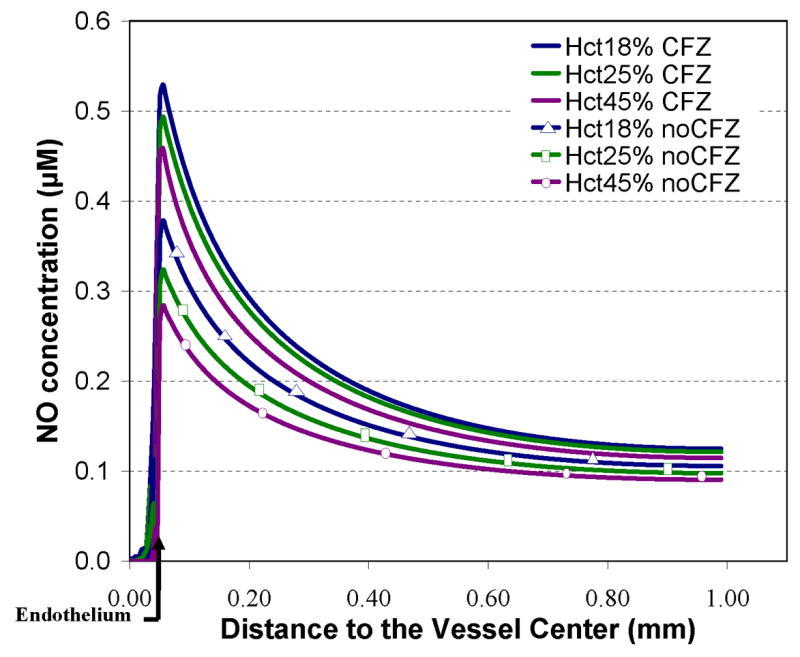
NO bioavailability dependence on hematocrit and cell-free zone. Calculated NO concentrations versus the distance from the center of the blood vessel are plotted for Hct values of 18%, 25%, and 45% with and without a cell-free zone. The position of the endothelium is shown by the bent arrow at 0.05 mm. A 2.5 μm thick region in the vessel closest to the endothelium was free of red blood cells in the cases having a cell-free zone indicated by solid lines. RBCs were placed within the 2.5 μm region for the scenarios without a cell-free zone indicated by solid lines with markers. Total Hb in the lumen due to RBCs was set to 4.14 mM for 18% Hct, 5.75 mM for 25% Hct, and 10.35 mM for 45%. NO was produced at a rate of 42.4 μM s−1 in the endothelium. The RBC Pm was set to 450 μms−1.
Figure 3 shows the effects of RBC membrane permeability and the presence of cell-free Hb on the concentration of NO along the vessel axis. The addition of cell-free Hb (as would occur in hemolysis) dramatically reduces [NO]. Even 1 μM cell-free Hb (in heme) has a significant effect. The addition of as little as 4 μM cell-free Hb reduces the peak [NO] to 0.14 μM from 0.46 μM (the value with no cell-free Hb and low RBC permeability). At low concentrations of cell-free Hb, we found that an increase in membrane permeability leads to a decrease in [NO], as previously demonstrated by El-Farra et al [18]. However, for cell-free Hb concentrations of 4 μM, the effect of the RBC membrane permeability is imperceptible, and at cell-free Hb concentrations of 5 μM or higher, the effect of the RBC membrane permeability is virtually eliminated (curves representing results from calculations with high and low permeability overlay each other). We believe at concentrations of 4 μM cell-free Hb and above, the scavenging of NO is due solely to cell-free Hb within the cell-free zone and is no longer dependent upon Hb encapsulated in RBCs. These scenarios were performed with values shown in Table 1 using physiological values for intracellular Hb concentration of 23 mM and 44% Hct. In simulations where a cell-free zone was not applied, the effect of cell-free Hb was significant, but not as great as when a cell free zone was present (data not shown). For example with RBCs with low permeability at a Hct of 45% and no cell-free zone, the peak [NO] fell from 0.28 μM to 0.16 μM upon adding 4 μM cell-free Hb.
Figure 3.
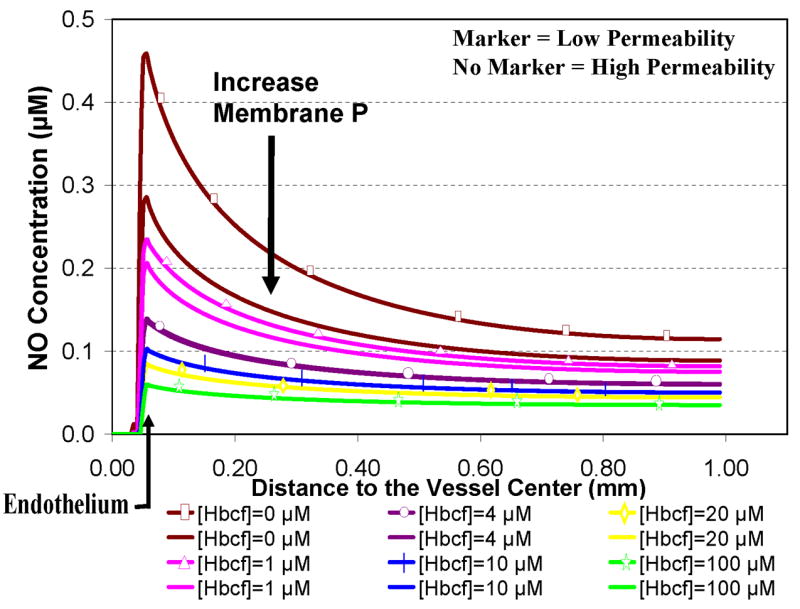
Effect of RBC membrane permeability and cell-free Hb on [NO]. Concentrations of NO for high and low cell membrane permeability at 44% Hct are plotted versus the distance along the vessel axis. The permeability of the cell membrane was set to 9 × 105 μm s−1 for high permeability (solid lines with no markers) and to 450 μm s−1 for low permeability (solid lines with markers). Concentrations of cell-free Hb ([Hbcf]) were 0, 1, 4, 10, 20, and100 μM (a single color was used for each concentration of cell-free Hb for both high and low permeability). Total RBC encapsulated Hb in the lumen was 10 mM. A 2.5 μm cell free zone was included in these and all subsequent computations, however cell-free Hb was allowed to enter this region. The effect of the RBC membrane permeability on NO levels is imperceptible at a cell-free Hb concentration of 4 μM and virtually eliminated for cases with concentrations of 5 μM cell-free Hb and above.
Simulations to examine the effects of cell-free Hb on NO bioavailability were performed using Hcts and concentrations of cell-free Hb found in specific hemolytic conditions, as described in Table 2. A particular aspect that we explored was the effect of Hb extravasation in these hemolytic conditions. Since the general shape of the curves plotting [NO] vs distance from the center of the vessel are fairly constant (Figures 2 and 3), in order to more clearly present the results, we plot the [NO] in these hemolytic conditions at a given distance from the center of the vessel vs concentration of extravasated Hb. Figure 4 shows the concentration of NO calculated at a) 55.6 μm (in or near the smooth muscle layer), b) 500 μm, and c) 975 μm from the center of the blood vessel as a function of extravasated Hb (0 to 10 μM). Three different Hcts were evaluated (18%, 25%, and 50%) with two values of cell free Hb, 4 μM and 25 μM (the range in sickle cell disease). The results for a Hct of 25% and 4 μM cell-free Hb were chosen because they represent median conditions during steady state in patients with sickle cell disease [51,57,65]. During crisis, cell-free Hb levels range from 0.62 μM up to 20 μM, and can exceed 25 μM, while Hct values decrease to 18% [51,57,65]. We chose to model sickle cell crisis using 25 μM cell-free Hb and a Hct of 18%. The computations at 50% Hct (normal) are shown for comparison. In cases where there is no cell free Hb, lower Hct results in higher [NO] (Figure 2). However, in the computations with either 4 μM or 25 μM cell-free Hb (Figure 4), varying Hct did not effect [NO]; all curves at different Hcts but the same cell-free Hb concentration overlapped each other. This result is illustrated clearly in Figure 4b where the [NO] at 55.6 μm is plotted for different Hcts in the presence of 4 μM and 25 μM cell-free Hb in the absence of extravasation. The concentration of NO for each Hct is the same. This is probably due to the fact that the cell-free Hb scavenges most of the luminal NO before it can get out of the cell-free zone. As the concentration of extravasated Hb increased, the [NO] decreased at all distances from the center of the vessel. Remarkably, even the addition of only 1 μM Hb outside the lumen reduces NO levels reaching the smooth muscle. The data also show that as the concentration of extravasated Hb increases, the effect of the amount of cell-free Hb in the lumen on [NO] decreases; the curves representing different concentrations of cell-free Hb approach each other. Comparing panels a, c, and d, we note that, for low amounts of extravasation, the effect of the concentration of cell-free Hb (4 μM vs 25 μM) on [NO] is greatest closest to the smooth muscle.
Figure 4.
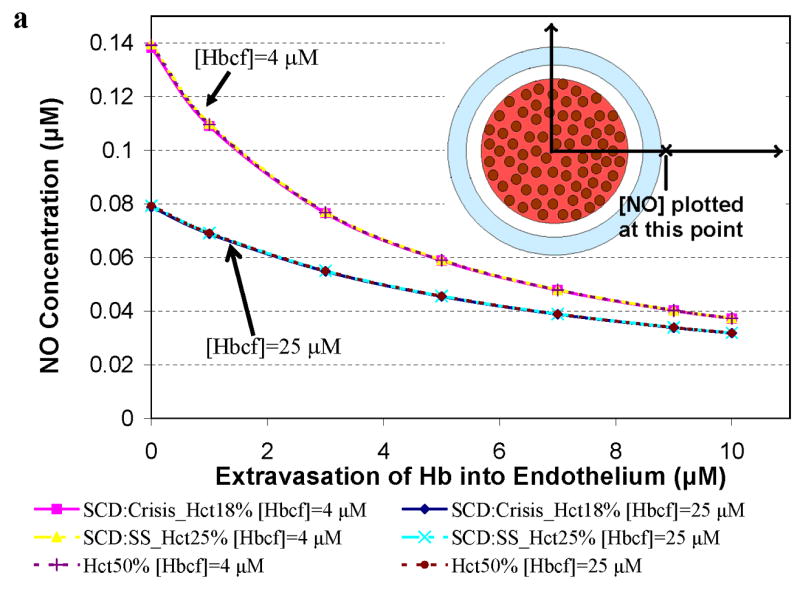
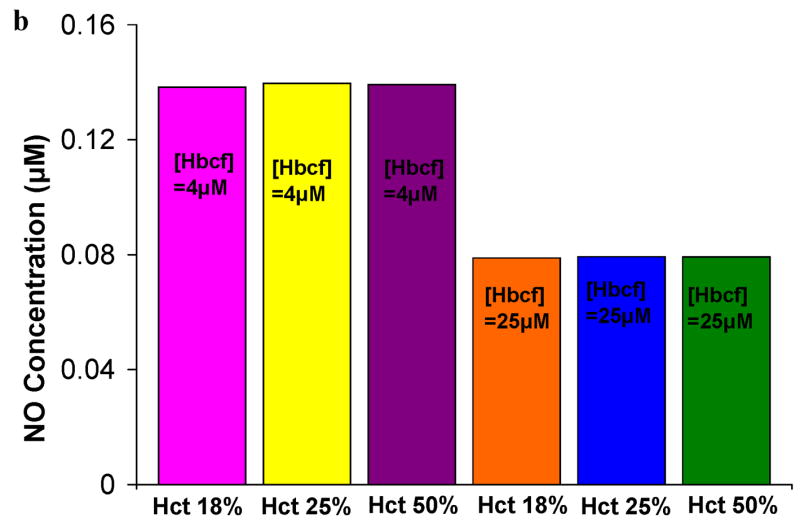
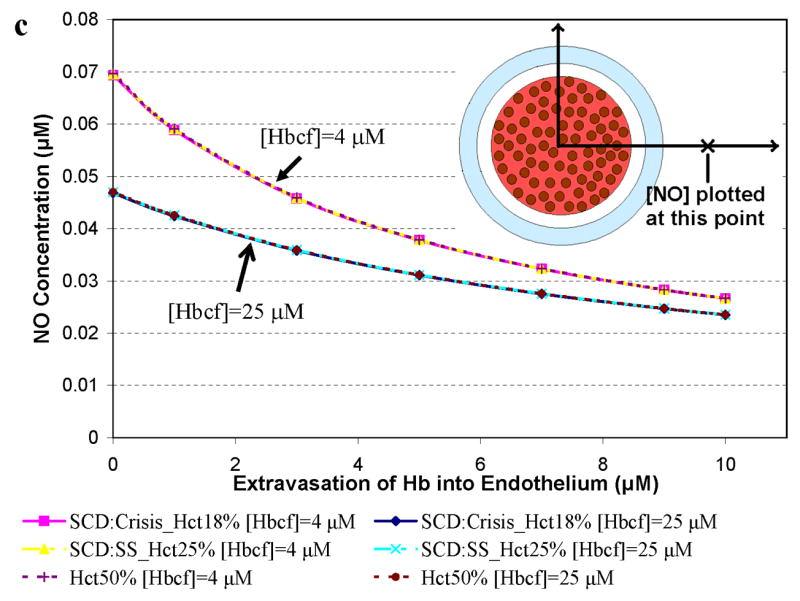
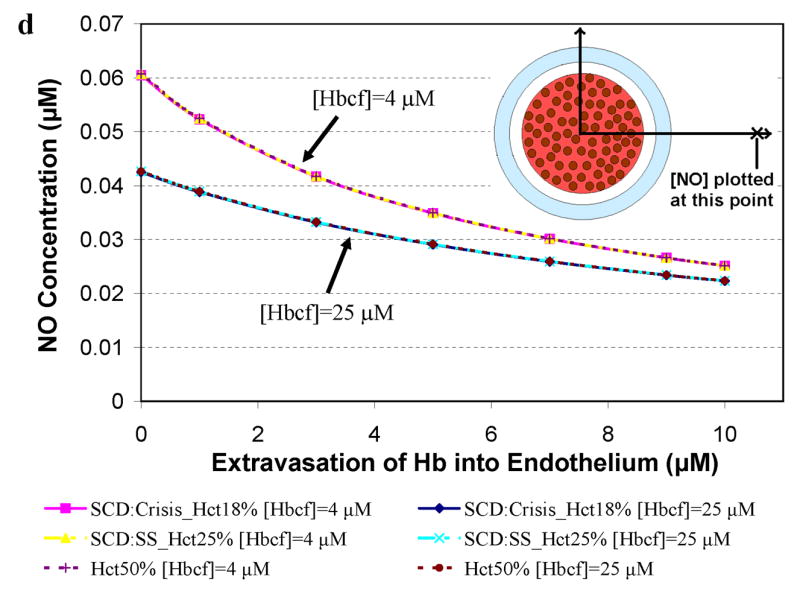
Concentration of NO as a function of extravasated cell-free Hb for conditions present in sickle cell disease. The concentrations of NO at particular distances from the center of the vessel are plotted as a function of extravasated Hb. Hematocrits of 18% and 25% correspond to values found during crisis and steady state in SCD, respectively. A Hct of 50% was used for comparison to normal physiology. Cell-free Hb concentrations ([Hbcf]) were set to 4 and 25 μM. a) NO concentrations at 55.6 μm from the center of the blood vessel. Results for 18% Hct (pink square), 25% Hct (yellow triangle), and 50% (purple plus sign) with 4 μM cell-free Hb were the same so that curves representing these overlap each other. Results for 18% Hct (blue diamond), 25% Hct (teal x), and 50% (red circle) with 25 μM cell-free Hb also lead to the same levels of NO as each other and thus overlap. b) the concentration of NO at 55.6 μm in the absence of extravasation with 4 and 25 μM cell-free Hb is plotted at different Hcts (18%, 25%, and 50%). c) NO concentrations at 500 μm from the center of the blood vessel versus concentration of cell-free Hb extravasated. d) NO concentrations at 975 μm from the center of the blood vessel versus concentration of cell-free Hb extravasated for the above conditions. Insets: illustration of the position where [NO] was measured (refer to Figure 1 for labeled regions). Insets are not drawn to scale.
Figure 5 presents results for computations relevant to paroxysmal nocturnal hemoglobinuria where 25% Hct and very high levels of cell-free Hb (30 μM to 625 μM, Table 2) are reported [57,64,66]. The concentration of NO was calculated at a) 55.6 μm (in or near the smooth muscle layer), b) 500 μm, and c) 975 μm from the center of the blood vessel as a function of extravasated Hb. A Hct of 25% was chosen to represent PNH and results for 50% Hct are shown for comparison. Concentrations of cell-free Hb studied were 30 μM, 125 μM, and 625 μM. Similar dependencies of [NO] on Hct in the presence of cell-free Hb, degree of extravasation, and distance from the center of the vessel as those observed in Figure 4 are present in Figure 5. In the case of high amounts of cell-free Hb representing those in PNH, NO bioavailability is greatly reduced (Figure 5) even compared to that found in simulations representing sickle cell disease (Figure 4).
Figure 5.
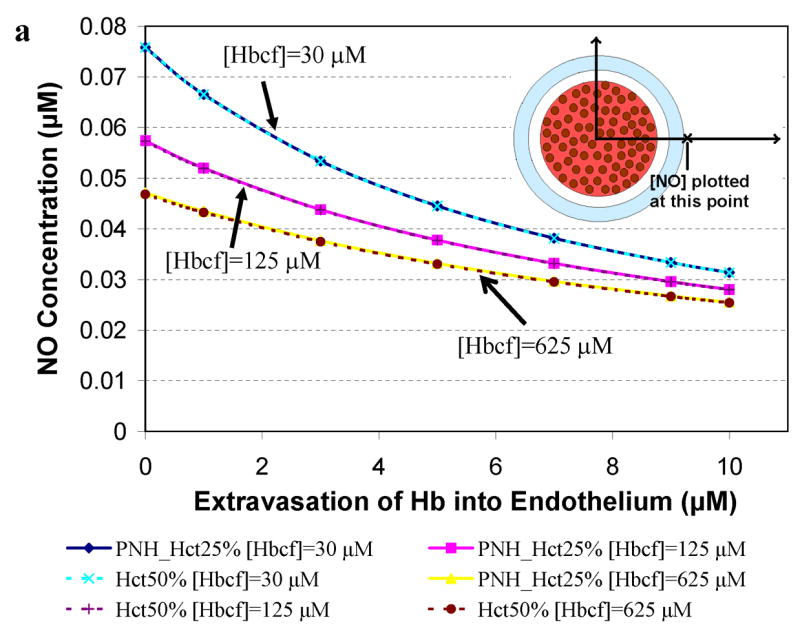
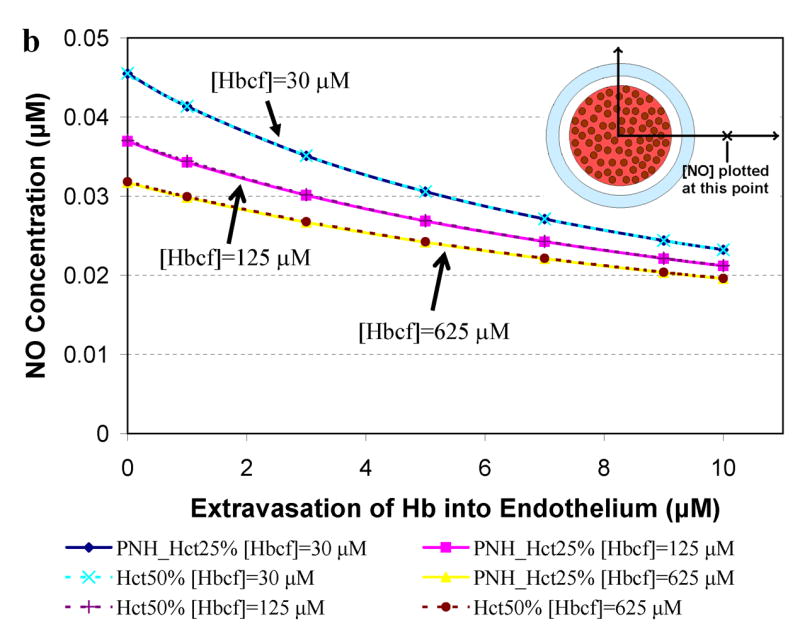
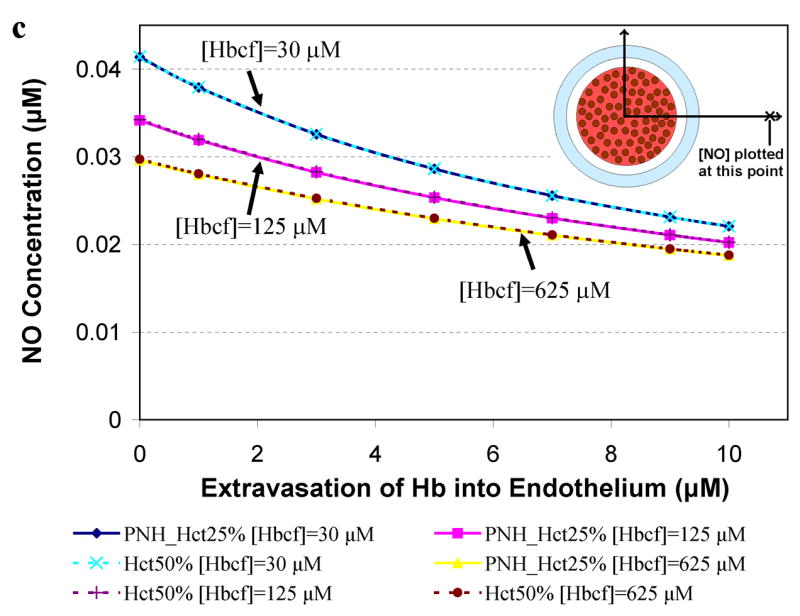
Concentration of NO as a function of extravasated cell-free Hb for conditions present in paroxysmal nocturnal hemoglobinuria. The concentrations of NO at particular distances from the center of the vessel are plotted as a function of extravasated Hb. Cell-free Hb concentrations ([Hbcf]) were set to 30, 125, and 625 μM and concentrations of cell-free Hb extravasated into the endothelium ranged from 0–10 μM for 25% Hct. A Hct of 50%, found under normal conditions, was used for comparison. a) NO concentrations at 55.6 μm from the center of the blood vessel are shown. Curves using 25% Hct (blue diamond) and 50% Hct (teal x) with 30 μM cell-free Hb overlap each other. Curves using 25% Hct (pink square) and 50% Hct (purple plus sign) with 125 μM cell-free Hb also lead to the same levels of NO. Similarly, 25% Hct (yellow triangle) and 50% Hct (red circle) with 625 μM cell-free Hb give rise to the same concentrations of NO. b) NO concentrations at 500 μm from the center of the blood vessel versus concentration of cell-free Hb extravasated. c) NO concentrations at 975 μm from the center of the blood vessel versus concentration of cell-free Hb extravasated. Insets: illustration of the position where [NO] was measured (refer to Figure 1 for labeled regions). Insets are not drawn to scale.
Discussion
Our results provide theoretical support for the notion that cell-free Hb present in hemolytic anemias, effectively scavenges NO, even when the amount of cell-free Hb is much less than in the RBC compartment. Thus our work is consistent with studies suggesting that reduced NO bioavailability contributes to the pathology of hemolytic anemias and that hemolysis is a mechanism for endothelial dysfunction [54–58,60]. Our work predicts that as little as 1 μM cell-free Hb, even in the presence of many millimolar RBC encapsulated Hb, significantly reduces the amount of NO reaching the smooth muscle, thereby potentially effecting vasodilation.
The role of the RBC NO permeability in effecting NO bioavailability is a matter of debate [9,12,14–17,20,67]. We showed that when concentrations of 4 μM cell-free Hb or more are present in the lumen, variations in the permeability of the RBC membrane no longer affect NO bioavailability (Figure 3). We believe that, at this point, the RBC encapsulated Hb (about 10 mM intravascular Hb for 44% Hct and 23 mM intraerythrocytic Hb) does not effectively scavenge NO; all scavenging is due to the micromolar levels of cell-free Hb present in the plasma. Lowering the hematocrit leads to an increase in NO levels. However, at low Hcts, the system is more sensitive to small amounts of cell-free Hb. Low concentrations of cell-free Hb, which occur during hemolysis, have a greater effect on NO bioavailability at these low hematocrits.
The most relevant condition that modulates vasodilation is the [NO] at the smooth muscle layer, which coincides approximately with the peak [NO] found in our calculations. In our model of steady state in sickle cell disease (using 4 μM cell-free Hb), we find that, even in the absence of extravasation, the peak [NO] falls to 0.14 μM (Figure 4a) compared to about 0.5 μM that would be present at an equivalent Hct with no hemolysis (Figure 2). In crisis (using 25 μM cell-free Hb), the peak [NO] falls to 0.08 μM (Figure 4a), even in the absence of extravasation. Extravasation further exacerbates NO scavenging (Figures 4 and 5). Peak levels calculated in our models of PNH are even lower than those modeled during sickle cell vaso-occlusive crisis.
Our results using rigorous modeling involving numerical methods are consistent with rough but simpler calculations. The amount of NO that makes it to the smooth muscle depends partially on the rate that it is consumed in the lumen. The cell-free zone plays a large role in decreasing this rate of consumption[8,11,62]. If we assume NO scavenging by RBCs occurs at a rate of 105 M−1s−1 (about 500 times slower than the NO scavenging rate for cell-free Hb) and that there is 10 mM intravascular Hb in the blood (at 44% Hct), the half-life of NO in the absence of a cell-free zone would be about 1 millisecond. However, using the relation that distance is equal to the square root of the diffusion constant multiplied by the time, and taking a diffusion constant of 3300 μm2s−1 for NO, we see that it would take on the order of 2 milliseconds for NO to get from the endothelium to the red blood cell across a 2.5 μm cell-free zone. This time to diffuse to the cell-free zone significantly adds to the lifetime of NO in the lumen showing that the cell-free zone is very effective in reducing NO scavenging in the lumen and facilitating NO reaching the smooth muscle. Now if we have 4 μM cell-free Hb in the lumen (which is not restricted to the cell-free zone), it will scavenge NO at a rate of (9 × 10⁷ M−1s−1)(4 × 10⁻⁶ M) so the half life is about two milliseconds, about the time it takes for NO to diffuse to the cell-free zone from the endothelium. Thus, essentially all endothelial-derived NO would be scavenged by this 4 μM cell-free Hb in the cell-free zone, consistent with our results.
In corroboration of our modeling results, the levels of NO found under normal physiological conditions in our calculations are similar to perivascular levels measured experimentally in hamsters (0.6 μM [68]) and rats (0.3 μM [69]). Differences between our calculated values (which were based on experimentally determined parameters) and the experimental literature values may be due to the species studied or some limitations of our model.
The amount of NO that is necessary for optimal activation of sGC is not firmly established but the range of values are from tens to a few hundreds nanomolar [46,70–74]. Comparisons between our calculated values and these levels necessary for optimal sGC activation may be an over-extension of our results. However, our data certainly suggest that levels of hemolysis under pathological conditions could reduce [NO] below the level needed to sufficiently activate sGC, consistent with experimental evidence [54–58,60].
In summary, we have provided theoretical support for the notion that even small amounts of cell-free Hb (compared to that encapsulated by RBCs), as is present in sickle disease and other hemolytic anemias, can significantly affect NO bioavailability.
Footnotes
This work was supported by NIH grant HL58091 (DK-S). Further support is acknowledged through Career Award K02 HL078706 (DK-S).
References
- 1.Furchgott RF, Zawadzki JV. The Obligatory Role of Endothelial-Cells in the Relaxation of Arterial Smooth-Muscle by Acetylcholine. Nature. 1980;288:373–376. doi: 10.1038/288373a0. [DOI] [PubMed] [Google Scholar]
- 2.Ignarro LJ, Byrns RE, Buga GM, Wood KS. Endothelium-Derived Relaxing Factor from Pulmonary-Artery and Vein Possesses Pharmacological and Chemical-Properties Identical to Those of Nitric-Oxide Radical. Circ Res. 1987;61:866–879. doi: 10.1161/01.res.61.6.866. [DOI] [PubMed] [Google Scholar]
- 3.Katsuki S, Arnold W, Mittal C, Murad F. Stimulation of Guanylate Cyclase by Sodium Nitroprusside, Nitroglycerin and Nitric-Oxide in Various Tissue Preparations and Comparison to Effects of Sodium Azide and Hydroxylamine. J Cyclic Nucleotide Res. 1977;3:23–35. [PubMed] [Google Scholar]
- 4.Palmer RMJ, Ferrige AG, Moncada S. Nitric-Oxide Release Accounts for the Biological-Activity of Endothelium-Derived Relaxing Factor. Nature. 1987;327:524–526. doi: 10.1038/327524a0. [DOI] [PubMed] [Google Scholar]
- 5.Ignarro LJ. Nitric Oxide Biology and Pathobiology. San Diego: Academic press; 2000. [Google Scholar]
- 6.Lancaster JR. Simulation of the Diffusion and Reaction of Endogenously Produced Nitric-Oxide. Proc Natl Acad Sci USA. 1994;91:8137–8141. doi: 10.1073/pnas.91.17.8137. [DOI] [PMC free article] [PubMed] [Google Scholar]
- 7.Coin JT, Olson JS. Rate of Oxygen-Uptake by Human Red Blood-Cells. J Biol Chem. 1979;254:1178–1190. [PubMed] [Google Scholar]
- 8.Butler AR, Megson IL, Wright PG. Diffusion of nitric oxide and scavenging by blood in the vasculature. Biochim Biophys Acta. 1998;1425:168–176. doi: 10.1016/s0304-4165(98)00065-8. [DOI] [PubMed] [Google Scholar]
- 9.Liu XP, Miller MJS, Joshi MS, Sadowska-Krowicka H, Clark DA, Lancaster JR. Diffusion-limited reaction of free nitric oxide with erythrocytes. J Biol Chem. 1998;273:18709–18713. doi: 10.1074/jbc.273.30.18709. [DOI] [PubMed] [Google Scholar]
- 10.Vaughn MW, Kuo L, Liao JC. Effective diffusion distance of nitric oxide in the microcirculation. Am J Physiol-Heart Circul Physiol. 1998;43:H1705–H1714. doi: 10.1152/ajpheart.1998.274.5.H1705. [DOI] [PubMed] [Google Scholar]
- 11.Liao JC, Hein TW, Vaughn MW, Huang KT, Kuo L. Intravascular flow decreases erythrocyte consumption of nitric oxide. Proc Natl Acad Sci USA. 1999;96:8757–8761. doi: 10.1073/pnas.96.15.8757. [DOI] [PMC free article] [PubMed] [Google Scholar]
- 12.Vaughn MW, Huang KT, Kuo L, Liao JC. Erythrocytes possess an intrinsic barrier to nitric oxide consumption. J Biol Chem. 2000;275:2342–2348. doi: 10.1074/jbc.275.4.2342. [DOI] [PubMed] [Google Scholar]
- 13.Vaughn MW, Huang KT, Kuo L, Liao JC. Erythrocyte consumption of nitric oxide: Competition experiment and model analysis. Nitric Oxide-Biol Ch. 2001;5:18–31. doi: 10.1006/niox.2000.0328. [DOI] [PubMed] [Google Scholar]
- 14.Liu XP, Samouilov A, Lancaster JR, Zweier JL. Nitric oxide uptake by erythrocytes is primarily limited by extracellular diffusion not membrane resistance. J Biol Chem. 2002;277:26194–26199. doi: 10.1074/jbc.M201939200. [DOI] [PubMed] [Google Scholar]
- 15.Huang KT, Han TH, Hyduke DR, Vaughn MW, Van Herle H, Hein TW, Zhang CH, Kuo L, Liao JC. Modulation of nitric oxide bioavailability by erythrocytes. Proc Natl Acad Sci USA. 2001;98:11771–11776. doi: 10.1073/pnas.201276698. [DOI] [PMC free article] [PubMed] [Google Scholar]
- 16.Han TH, Liao JC. Erythrocyte nitric oxide transport reduced by a submembrane cytoskeletal barrier. Biochim Biophys Acta. 2005;1723:135–142. doi: 10.1016/j.bbagen.2005.01.013. [DOI] [PubMed] [Google Scholar]
- 17.Azarov I, Huang KT, Basu S, Gladwin MT, Hogg N, Kim-Shapiro DB. Nitric oxide scavenging by red blood cells as a function of hematocrit and oxygenation. J Biol Chem. 2005;280:39024–38032. doi: 10.1074/jbc.M509045200. [DOI] [PubMed] [Google Scholar]
- 18.El-Farra NH, Christofides PD, Liao JC. Analysis of nitric oxide consumption by erythrocytes in blood vessels using a distributed multicellular model. Ann Biomed Eng. 2003;31:294–309. doi: 10.1114/1.1553454. [DOI] [PubMed] [Google Scholar]
- 19.Han TH, Qamirani E, Nelson AG, Hyduke DR, Chaudhuri G, Kuo L, Liao JC. Regulation of nitric oxide consumption by hypoxic red blood cells. Proc Natl Acad Sci USA. 2003;100:12504–12509. doi: 10.1073/pnas.2133409100. [DOI] [PMC free article] [PubMed] [Google Scholar]
- 20.Kim-Shapiro DB, Schechter AN, Gladwin MT. Unraveling the Reactions of Nitric Oxide, Nitrite, and Hemoglobin in Physiology and Therapeutics. Arterioscler Thromb Vasc Biol. 2006;26:697–705. doi: 10.1161/01.ATV.0000204350.44226.9a. [DOI] [PubMed] [Google Scholar]
- 21.Lancaster JR. Diffusion of free nitric oxide. Nitric Oxide, Pt a - Sources and Detection of No; No Synthase. Vol 268. 1996. pp. 31–50. [DOI] [PubMed] [Google Scholar]
- 22.Buerk DG. Can we model nitric oxide biotransport? A survey of mathematical models for a simple diatomic molecule with surprisingly complex biological activities. Annu Rev Biomed Eng. 2001;3:109–143. doi: 10.1146/annurev.bioeng.3.1.109. [DOI] [PubMed] [Google Scholar]
- 23.Wood J, Garthwaite J. Models of the Diffusional Spread of Nitric-Oxide - Implications for Neural Nitric-Oxide Signaling and Its Pharmacological Properties. Neuropharmacology. 1994;33:1235–1244. doi: 10.1016/0028-3908(94)90022-1. [DOI] [PubMed] [Google Scholar]
- 24.Regirer SA, Shadrina NK. Mathematical models of nitric oxide transport in a blood vessel. Biofizika+ 2005;50:515–536. [PubMed] [Google Scholar]
- 25.Kavdia M, Popel AS. Venular endothelium-derived NO can affect paired arteriole: a computational model. Am J Physiol-Heart Circul Physiol. 2006;290:H716–H723. doi: 10.1152/ajpheart.00776.2005. [DOI] [PubMed] [Google Scholar]
- 26.Zhang WS, Pibulsonggram T, Edwards A. Determinants of basal nitric oxide concentration in the renal medullary microcirculation. American Journal of Physiology-Renal Physiology. 2004;287:F1189–F1203. doi: 10.1152/ajprenal.00125.2004. [DOI] [PubMed] [Google Scholar]
- 27.Ulatowski JA, Koehler RC, Nishikawa T, Traystman RJ, Razynska A, Kwansa H, Urbaitis B, Bucci E. Role of Nitric-Oxide Scavenging in Peripheral Vasoconstrictor Response to Beta-Beta Cross-Linked Hemoglobin. Artif Cell Blood Sub. 1995;23:263–269. doi: 10.3109/10731199509117942. [DOI] [PubMed] [Google Scholar]
- 28.Vogel WM, Dennis RC, Cassidy G, Apstein CS, Valeri CR. Coronary Constrictor Effect of Stroma-Free Hemoglobin-Solutions. Am J Physiol. 1986;251:H413–H420. doi: 10.1152/ajpheart.1986.251.2.H413. [DOI] [PubMed] [Google Scholar]
- 29.Hess JR, Macdonald VW, Brinkley WW. Systemic and Pulmonary-Hypertension after Resuscitation with Cell-Free Hemoglobin. J Appl Physiol. 1993;74:1769–1778. doi: 10.1152/jappl.1993.74.4.1769. [DOI] [PubMed] [Google Scholar]
- 30.Lee R, Neya K, Svizzero TA, Vlahakes GJ. Limitations of the Efficacy of Hemoglobin-Based Oxygen-Carrying Solutions. J Appl Physiol. 1995;79:236–242. doi: 10.1152/jappl.1995.79.1.236. [DOI] [PubMed] [Google Scholar]
- 31.Murray JA, Ledlow A, Launspach J, Evans D, Loveday M, Conklin JL. The Effects of Recombinant Human Hemoglobin on Esophageal Motor Function in Humans. Gastroenterology. 1995;109:1241–1248. doi: 10.1016/0016-5085(95)90584-7. [DOI] [PubMed] [Google Scholar]
- 32.Ulatowski JA, Nishikawa T, MathesonUrbaitis B, Bucci E, Traystman RJ, Koehler RC. Regional blood flow alterations after bovine fumaryl beta beta-crosslinked hemoglobin transfusion and nitric oxide synthase inhibition. Crit Care Med. 1996;24:558–565. doi: 10.1097/00003246-199604000-00003. [DOI] [PubMed] [Google Scholar]
- 33.Sloan EP, Koenigsberg M, Gens D, Cipolle M, Runge J, Mallory MN, Rodman G. Diaspirin cross-linked hemoglobin (DCLHb) in the treatment of severe traumatic hemorrhagic shock - A randomized controlled efficacy trial. Jama-J Am Med Assoc. 1999;282:1857–1864. doi: 10.1001/jama.282.19.1857. [DOI] [PubMed] [Google Scholar]
- 34.Dou Y, Maillett DH, Eich RF, Olson JS. Myoglobin as a model system for designing heme protein based blood substitutes. Biophys Chem. 2002;98:127–148. doi: 10.1016/s0301-4622(02)00090-x. [DOI] [PubMed] [Google Scholar]
- 35.Doherty DH, Doyle MP, Curry SR, Vali RJ, Fattor TJ, Olson JS, Lemon DD. Rate of reaction with nitric oxide determines the hypertensive effect of cell-free hemoglobin. Nature Biotechnology. 1998;16:672–676. doi: 10.1038/nbt0798-672. [DOI] [PubMed] [Google Scholar]
- 36.Olson JS, Foley EW, Rogge C, Tsai AL, Doyle MP, Lemon DD. No scavenging and the hypertensive effect of hemoglobin-based blood substitutes. Free Radic Biol Med. 2004;36:685–697. doi: 10.1016/j.freeradbiomed.2003.11.030. [DOI] [PubMed] [Google Scholar]
- 37.Patel RP. Biochemical aspects of the reaction of hemoglobin and NO: Implications for Hb-based blood substitutes. Free Radic Biol Med. 2000;28:1518–1525. doi: 10.1016/s0891-5849(00)00259-8. [DOI] [PubMed] [Google Scholar]
- 38.Gulati A, Barve A, Sen AP. Pharmacology of hemoglobin therapeutics. J Lab Clin Med. 1999;133:112–119. doi: 10.1016/s0022-2143(99)90003-3. [DOI] [PubMed] [Google Scholar]
- 39.Abassi Z, Kotob S, Pieruzzi F, Abouassali M, Keiser KR, Fratantoni JC, Alayash AI. Effects of polymerization on the hypertensive action of diaspirin cross-linked hemoglobin in rats. J Lab Clin Med. 1997;129:603–610. doi: 10.1016/s0022-2143(97)90194-3. [DOI] [PubMed] [Google Scholar]
- 40.Sharma AC, Singh G, Gulati A. Role of No Mechanism in Cardiovascular Effects of Diaspirin Cross-Linked Hemoglobin in Anesthetized Rats. Am J Physiol-Heart Circul Physiol. 1995;38:H1379–H1388. doi: 10.1152/ajpheart.1995.269.4.H1379. [DOI] [PubMed] [Google Scholar]
- 41.Thompson A, McGarry AE, Valeri CR, Lieberthal W. Stroma-Free Hemoglobin Increases Blood-Pressure and Gfr in the Hypotensive Rat - Role of Nitric-Oxide. J Appl Physiol. 1994;77:2348–2354. doi: 10.1152/jappl.1994.77.5.2348. [DOI] [PubMed] [Google Scholar]
- 42.Sampei K, Ulatowski JA, Asano Y, Kwansa H, Bucci E, Koehler RC. Role of nitric oxide scavenging in vascular response to cell-free hemoglobin transfusion. Am J Physiol-Heart Circul Physiol. 2005;289:H1191–H1201. doi: 10.1152/ajpheart.00251.2005. [DOI] [PMC free article] [PubMed] [Google Scholar]
- 43.Alayash AI. Hemoglobin-based blood substitutes: oxygen carriers, pressor agents, or oxidants? Nature Biotechnology. 1999;17:545–549. doi: 10.1038/9849. [DOI] [PubMed] [Google Scholar]
- 44.Rohlfs RJ, Bruner E, Chiu A, Gonzales A, Gonzales ML, Magde D, Madge MD, Vandegriff KD, Winslow RM. Arterial blood pressure responses to cell-free hemoglobin solutions and the reaction with nitric oxide. J Biol Chem. 1998;273:12128–12134. doi: 10.1074/jbc.273.20.12128. [DOI] [PubMed] [Google Scholar]
- 45.Winslow RM. Current status of blood substitute research: towards a new paradigm. J Intern Med. 2003;253:508–517. doi: 10.1046/j.1365-2796.2003.01150.x. [DOI] [PubMed] [Google Scholar]
- 46.Tsoukias NM, Kavdia M, Popel AS. A theoretical model of nitric oxide transport in arterioles: frequency- vs. amplitude-dependent control of cGMP formation. Am J Physiol-Heart Circul Physiol. 2004;286:H1043–H1056. doi: 10.1152/ajpheart.00525.2003. [DOI] [PubMed] [Google Scholar]
- 47.Kavdia M, Tsoukias NM, Popel AS. Model of nitric oxide diffusion in an arteriole: impact of hemoglobin-based blood substitutes. Am J Physiol-Heart Circul Physiol. 2002;282:H2245–H2253. doi: 10.1152/ajpheart.00972.2001. [DOI] [PubMed] [Google Scholar]
- 48.Pawloski JR. Hemoglobin and nitric oxide. New Engl J Med. 2003;349:403–404. [PubMed] [Google Scholar]
- 49.Reiter CD, Gladwin MT. An emerging role for nitric oxide in sickle cell disease vascular homeostasis and therapy. Curr Opin Hematol. 2003;10:99–107. doi: 10.1097/00062752-200303000-00001. [DOI] [PubMed] [Google Scholar]
- 50.Reiter CD, Wang XD, Tanus-Santos JE, Hogg N, Cannon RO, Schechter AN, Gladwin MT. Cell-free hemoglobin limits nitric oxide bioavailability in sickle-cell disease. Nat Med. 2002;8:1383–1389. doi: 10.1038/nm1202-799. [DOI] [PubMed] [Google Scholar]
- 51.Ballas SK, Marcolina MJ. Hyperhemolysis during the evolution of uncomplicated acute painful episodes in patients with sickle cell anemia. Transfusion. 2006;46:105–110. doi: 10.1111/j.1537-2995.2006.00679.x. [DOI] [PubMed] [Google Scholar]
- 52.Naumann H, Diggs L, Barreras L, Williams B. Plasma hemoglobin and hemoglobin fractions in sickle cell crisis. Am J Clin Pathol. 1971;56:137–147. doi: 10.1093/ajcp/56.2.137. [DOI] [PubMed] [Google Scholar]
- 53.Pohl U, Lamontagne D. Impaired Tissue Perfusion after Inhibition of Endothelium-Derived Nitric-Oxide. Basic Research in Cardiology. 1991;86:97–105. doi: 10.1007/978-3-642-72461-9_11. [DOI] [PubMed] [Google Scholar]
- 54.Gladwin MT. Unraveling the hemolytic subphenotype of sickle cell disease. Blood. 2005;106:2925–2926. [Google Scholar]
- 55.Minneci PC, Deans KJ, Huang Z, Yuen PST, Star RA, Banks SM, Schechter AN, Natanson C, Gladwin MT, Solomon SB. Hemolysis-associated endothelial dysfunction mediated by accelerated NO inactivation by decompartmentalized oxyhemoglobin. J Clin Invest. 2005;115:3409–3417. doi: 10.1172/JCI25040. [DOI] [PMC free article] [PubMed] [Google Scholar]
- 56.Nolan VG, Wyszynski DF, Farrer LA, Steinberg MH. Hemolysis-associated priapism in sickle cell disease. Blood. 2005;106:3264–3267. doi: 10.1182/blood-2005-04-1594. [DOI] [PMC free article] [PubMed] [Google Scholar]
- 57.Rother RP, Bell L, Hillmen P, Gladwin MT. The clinical sequelae of intravascular hemolysis and extracellular plasma hemoglobin - A novel mechanism of human disease. Jama-J Am Med Assoc. 2005;293:1653–1662. doi: 10.1001/jama.293.13.1653. [DOI] [PubMed] [Google Scholar]
- 58.Morris CR, Vichinsky EP, Kato GJ, Gladwin MT, Hazen S, Morris SM. Arginine metabolism, pulmonary hypertension, and sickle cell disease - In reply. Jama-J Am Med Assoc. 2005;294:2433–2434. doi: 10.1001/jama.294.19.2433-a. [DOI] [PubMed] [Google Scholar]
- 59.Gladwin MT, Sachdev V, Jison ML, Shizukuda Y, Plehn JF, Minter K, Brown B, Coles WA, Nichols JS, Ernst I, Hunter LA, Blackwelder WC, Schechter AN, Rodgers GP, Castro O, Ognibene FP. Pulmonary hypertension as a risk factor for death in patients with sickle cell disease. New Engl J Med. 2004;350:886–895. doi: 10.1056/NEJMoa035477. [DOI] [PubMed] [Google Scholar]
- 60.Kato GJ, McGowan VR, Machado RF, Little JA, Taylor VIJ, Morris CR, Nichols JS, Wang X, Poljakovic M, Morris J, Sidney M, Gladwin MT. Lactate dehydrogenase as a biomarker of hemolysis-associated nitric oxide resistance, priapism, leg ulceration, pulmonary hypertension and death in patients with sickle cell disease. Blood. 2006;107:2279–2285. doi: 10.1182/blood-2005-06-2373. [DOI] [PMC free article] [PubMed] [Google Scholar]
- 61.Pawloski JR, Hess DT, Stamler JS. Impaired vasodilation by red blood cells in sickle cell disease. Proc Natl Acad Sci USA. 2005;102:2531–2536. doi: 10.1073/pnas.0409876102. [DOI] [PMC free article] [PubMed] [Google Scholar]
- 62.Vaughn MW, Kuo L, Liao JC. Estimation of nitric oxide production and reaction rates in tissue by use of a mathematical model. Am J Physiol-Heart Circul Physiol. 1998;43:H2163–H2176. doi: 10.1152/ajpheart.1998.274.6.H2163. [DOI] [PubMed] [Google Scholar]
- 63.Malinski TTZ, Grunfeld S, Patton S, Kapturczak M, Tomboulian P. Diffusion of Nitric Oxide in the Aorta Wall Monitored in Situ by Porphyrinic Microsensors. Biochem Biophys Res Commun. 1993;193:1076–1082. doi: 10.1006/bbrc.1993.1735. [DOI] [PubMed] [Google Scholar]
- 64.Takahashi YMJJ, Carvallo C, Rivera C, Igarashi T, Srinivasan R, Young NS, Childs RW. In vitro and in vivo evidence of PNH cell sensitivity to immune attack after nonmyeloablative allogeneic hematopoietic cell transplantation. Blood. 2004;103:1382–90. doi: 10.1182/blood-2003-04-1281. [DOI] [PubMed] [Google Scholar]
- 65.Morris CRKG, Poljakovic M, Wang X, Blackwelder WC, Sachdev V, Hazen SL, Vichinsky EP, Morris SM, Jr, Gladwin MT. Dysregulated arginine metabolism, hemolysis-associated pulmonary hypertension, and mortality in sickle cell disease. JAMA. 2005;294:81–90. doi: 10.1001/jama.294.1.81. [DOI] [PMC free article] [PubMed] [Google Scholar]
- 66.Boschetti CFE, Bianchi P, Vercellati C, Barraco F, Zanella A. Clinical and molecular aspects of 23 patients affected by paroxysmal nocturnal hemoglobinuria. Am J Hematol. 2004;77:36–44. doi: 10.1002/ajh.20144. [DOI] [PubMed] [Google Scholar]
- 67.Tsoukias NM, Popel AS. Erythrocyte consumption of nitric oxide in presence and absence of plasma-based hemoglobin. Am J Physiol-Heart Circul Physiol. 2002;282:H2265–H2277. doi: 10.1152/ajpheart.01080.2001. [DOI] [PubMed] [Google Scholar]
- 68.Tsai AG, Acero C, Nance PR, Cabrales P, Frangos JA, Buerk DG, Intaglietta M. Elevated plasma viscosity in extreme hemodilution increases perivascular nitric oxide concentration and microvascular perfusion. Am J Physiol-Heart Circul Physiol. 2005;288:H1730–H1739. doi: 10.1152/ajpheart.00998.2004. [DOI] [PubMed] [Google Scholar]
- 69.Bohlen HG, Nase GP. Dependence of intestinal arteriolar regulation on flow-mediated nitric oxide formation. Am J Physiol Heart Circ Physiol. 2000;279:H2249–2258. doi: 10.1152/ajpheart.2000.279.5.H2249. [DOI] [PubMed] [Google Scholar]
- 70.Bellamy TC, Wood J, Garthwaite J. On the activation of soluble guanylyl cyclase by nitric oxide 10.1073/pnas.012368499. PNAS. 2002;99:507–510. doi: 10.1073/pnas.012368499. [DOI] [PMC free article] [PubMed] [Google Scholar]
- 71.Cary SPL, Winger JA, Marletta MA. Tonic and acute nitric oxide signaling through soluble guanylate cyclase is mediated by nonheme nitric oxide, ATP, and GTP 10.1073/pnas.0506289102. PNAS. 2005;102:13064–13069. doi: 10.1073/pnas.0506289102. [DOI] [PMC free article] [PubMed] [Google Scholar]
- 72.Stone JR, Marletta MA. Spectral and kinetic studies on the activation of soluble guanylate cyclase by nitric oxide. Biochemistry-US. 1996;35:1093–1099. doi: 10.1021/bi9519718. [DOI] [PubMed] [Google Scholar]
- 73.Zhao Y, Brandish PE, Ballou DP, Marletta MA. A molecular basis for nitric oxide sensing by soluble guanylate cyclase 10.1073/pnas.96.26.14753. PNAS. 1999;96:14753–14758. doi: 10.1073/pnas.96.26.14753. [DOI] [PMC free article] [PubMed] [Google Scholar]
- 74.Russwurm M, Behrends S, Harteneck C, Koesling D. Functional properties of a naturally occurring isoform of soluble guanylyl cyclase. Biochem J. 1998;335:125–130. doi: 10.1042/bj3350125. [DOI] [PMC free article] [PubMed] [Google Scholar]