

Abstract
The transcriptional activator Zap1 induces target gene expression in response to zinc deficiency. We demonstrate that during zinc starvation, Zap1 is required for the repression of ADH1 expression. ADH1 encodes the major zinc-dependent alcohol dehydrogenase that is utilized during fermentation. During zinc starvation, Zap1 binds upstream of the activator Rap1 and induces an intergenic RNA transcript, ZRR1. ZRR1 expression leads to the transient displacement of Rap1 from the ADH1 promoter resulting in ADH1 repression. Using a microarray-based approach, we screened for additional genes repressed by Zap1 intergenic transcripts. We found that ADH3, the major mitochondrial alcohol dehydrogenase, is regulated in a manner similar to ADH1. Thus, during zinc deficiency, Zap1 mediates the repression of two of the most abundant zinc-requiring enzymes.
Keywords: gene repression, metalloregulation, non-coding RNA, Zap1, zinc
Introduction
Metals such as zinc, copper and iron are essential for cell growth and yet are toxic when found in excess. Consequently, all cells employ a variety of mechanisms to survive periods of metal deficiency and sufficiency. In Saccharomyces cerevisiae, the transcriptional activator, Zap1, is essential for growth during periods of zinc starvation (Zhao and Eide, 1997). Zap1 protects cells from zinc limitation by inducing the expression of genes that encode proteins involved in zinc uptake (ZRT1 and FET4) (Zhao and Eide, 1996a; Waters and Eide, 2002) and the compartmentalization and release of zinc from the vacuolar stores (ZRC1 and ZRT3) (MacDiarmid et al, 2000, 2003). Zap1 mediates this response by binding in a site-specific manner to zinc-responsive elements (ZRE) located in the promoter regions of Zap1 target genes (Zhao et al, 1998). As zinc levels increase, Zap1 is inactivated by zinc post-translationally (Bird et al, 2000, 2003; Herbig et al, 2005).
A second mechanism of cell survival during metal ion starvation is the downregulation of the expression of proteins that utilize the required metal cofactor and upregulation the expression of an alternative enzyme or metabolic pathway. For example, under iron starvation conditions in S. cerevisiae, three genes involved in biotin synthesis (BIO3, BIO4 and BIO2) are transcriptionally repressed (Shakoury-Elizeh et al, 2004). BIO2 encodes the iron–sulfur-containing enzyme biotin synthetase, which catalyses the rate-limiting step of biotin synthesis. Iron deficiency simultaneously leads to the upregulation of the biotin uptake system (Shakoury-Elizeh et al, 2004). Thus, cells utilize iron-independent pathways (biotin uptake) during iron starvation and iron-dependent pathways (biotin synthesis) when iron is in plentiful.
Microarray analysis suggests that a number of genes are repressed during zinc deficiency in a Zap1-dependent manner (Lyons et al, 2000). One of the most highly repressed genes in response to zinc limitation is ADH1. ADH1 encodes the major zinc-dependent alcohol dehydrogenase utilized by yeast during fermentation. Proteomic studies have estimated that the abundance of Adh1 protein in fermenting yeast cells is anywhere between 2 and 7.5 × 10⁵ molecules per cell (Norbeck and Blomberg, 1997; Gygi et al, 1999). Given that yeast cells contain 1.5 × 10⁷ atoms of zinc under these growth conditions (MacDiarmid et al, 2000) and each monomer of Adh1 binds two zinc ions, as much as 5% of the cellular zinc quota is potentially bound to Adh1. One of the major target genes of Zap1 is Adh4, an alcohol dehydrogenase that resembles the iron-dependent ADHII of Zymomonas mobilis (Drewke and Ciriacy, 1988). Thus, transcriptional remodeling of ADH1 and ADH4 expression could be an important homeostatic mechanism used to conserve zinc during zinc deficiency.
Although Zap1 is primarily involved in gene activation, during severe zinc deficiency it represses the expression of ZRT2. ZRT2 encodes a low-affinity zinc uptake system. Zap1 mediates repression by binding to a low-affinity ZRE that overlaps with the ZRT2 transcriptional start site (Bird et al, 2004). Binding at this site inhibits transcription. This regulatory mechanism limits the production of Zrt2 under conditions where it is unable to transport zinc. It is likely that the mechanism of ADH1 repression differs from that of ZRT2, as there is no ZRE located between the ADH1 TATA element and translational start site. In this study, we have characterized the mechanism by which Zap1 represses ADH1 expression and have investigated whether this mechanism is used at other promoters to limit gene expression during zinc deficiency.
Results
ADH1 is repressed in zinc-limited cells in a Zap1-dependent manner
Microarray studies revealed that during zinc deficiency, ADH1 gene expression is repressed in a Zap1-dependent manner (Lyons et al, 2000). Zap1-mediated repression of ADH1 was confirmed by S1 nuclease analysis. Zap1 target genes, such as ADH4, are induced in zinc-deficient cells (Figure 1A), whereas ADH1 expression is repressed. CMD1 (calmodulin), a gene whose expression is not regulated by zinc status, was used as a loading control. As a zap1Δ mutant is unable to grow in the absence of zinc, we examined ADH1 expression in the zap1Δ mutant strain containing a plasmid expressing the ZRT1 high-affinity uptake permease from the constitutive PGK1 promoter (pZRT1). The increase in cellular zinc from Zrt1 overproduction partially alleviates the growth defect of a zap1Δ mutant (Figure 1B). Under these conditions, ADH1 expression is constitutively derepressed (Figure 1A).
Figure 1.
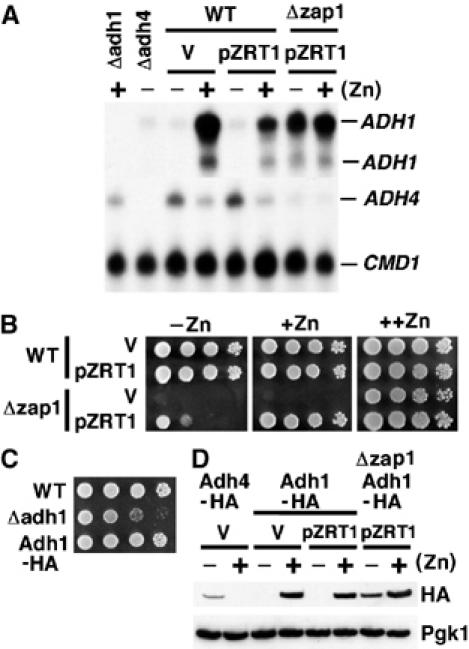
Differential regulation of ADH1 and ADH4 expression in response to zinc. The wild-type strain BY4741 and zap1Δmutant strain were transformed with pZRT1 or the empty vector (V). Total RNA was extracted following growth to exponential phase in LZM media supplemented with either 5 μM zinc [−Zn] or 3000 μM zinc [+Zn] and the levels of ADH4 and ADH1 analyzed using S1 nuclease analysis (A). RNA from adh4Δ and adh1Δ mutant strains was used to confirm the specificity of the probes, whereas calmodulin (CMD1) was used as a loading control. The strains BY4741 and zap1Δ containing the indicated plasmids were grown overnight in synthetic deplete medium lacking uracil (SD –URA). Five microliters of a cell suspension (OD600 1.0) and three 10-fold serial dilutions were plated onto SD (−URA) medium [++Zn] or SD medium (−uracil) containing 1 mM EDTA supplemented with 50 μM zinc [+Zn] or 3 μM zinc [−Zn]. Plates were grown for 3 days at 30°C (B). The strains BY4741 (WT), adh1Δ and ABY69 (Adh1-HA) were grown in synthetic complete (SC) medium overnight before serial dilutions were made onto SC medium, as described in panel B (C). The strains BY4741 (WT), ABY64 (Adh4-HA), ABY69 (Adh1-HA) and ABY77 (Δzap1, Adh1-HA) containing the indicated plasmids were grown as described in panel A. Crude protein extracts were made and analyzed by immunoblotting. Phosphoglycerate kinase 1 (Pgk1) was used as a loading control (D).
To examine the effects of zinc on Adh1 protein level, Adh1 was genomically tagged at the C-terminus with three HA epitope tags (Adh1-HA). The Adh1-HA strain grew at a rate similar to the wild-type strain and did not show the slow growth phenotype of an adh1Δ mutant (Figure 1C). Immunoblotting revealed that Adh1 accumulates under zinc-replete conditions, a profile opposite to Adh4, and that the absence of Adh1 in low zinc is dependent on Zap1 (Figure 1D). Thus, the Zap1 transcriptional activator is required for the repression of ADH1 expression in zinc-deficient cells.
Zap1 induces an RNA transcript 5′ of ADH1 that is required for repression
Rap1 is the major activator of ADH1 expression in glucose-grown cells (Lieb et al, 2001). The Rap1 UAS (AAACCCATACATC) is located 664 bp upstream of the ADH1 ATG translational start codon. A consensus Zap1-binding site (ACCTTGAAGGT) was identified upstream of the Rap1 UAS at position −1006 bp relative to the ADH1 translational start site. The role of the ZRE in repression was investigated using nested ADH1 promoter fusions to the integrated lacZ reporter gene (Figure 2A). Introduction of the promoter region containing the ZRE resulted in attenuated lacZ expression in zinc-deficient cells (compare constructs 3 and 4). This low zinc attenuation was abrogated when the ZRE was mutated (construct 5) or in zap1Δ cells (data not shown). Mutation of a putative TATA box sequence, located downstream of the ADH1 ZRE at position −936 bp, also resulted in impaired zinc-responsive regulation (construct 6).
Figure 2.
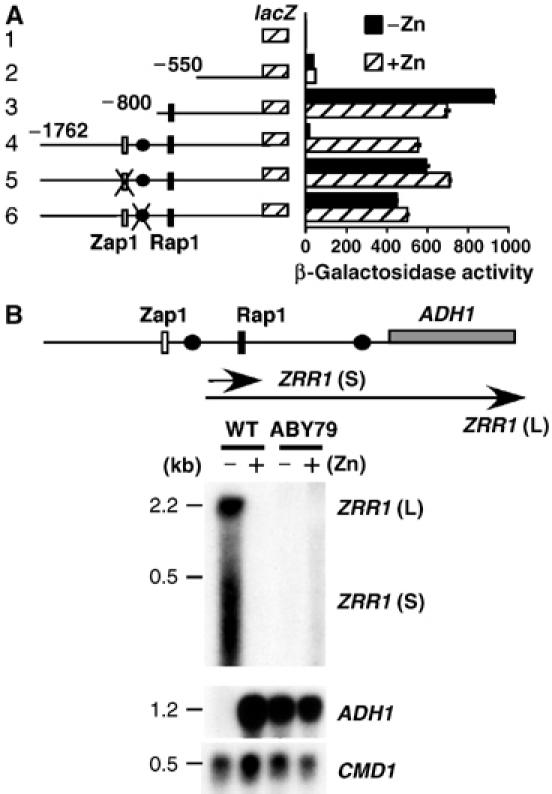
ADH1 repression requires the Zap1 dependent RNA transcript ZRR1. The indicated reporter constructs were transformed into in the wild-type strain BY4741. Transformants were grown to exponential phase in LZM supplemented with either 5 μM zinc [−Zn] or 3000 μM zinc [+Zn] and β-galactosidase activity measured in triplicate by standard procedures (A). The ZRE (white rectangle), Rap1 UAS (black rectangle) and upstream TATA box (black oval) are shown. Mutation of the ZRE element (ACCTTGAAGGT to TGGTTGAAGGT) or TATA box sequence (TATAAA to CCTAGG) is indicated by a cross. All numbers are relative to the first base of the initiation codon of lacZ, which is designated as +1. Northern analysis of ADH1, ZRR1 and loading control CMD1. The wild-type strain BY4741 and strain ABY79 in which the ADH1-ZRE (−1006 to −995 bp) is replace by the K. lactis URA3 ORF, were grown as described in panel A (B). The northern probe for ADH1 was a 54 bp oligonucleotide that hybridized to −27 to +27 bp relative to the ATG translational codon.
As Zap1 is a transcriptional activator and an upstream TATA element is essential for ADH1 repression, Northern analysis was used to investigate whether Zap1 induced a transcript across the ADH1 promoter. A diffuse small RNA transcript (⩽0.5 kb), designated ZRR1 (for Zinc Regulated RNA 1), was identified in zinc-deficient cells (Figure 2B). A longer ∼2.2-kb transcript was also observed, which most likely runs through the entire ADH1 ORF. Both transcripts were lost when the ADH1 ZRE was deleted from the chromosome, leading to constitutive ADH1 expression (Figure 2B, ABY79). The constitutive expression of ADH1 in low-zinc cells with the mutated ZRE was not reversed by the presence of the fully regulated ADH1-lacZ reporter fusion that yields a functional ZRR1 transcript (data not shown). Thus, ZRR1 acts in cis and not in trans.
ZRR1 mediates repression of ADH1 gene expression via transcriptional interference
Transcription of an intergenic mRNA transcript can inhibit the binding of transcriptional regulators to promoter regions. For example, during growth in rich medium, the promoter region of SER3 involved in serine biosynthesis is highly transcribed, yielding an intergenic RNA (SRG1) that attenuates the binding of activators to the SER3 promoter leading to SER3 repression (Martens et al, 2004). If a similar transcriptional interference mechanism occurs within the ADH1 promoter, repression should occur with an ADH1 activator other than Rap1 and with a ZRR1 activator other than Zap1. To determine whether Rap1 and Zap1 are essential for the regulation observed at the ADH1 promoter, the Rap1 UAS and Zap1 ZRE were mutated to the binding site for the transcriptional activator Gal4 (Figure 3A). As carbon source can influence ADH1 expression, each reporter construct was coexpressed with the pGEV transcriptional activator. pGEV is a hybrid transcription factor that utilizes the Gal4-DNA-binding domain, a β-estradiol-responsive element and the VP16 activation domain (Gao and Pinkham, 2000). pGEV can activate the expression of Gal4 target genes in glucose-grown cells in the presence of β-estradiol. As predicted, conversion of the Rap1 UAS to the Gal4 UAS (Figure 3A, construct 3) led to a marked reduction in the activation of ADH1-lacZ in the absence of β-estradiol. The addition of β-estradiol increased activity under zinc-replete but not zinc-limiting conditions. We predicted that the conversion of the Zap1 ZRE to a Gal4 UAS (construct 4) would lead to the constitutive production of ZRR1 in the presence of β-estradiol and consequently diminished β-galactosidase activity. The observed greater repression seen with the Zap1 ZRE relative to the Gal4 UAS may imply that full repression may require an additional factor recruited by Zap1. Alternatively, the weaker effect of Gal4 may arise from the inclusion of only a single Gal4 UAS. Highly expressed Gal4 target genes such as GAL1 contain multiple Gal4-binding sites in their promoters.
Figure 3.
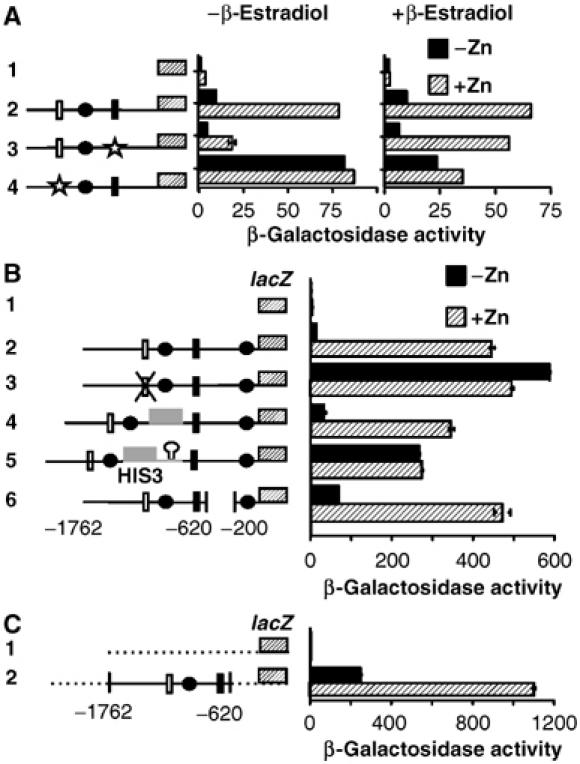
Characterization of the promoter elements required for ADH1 repression. The strain YM4271 (gal4Δ) was transformed with the indicated constructs. Transformed cells were grown as described in Figure 2A in the presence or absence of 10–5 M β-estradiol. β-Galactosidase activity measured in triplicate by standard procedures (A). The indicated reporter constructs were transformed into the wild-type strain BY4741 and cells grown as described in Figure 2A. β-Galactosidase activity measured in triplicate by standard procedures. The HIS3 ORF (gray box), HIS3 terminator (hairpin loop), and CYC1 promoter region (dashed line) and Gal4 UAS (star) are shown. All other symbols are described in Figure 2A (B, C).
To confirm that the intergenic transcript was interfering with ADH1 expression, we replaced 150 bp of the ZRR1 sequence (−700 to −850) with the HIS3 ORF or the HIS3 ORF inclusive of the HIS3 transcriptional terminator (Figure 3B). Replacement of ZRR1 with the HIS3 ORF did not affect repression of ADH1-lacZ under zinc-limiting conditions (construct 4). Conversely, ADH1-lacZ expression was derepressed when the HIS3 ORF and its terminator were introduced (construct 5). If repression is mediated through the transcriptional interference of Rap1 binding, then sequences downstream of the Rap1-binding site should not be necessary for repression. Deletion of the ADH1 promoter region between −200 and−620 bp had little effect on repression (construct 6). Similarly, repression was observed in response to zinc limitation when the ADH1 promoter region containing the Zap1 and Rap1 sites (−620 to −1762 bp) was introduced into a plasmid containing a UAS-less CYC1 promoter (Figure 3C).
To test whether the repression was a direct result of impaired Rap1 binding to the ADH1 promoter, chromatin immunoprecipitation (ChIP) analysis was performed using strains containing genomic TAP-tagged Zap1 and Rap1. The TAP-tagged Zap1 strain was fully functional, showing no growth defect in zinc-limiting media (data not shown). Zap1 accumulates to high levels in zinc-limited growth medium owing to autoregulation (Figure 4A). Under these growth conditions, TAP-Zap1 could be detected binding to the ADH1 promoter (Figure 4B). If transcriptional interference of ADH1 was similar to that of SER3, we predicted that Rap1 binding to the ADH1 promoter would be attenuated in zinc-deficient cells. However, no zinc-dependent change in occupancy of Rap1 binding was observed (Figure 4B, primer pair 2). Rap1 is a well-characterized DNA-binding protein that has a variety of cellular roles, including chromatin opening and silencing at the telomeres. The ability of Rap1 to affect chromatin suggests that it might behave differently to ordinary transcription factors during a collision with an elongating RNA polymerase. For example, a collision of RNA polymerase with Rap1 might transiently dislodge Rap1 from DNA, allowing its rapid re-association. Alternatively, transcription through the Rap1 site may alter the transcriptional activation function of Rap1 without altering its DNA-binding ability. To address the dynamic regulation of Rap1 binding, we examined Rap1 promoter occupancy by in vivo dimethyl sulfate (DMS) footprinting analysis. Surprisingly, the modification of guanine (G) residues by DMS was severely impaired in our low-zinc media in the BY4741 strain background (data not shown). We therefore generated a constitutive allele of Zap1, by fusing the Zap1 DNA-binding domain to the VP16 activation domain (Zap1c), to examine the effects of ZRR1 expression on Rap1 occupancy in zinc-replete media. Zap1c was able to complement a zap1Δ strain but could not confer zinc-responsive regulation onto a minimal ZRE-lacZ reporter construct (Supplementary Figure 1). Expression of Zap1c in a wild-type strain resulted in increased levels of the ZRR1 transcript and decreased ADH1 expression and protein under zinc-replete conditions (Figure 4C and D). In addition, the presence of Zap1c resulted in protection of G residues at positions −1004 and −1005 within the ADH1 ZRE (Figure 4E), but significantly exposed G residues at positions −652, −659 and −660 within the Rap1-binding site and at positions −680 and −681 within an upstream Gcr1-binding site to methylation. Thus, Zap1-induced ZRR1 expression leads to the transient displacement of Rap1 and Gcr1 from the ADH1 promoter.
Figure 4.
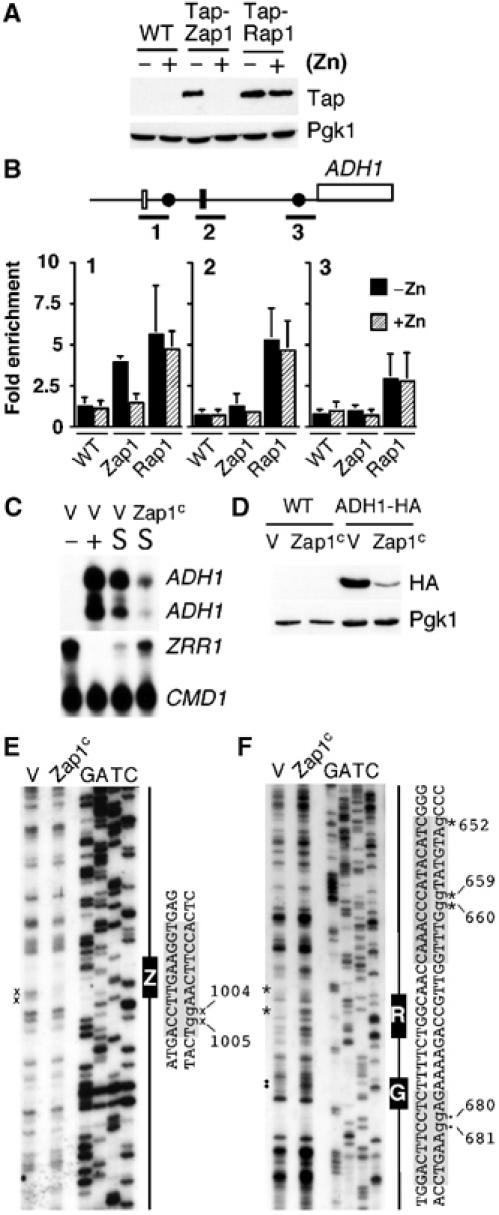
Expression of ZRR1 leads to the transient dissociation of Rap1 from the ADH1 promoter. The strains BY4741, ABY61 (TAP-Zap1) and TAP-Rap1 were grown to exponential phase in LZM supplemented with either 3 μM zinc [−Zn] or 3000 μM zinc [+Zn]. (A) Crude protein extracts were generated and analyzed by immunoblotting. Blots were incubated with peroxidase–anti peroxidase (for TAP) or Pgk1 for the loading control. (B) Cells grown under the conditions in panel A were crosslinked for ChIP analysis. PCR was performed with primer pairs that amplified the following sequences relative to the first base of the initiation codon of ADH1, which is designated as +1 (bar 1 −1163 to −778 bp, bar 2 −837 to −486 bp and bar 3 −290 to +58 bp). Amplified sequences were normalized against input DNA and binding at the HIS3 ORF (negative control). Data represents an average of three independent experiments. The extension of Rap1 binding in bar 1 and bar 3 sequences likely arises from incomplete sonication. (C) The strain BY4741 containing the empty vector pRS-VP16 (V) or VP16-ZAP1 (Zap1c) was grown to exponential phase in LZM supplemented with 5 μM zinc (−), 3000 μM zinc (+) or in Zn-replete SD (−URA) (S). Total RNA was extracted and the levels of ADH1, ZRR1 and CMD1 mRNAs were analyzed by S1 nuclease analysis. (D) The strains BY4741 and ABY69 (ADH1-HA) containing pRS-VP16 (V) or Zap1c were grown in SD (−URA). Crude protein extracts were made and analyzed by immunoblotting. (E, F) Exponential cultures of BY4741 containing the above plasmids were grown to exponential phase in SD (−URA) media and analyzed by in vivo DMS footprinting. The positions of the ZRE (Z), Rap1 (R) and Gcr1 (G) binding sites have been indicated schematically and by gray shading in the DNA sequence. Protected G residues have been indicated by × (Zap1), * (Rap1), • (Gcr1) and by lowercase letters in the DNA sequence. Data is a representative of 3 independent experiments.
ZRR1 expression lowers but does not prevent ADH1 transcriptional initiation
Our data are consistent with a model where the displacement of Rap1 and Gcr1 from the ADH1 promoter during zinc deficiency prevents transcriptional initiation of ADH1 mRNAs. To test this model, we measured the extent of histone H3K4 trimethylation (H3K4me3) across the ADH1 promoter using ChIP analysis (Figure 5A). Histone H3K4me3 generally occurs at the beginning of actively transcribed genes (Pokholok et al, 2005). We were therefore surprised by an increase in H3K4me3 during zinc deficiency over the region of the ADH1 promoter amplified with the primer pair A3 (and not A2). More notable was H3K4me3 at the ADH1 transcriptional start site under both zinc-limiting and zinc-replete conditions (primer pair A4). Although no ADH1 transcripts were detected during zinc limitation by Northern analysis, we re-investigated the abundance of ADH1 and ADH1-lacZ mRNAs using S1 nuclease analysis. To differentiate between the long ZRR1 intergenic transcripts and the ADH1 or lacZ transcripts, S1 nuclease primers were designed to overlap with the two major ADH1 transcriptional initiation start sites (Figure 5B). The two sites correspond to –27 and –37 bp upstream of the ATG codon. Accordingly, the long ZRR1-lacZ and ZRR1-ADH1 transcripts will be digested to final lengths of 65 and 64 bp, whereas lacZ and ADH1 transcripts that initiate at the ADH1 transcriptional start sites will be digested to a final length of 40 or 50 and 39 or 49 bp, respectively. To examine the effects of ZRR1 on lacZ expression, cells were grown under zinc-limiting conditions before exposure to zinc. In zinc-starved cells, two transcript sizes were detected the long ZRR1-lacZ transcript that accumulated to high levels (Figure 5C, 0 min lacZ65) and a lacZ transcript that initiated from the −37 transcriptional initiation start site (Figure 5C, 0 min lacZ50). No lacZ transcript initiating from the –27 transcriptional initiation start site (lacZ40) was observed. It is unlikely the lacZ50 transcript arises from an overlap with the low-abundance ZRR1-ADH1 transcript (that would give an S1 nuclease product of 55 bp), as the lacZ50 mRNA was present in low-zinc conditions in a strain that lacked the chromosomal ADH1 ZRE (Figure 5E, 0 min lacZ50). Both the long ZRR1-lacZ and the full-length lacZ transcript were also observed by Northern analysis during zinc-limiting conditions (data not shown). The addition of zinc resulted in the rapid loss of the lacZ50 transcript (Figure 5C, 3 min), the slower loss of the ZRR1-lacZ mRNA and then the re-appearance of lacZ transcripts that initiated from both the −37 and −27 transcriptional initiation start sites (Figure 5C, 90 min lacZ50 and lacZ40). Importantly, the ‘wild-type' lacZ transcript accumulated to similar levels in both zinc-limited and zinc-replete cells (Figure 5C, compare 0 and 90 min lacZ50), but was translated into protein only under zinc-replete conditions (Figure 5D, β-Gal). Analysis of ADH1 transcripts under the same conditions revealed similar trends, although the long ZRR1-ADH1 transcript was less stable than its ZRR1-lacZ counterpart (Figure 5F). An ADH1 transcript that was initiated from the −37 transcriptional start site was detected during zinc limitation (ADH149). However, this transcript was very unstable and could only be detected on long exposures (Figure 5H).
Figure 5.
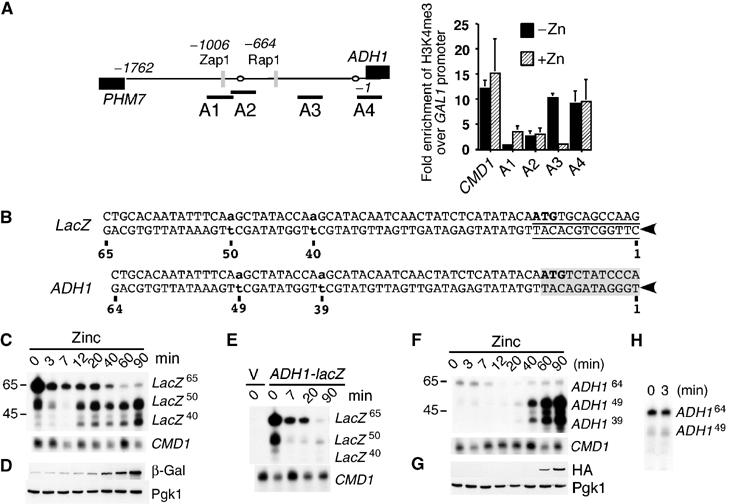
Effects of ZRR1 on ADH1 transcriptional initiation. The wild-type strain BY4741 was grown under conditions described in Figure 4A. ChIP was performed with anti-histone H3K4me3 antibodies and real time quantitative PCR performed with PCR primers that amplified the following sequences relative to the ADH1 ATG codon; A1 −1136 to −949 bp, A2 −974 to −820 bp, A3 −479 to −345 bp, A4 −94 to +84 bp. The CMD1 control primers amplified sequences −227 to +61 bp relative to the CMD1 ATG codon. Values are an average of three quantifications (A). DNA sequence of the S1 oligonucleotides used in panels C–F. Arrowheads indicate the 5′ ends of the oligonucleotides. Shown are the complementary DNA strands (the positions of the previously mapped –27 and –37 ADH1 transcriptional start site (bold lowercase letters) (Bennetzen and Hall, 1982), the translational ATG (bold uppercase letters), the ADH1 ORF (gray shading), the TATA boxes (open ovals) and lacZ ORF (underlined sequence). Numbers indicate the base-pair position in the oligonucleotide (B). Strain BY4741 containing the integrated ADH1-lacZ fusion (Figure 2A construct 4) was grown to exponential phase in LZM media supplemented with 5 μM Zn2+. Cells were harvested, washed 3 times in PBS and then resuspended in SD (−URA) supplemented with 100 μM Zn2+. Aliquots were removed at the indicated time points for S1 nuclease analysis (C) or immunoblot analysis (D). The strain ABY79 (ΔADH1ZRE) containing pYep353 or pYepADH1 (multi-copy version of Figure 2 construct 4) was grown as described in panel C. Aliquots were removed at the indicated times for S1 nuclease analysis (E). Strain ABY69 (ADH1-HA) was grown as described in panel C. Cells were removed for S1 nuclease analysis (F) or immunoblot analysis (G). A longer exposure of lanes 1 and 2 of panel F was performed (H).
ADH3 gene expression is repressed during zinc deficiency
To investigate whether Zap1 mediated repression of other genes via transcriptional interference, we used a microarray-based approach with Agilent intragenic and intergenic oligonucleotide arrays. These arrays contain oligonucleotide probes that are spaced ∼266 bp apart, allowing changes in the expression of both ORF and intergenic regions to be examined. We screened for genes exhibiting a Zap1-induced intergenic transcript in zinc-limited cells and repression of the downstream ORF.
The LZM medium used to make yeast cells zinc deficient contains two metal chelators, EDTA and sodium citrate. As a consequence, our medium is slightly limited for other metal ions, such as iron. We therefore performed our microarrays under zinc-replete conditions using the constitutive Zap1c. Microarray analysis of a zap1Δ strain containing Zap1c versus the empty vector revealed that the major Zap1 target genes were induced (Supplementary Figure 2). Figure 6A shows the expression profile around the ZRT1 locus of chromosome VII. For Zap1 targets (such as ZRT1, ADH4 and VEL1), we found higher levels of expression of probes that fell within their open reading frames (ORF) and low expression in their promoter regions (arrows indicate the positions of ZRE motifs). This expression profile was reversed at the ADH1 locus where we observed high expression in the 5′ promoter region, whereas the ORF was repressed (Figure 6B).
Figure 6.
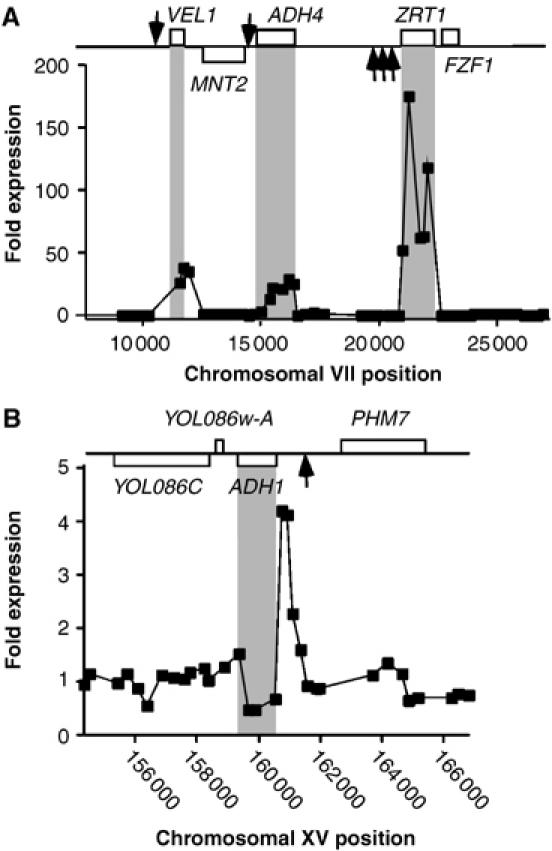
Identification of additional Zap1-dependent intergenic RNA transcripts. Shown are data for the ZRT1 (A) and ADH1 (B) chromosomal regions. The strain zap1Δ containing either pRS-VP16 (vector) or pZap1c was grown to exponential phase in SD (−uracil) media before cells were harvested. RNA was extracted and hybridized to yeast intergenic microarrays as described in Supplementary Figure 2. The differential expression between the vector and pZap1c labeled samples was plotted against chromosomal map position. The positions of ORFs have been indicated where upper boxes represent the Watson strand ORFs and lower boxes represent the Crick strand. Arrows indicate the positions of ZREs. Gray panels highlight the positions of Zap1 regulated ORFs.
Microarray analysis revealed that another highly induced intergenic region was the ADH3 promoter (Figure 7A). ADH3 encodes the major zinc-dependent mitochondrial alcohol dehydrogenase (Pilgrim and Young, 1987). An ADH3-lacZ reporter fusion was used to confirm that ADH3 expression was repressed under zinc-limiting conditions (Figure 7B, construct 2). Mutations that disrupted the ZRE led to marked derepression under zinc-limiting conditions and a slight loss of activity under zinc-replete conditions (Figure 7B, construct 3). To further investigate whether Zap1 was involved in the repression of ADH3 expression during zinc limitation, we analyzed ADH3 transcript levels by Northern analysis (Figure 7C–E). The major 1.2-kb ADH3 transcript seen in zinc-replete cells was attenuated in zinc-deficient cells and two additional transcripts were seen. The production of both of these transcripts was dependent upon the presence of the ADH3 ZRE and Zap1 (Figure 7D and E). To determine the effect of the ZRE-mediated transcripts on Adh3 protein levels, a strain containing Adh3 tagged at the C-terminus with three HA epitope tags was generated (Figure 7F). Little Adh3 protein accumulated in zinc-limited cells. Adh3 protein accumulated to some extent in zap1Δ cells, but not to the level seen in zinc-replete cells. As the ADH3 transcript size is normal in zap1Δ cells, the reduction in the protein level in zinc-deficient cells is likely due to Adh3 protein instability.
Figure 7.
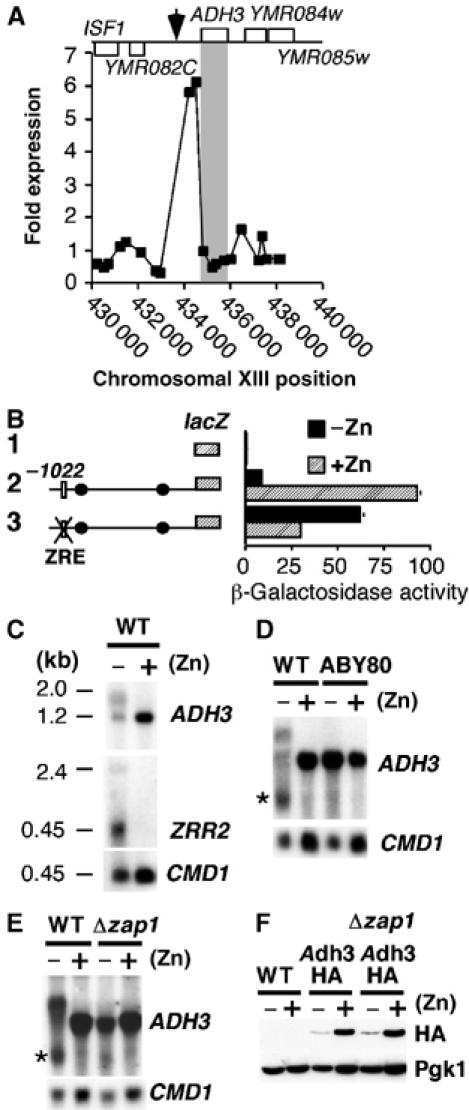
ADH3 gene expression is regulated by the Zap1-dependent ZRR2 transcript. (A) Expression differences in the strain zap1Δ containing either pRS-VP16 (vector) or pZap1c. See legend of Figure 4C and D for details. (B) The indicated reporter constructs were transformed into the wild-type strain BY4741 and cells grown to exponential phase in LZM supplemented with either 3 μM zinc [−Zn] or 3000 μM zinc [+Zn] and β-galactosidase activity measured in triplicate by standard procedures. (C–E) Northern analysis of ADH3, ZRR2 and loading control CMD1. Wild-type strain BY4741, strain ABY80 in which the ADH3-ZRE is replaced by the K. lactis URA3 ORF (−755 to –745 bp relative to the ATG) or the zap1Δ mutant strain containing pZRT1 (Δzap1) was grown under the conditions described in panel B. The northern probe for ADH3 was a 60 bp oligonucleotide that hybridized to +6 to +65 bp relative to the ATG translational codon. (F) The strains BY4741 (WT), ABY71 (Adh3-HA) and ABY74 (Δzap1 Adh3-HA) were grown in LZM media supplemented with either 3 μM zinc [−Zn] or 3000 μM zinc [+Zn]. Crude protein extracts were made and analyzed by immunoblotting. Phosphoglycerate kinase 1 (Pgk1) was used as a loading control.
A number of additional genes were reproducibly repressed in Zap1c-containing cells and exhibited an apparent elevated transcript within the 5′ promoter region. To test whether Zap1-dependent intergenic transcripts repressed these genes, 1100 bp of the OM45, MTH1 or HXT17 promoter regions was fused to the lacZ reporter gene. We found that none of these reporter constructs led to attenuated lacZ expression in zinc-limiting medium (data not shown). Furthermore, Northern analysis did not substantiate a change in the transcript size in zinc deficient cells (data not shown). Thus, zinc repression of gene expression by intergenic non-coding RNAs appears limited to ADH1 and ADH3.
Discussion
Zap1 induces the expression of over 40 genes in zinc-deficient cells. We show here that Zap1 mediates the repression of the ADH1 and ADH3 genes through generation of Zap1-dependent, intergenic, non-coding transcripts. The Zap1-dependent ZRR1 intergenic transcript mediates repression of ADH1 through, in part, transcription interference. The ZRR1 transcript results in a transient dislodging of Rap1 and Gcr1 from the ADH1 promoter. Rap1 appears stably bound at the ADH1 promoter by ChIP analysis in both zinc-limiting and zinc-replete cells; however, in vivo footprinting analysis reveals a change in the occupancy of both Rap1 and Gcr1. Maximal activation of ADH1 requires both Rap1 and Gcr1. ZRR1 repression of ADH1 requires the upstream ZRE and TATA elements and is abrogated by the inclusion of a transcriptional termination site 100 bp upstream of the candidate Gcr1 site. The repression of ADH1 by ZRR1 occurs only in cis and is effective with a heterologous downstream TATA element and ORF. Repression of ADH3 through expression of an intergenic transcript will likely occur by a mechanism similar to that of ADH1.
Rap1 displacement by ZRR1 was only observed by in vivo footprinting and not ChIP analysis. This difference may arise from the ability of the two different techniques to distinguish transient displacement. As Rap1 is known to induce a pronounced bend upon binding to DNA (Konig et al, 1996), it is also possible that ZRR1 alters the Rap1–DNA complex conformation such that it is more accessible to DMS methylation without perturbing crosslinking.
Transcriptional interference by regulated intergenic transcription was first demonstrated in S. cerevisiae at the SER3 locus (Martens et al, 2004). Transcription of the non-coding SRG1 transcript attenuates expression of the downstream SER3 gene. SRG1 expression occurs in cells propagated in a growth medium containing high serine levels. The serine-responsive activator Cha4 mediates the induction of SRG1 (Martens et al, 2005). The Cha4-mediated repression of SER3 requires two coactivators SAGA and Swi/Snf, which are chromatin-remodeling complexes. The Zap1 induction of ZRR1 may also require additional components, as replacement of the Zap1 ZRE by a Gal4 UAS did not result in efficient Gal4-mediated repression of lacZ.
Although transcriptional interference is likely a dominant mechanism for the repression of ADH1, repression may have other features. Under conditions in which ZRR1 is induced, transcriptional initiation at one of the two start sites in ADH1 occurs. ADH1 transcripts arising from initiation at the –37 start site are not translated into protein. Replacement of the ADH1 ORF by lacZ results in the accumulation of a full-length mature transcript from the –37 start site, but this transcript also fails to be translated into protein. The observation of abundant transcripts from the –37 start site of the ADH1-lacZ construct but not the endogenous ADH1 may arise from RNA instability of the ADH1 transcript, or an effect of the lacZ fusion on chromatin structure. If the failure to see the substantial endogenous ADH1 transcript initiating at –37 is only due to transcript instability, then Zap1 induction of ZRR1 may alter the chromatin structure in such a way that only the –37 and not the –27 start site is used, and that the resulting transcript is incompetent for translation. If the observation of a significant ADH1-lacZ transcript starting from the –37 start is only an effect of lacZ on the chromatin structure, then the entire effect of ZRR1 may relate to transcriptional interference. Studies are underway to discern these two possibilities.
Translationally defective transcripts are known. Defects in phosphorylation of the RNA polymerase C-terminal domain are known to affect mRNA processing (Muratani et al, 2005). Ubiquitylation of Gal4 was shown to be important in the regulation of the quality of RNA transcripts. Cells lacking the Dsg1 ubiquitin ligase accumulate a Gal4 variant that induces transcription but yields transcripts that are incompletely processed and are nonfunctional. The effect is mediated through changes in the phosphorylation state of the RNA polymerase C-terminal domain. Zap1 induction of ZRR1 may likewise mediate an effect on RNA polymerase II that results in non-processed, non-functional RNAs from the ADH1 locus. Future studies will address whether the transcripts are polyadenylated and associated with polysomes.
Zinc-dependent alcohol dehydrogenases are among the most abundant zinc metalloenzymes in yeast cells. The repression of Adh1 and Adh3 during zinc limitation may be a mechanism to conserve the zinc nutrient. This model might predict that Adh1 and Adh3 overproduction during zinc starvation would be detrimental to cell growth. However, we detected no growth defect in yeast strains that constitutively produced ADH1 and ADH3. It is noteworthy that Adh3 protein fails to accumulate to high levels under zinc-limiting conditions in a zap1Δ strain. This result could explain why a strain constitutively producing Adh3 shows no zinc-dependent growth defect. Why can the Adh1 protein but not Adh3 accumulate under zinc-deficient conditions? Mechanisms that could explain this difference include that Adh3 stability may be regulated by zinc status. Alternatively, zinc in the mitochondria is less available to Adh3 during zinc deficiency leading to its turnover whereas more zinc is available to Adh1 in the cytoplasm. A third possibility is that protein turnover of unmetallated Adh3 is more efficient in the mitochondria compared to cytosolic apo-Adh1 turnover.
Zn-containing Adh1 and Adh3 are repressed in zinc-limited cells, whereas the iron-like alcohol dehydrogenase gene, ADH4, is maximally induced. Adh4 is the only alcohol dehydrogenase in yeast that resembles the iron-containing alcohol dehydrogenases, which are exemplified by ADHII from Z. mobilis. Z. mobilis ADHII forms a dimer that binds one atom of iron per subunit (Neale et al, 1986). Although the iron-binding ligands are conserved in Adh4, purification of Adh4 from S. cerevisiae revealed the presence of bound zinc and not iron. Furthermore, in vitro Adh4 reconstitution studies showed that only Zn(II) and not Fe(II) could activate the enzyme (Drewke and Ciriacy, 1988). If Adh4 binds zinc, why would this alcohol dehydrogenase be induced during zinc starvation? The simplest model is zinc conservation. In S. cerevisiae, Adh1 forms a tetrameric enzyme that binds two atoms of zinc per subunit. Adh4 is predicted to form a dimer with each subunit binding one zinc ion. Alternatively, Adh4 may be a more efficient alcohol dehydrogenase during zinc limitation. Kinetic analysis indicates that Adh4 closely resembles Adh1 in its affinities for ethanol, NADH and acetaldehyde (Drewke and Ciriacy, 1988). However, Adh4 has a higher affinity for NAD. This higher affinity for NAD, or some other property of Adh4, may be advantageous during zinc starvation. A final model is that Adh4 binds iron when zinc levels are limiting. Adh4 was purified as the zinc-containing enzyme from zinc-replete yeast cells, a condition where Adh4 is normally not synthesized. It is interesting to note that alcohol dehydrogenases that resemble Adh4 are found in many higher eukaryotes, including Caenorhabditis elegans and humans. It will be interesting to see if zinc reciprocally regulates the zinc-requiring and these alternative alcohol dehydrogenase isoforms in other organisms.
Zinc deficiency has broad effects on gene expression in yeast. In addition to the induction of many genes and the repression of ADH1 and ADH3, multiple genes are reproducibly repressed in cells with a constitutively active Zap1. The mechanism of repression of these genes is likely distinct from that of ADH1 and ADH3, as no apparent intergenic transcripts are induced and they are not located adjacent to Zap1 target genes. Repression of these additional genes is also unlikely related to the Zap1-dependent repression of ZRT2 through a proximal ZRE, as many of the other repressed genes lack a candidate ZRE in their proximal 5′ sequences. Therefore, we have much more to learn about how Zap1 controls the expression of the many genes in the genome that respond to this factor. A full analysis of these other repressed genes will be presented in a subsequent report.
Materials and methods
Strains and growth conditions
Yeast strains used in this study are described in Supplementary Figure 3. Yeast cells were grown in synthetic defined (SD) medium supplemented with 2% glucose and the appropriate auxotrophic supplements. LZM was prepared as described previously (Zhao and Eide, 1996b). LZM contains the zinc chelator 1 mM EDTA.
Plasmid constructions
All clones were confirmed by sequencing. The ADH1-minimal CYC1 promoter fusion (Figure 3A) was generated by PCR amplifying the indicated ADH1 promoter region with primers that contained XhoI/XbaI sites and then subcloning the resulting PCR product into equivalent sites in the vector pNB404. All remaining ADH1/ADH3 lacZ fusions are integrated plasmids unless stated. These fusions were generated by PCR amplifying the indicated promoter fragment, inclusive of the translational start codon, and using homologous recombination to insert the PCR products into BamHI/PstI-digested pYep353 (Myers et al, 1986). Internal mutations and deletions were generated using two-step overlapping PCR. The ADH1-lacZ fusions containing the HIS3 ORF were generated by initially replacing the ADH1 promoter region between −700 and −850 bp with a BamHI site. The HIS3 ORF (+1 to +663 with +1 at the HIS3 ATG) or the HIS3 ORF and terminator (+1 to +913) were subsequently introduced following digestion with BamHI, by homologous recombination (Kunes et al, 1987). Promoter inserts were subsequently released by a BamHI/PstI digest and subcloned into the corresponding sites in the vector YIp353 with the exceptions of promoter fusions containing the HIS3 ORF that were subcloned into YIp353 using the EcoRI/ClaI restriction sites. The resulting plasmids were linearized with NcoI and the DNA was used to transform the indicated strains. The construct VP16-Zap1 has been reported previously (Bird et al, 2006).
DNA, RNA and protein analysis
RNA was extracted from cells grown to mid-log phase using the hot acidic phenol method. Intergenic microarrays were performed with Agilent yeast whole-genome oligonucleotide arrays as described in Supplementary data. For Northern analysis, 15 μg of yeast total RNA was separated on 2.2 M formaldehyde–agarose gel, before transfer to a nylon membrane at alkaline pH and Northern hybridization by standard conditions (Sambrook and Russell, 2001). S1 analysis was performed with total RNA as described by Dohrmann et al (1992. Crude protein extracts were generated by TCA precipitation, and Western analysis was performed as described previously (Bird et al, 2000). The primary antibodies used were anti-HA (Santa Cruz Biotechnology) and anti-Pgk1 (Molecular Probes). In vivo DMS footprinting was performed as described by Dumitru and McNeil (1994).
β-Galactosidase assays
β-Galactosidase activity was measured as described previously (Guarente, 1983). The reporter used was pGAL1-lacZ. pGAL1-lacZ contains 1000 bp of the GAL1 promoter, inclusive of the translational ATG, fused to the lacZ gene in the vector pYep353.
Chromatin immunoprecipitation analysis
ChIP analysis with Tap-Rap1 and Tap-Zap1 was performed as described previously (Keller et al, 2005). Bands were imaged using a Bio-Rad phosphoimager. Data shown are averaged from three independent experiments. ChIP analysis of histone H3K4me3 was performed as described previously (Roberts et al,) with the exception that immunoprecipitations were set up with histone H3 (trimethyl K4) antibodies (Abcam).
Supplementary Material
Supplementary Figure
Supplementary Figure Legend
Supplementary Table 1
Supplementary Table 2
Supplementary Information
Acknowledgments
We thank Dr David Stillman for vectors and useful discussions. We thank Jason Lieb for providing yeast strains. We acknowledge the excellent technical assistance of the University of Utah Microarray Core Facility, which receives support through grant CA42014-18 (NIH Cancer Center Support Grant). This work was supported by grant GM56285 from the National Institutes of Health.
References
- Bennetzen JL, Hall BD (1982) The primary structure of the Saccharomyces cerevisiae gene for alcohol dehydrogenase. J Biol Chem 257: 3018–3025 [PubMed] [Google Scholar]
- Bird AJ, Blankman E, Stillman DJ, Eide DJ, Winge DR (2004) The Zap1 transcriptional activator also acts as a repressor by binding downstream of the TATA box in ZRT2. EMBO J 23: 1123–1132 [DOI] [PMC free article] [PubMed] [Google Scholar]
- Bird AJ, McCall K, Kramer M, Blankman E, Winge DR, Eide DJ (2003) Zinc fingers can act as Zn2+ sensors to regulate transcriptional activation domain function. EMBO J 22: 5137–5146 [DOI] [PMC free article] [PubMed] [Google Scholar]
- Bird AJ, Swierczek S, Qiao W, Eide DJ, Winge DR (2006) Zinc metalloregulation of the zinc finger pair domain. J Biol Chem 281: 25326–25335 [DOI] [PubMed] [Google Scholar]
- Bird AJ, Zhao H, Luo H, Jensen LT, Srinivasan C, Evans-Galea M, Winge DR, Eide DJ (2000) A dual role for zinc fingers in both DNA binding and zinc sensing by the Zap1 transcriptional activator. EMBO J 19: 3704–3713 [DOI] [PMC free article] [PubMed] [Google Scholar]
- Dohrmann PR, Butler G, Tamai K, Dorland S, Greene JR, Thiele DJ, Stillman DJ (1992) Parallel pathways of gene regulation: homologous regulators SWI5 and ACE2 differentially control transcription of HO and chitinase. Genes Dev 6: 93–104 [DOI] [PubMed] [Google Scholar]
- Drewke C, Ciriacy M (1988) Overexpression, purification and properties of alcohol dehydrogenase IV from Saccharomyces cerevisiae. Biochim Biophys Acta 950: 54–60 [DOI] [PubMed] [Google Scholar]
- Dumitru I, McNeil JB (1994) A simple in vivo footprinting method to examine DNA–protein interactions over the yeast PYK UAS element. Nucleic Acids Res 22: 1450–1455 [DOI] [PMC free article] [PubMed] [Google Scholar]
- Gao CY, Pinkham JL (2000) Tightly regulated, beta-estradiol dose-dependent expression system for yeast. Biotechniques 29: 1226–1231 [DOI] [PubMed] [Google Scholar]
- Guarente L (1983) Yeast promoters and lacZ fusions designed to study expression of cloned genes in yeast. Methods Enzymol 101: 181–191 [DOI] [PubMed] [Google Scholar]
- Gygi SP, Rochon Y, Franza BR, Aebersold R (1999) Correlation between protein and mRNA abundance in yeast. Mol Cell Biol 19: 1720–1730 [DOI] [PMC free article] [PubMed] [Google Scholar]
- Herbig A, Bird AJ, Swierczek S, McCall K, Mooney M, Wu CY, Winge DR, Eide DJ (2005) Zap1 activation domain 1 and its role in controlling gene expression in response to cellular zinc status. Mol Microbiol 57: 834–846 [DOI] [PubMed] [Google Scholar]
- Keller G, Bird A, Winge DR (2005) Independent metalloregulation of Ace1 and Mac1 in Saccharomyces cerevisiae. Eukaryot Cell 4: 1863–1871 [DOI] [PMC free article] [PubMed] [Google Scholar]
- Konig P, Giraldo R, Chapman L, Rhodes D (1996) The crystal structure of the DNA-binding domain of yeast Rap1 in complex with telomeric DNA. Cell 85: 125–136 [DOI] [PubMed] [Google Scholar]
- Kunes S, Ma H, Overbye K, Fox MS, Botstein D (1987) Fine structure recombinational analysis of cloned genes using yeast transformation. Genetics 115: 73–81 [DOI] [PMC free article] [PubMed] [Google Scholar]
- Lieb JD, Liu X, Botstein D, Brown PO (2001) Promoter-specific binding of Rap1 revealed by genome-wide maps of protein-DNA association. Nat Genet 28: 327–334 [DOI] [PubMed] [Google Scholar]
- Lyons TJ, Gasch AP, Gaither LA, Botstein D, Brown PO, Eide DJ (2000) Genome-wide characterization of the Zap1p zinc-responsive regulon in yeast. Proc Natl Acad Sci U S A 97: 7957–7962 [DOI] [PMC free article] [PubMed] [Google Scholar]
- MacDiarmid CW, Gaither LA, Eide D (2000) Zinc transporters that regulate vacuolar zinc storage in Saccharomyces cerevisiae. EMBO J 19: 2845–2855 [DOI] [PMC free article] [PubMed] [Google Scholar]
- MacDiarmid CW, Milanick MA, Eide DJ (2003) Induction of the ZRC1 metal tolerance gene in zinc-limited yeast confers resistance to zinc shock. J Biol Chem 278: 15065–15072 [DOI] [PubMed] [Google Scholar]
- Martens JA, Laprade L, Winston F (2004) Intergenic transcription is required to repress the Saccharomyces cerevisiae SER3 gene. Nature 429: 571–574 [DOI] [PubMed] [Google Scholar]
- Martens JA, Wu PY, Winston F (2005) Regulation of an intergenic transcript controls adjacent gene transcription in Saccharomyces cerevisiae. Genes Dev 19: 2695–2704 [DOI] [PMC free article] [PubMed] [Google Scholar]
- Muratani M, Kung C, Shokat KM, Tansey WP (2005) The F box protein Dsg1/Mdm30 is a transcriptional coactivator that stimulates Gal4 turnover and cotranscriptional mRNA processing. Cell 120: 887–899 [DOI] [PubMed] [Google Scholar]
- Myers AM, Tzagoloff A, Kinney DM, Lusty CJ (1986) Yeast shuttle and integrative vectors with multiple cloning sites suitable for construction of lacZ fusions. Gene 45: 299–310 [DOI] [PubMed] [Google Scholar]
- Neale AD, Scopes RK, Kelly JM, Wettenhall RE (1986) The two alcohol dehydrogenases of Zymomonas mobilis. Purification by differential dye ligand chromatography, molecular characterisation and physiological roles. Eur J Biochem 154: 119–124 [DOI] [PubMed] [Google Scholar]
- Norbeck J, Blomberg A (1997) Two-dimensional electrophoretic separation of yeast proteins using a non-linear wide range (pH 3–10) immobilized pH gradient in the first dimension; reproducibility and evidence for isoelectric focusing of alkaline (pI>7) proteins. Yeast 13: 1519–1534 [DOI] [PubMed] [Google Scholar]
- Pilgrim D, Young ET (1987) Primary structure requirements for correct sorting of the yeast mitochondrial protein ADH III to the yeast mitochondrial matrix space. Mol Cell Biol 7: 294–304 [DOI] [PMC free article] [PubMed] [Google Scholar]
- Pokholok DK, Harbison CT, Levine S, Cole M, Hannett NM, Lee TI, Bell GW, Walker K, Rolfe PA, Herbolsheimer E, Zeitlinger J, Lewitter F, Gifford DK, Young RA (2005) Genome-wide map of nucleosome acetylation and methylation in yeast. Cell 122: 517–527 [DOI] [PubMed] [Google Scholar]
- Roberts DN, Stewart AJ, Huff JT, Cairns BR (2003) The RNA polymerase III transcriptome revealed by genome–wide localization and activity–occupancy relationships. Proc Natl Acad Sci USA 100: 14695–14700 [DOI] [PMC free article] [PubMed] [Google Scholar]
- Sambrook J, Russell D (2001) Molecular Cloning: a Laboratory Manual. Cold Spring Harbor, NY: Cold Spring Harbor Laboratory Press [Google Scholar]
- Shakoury-Elizeh M, Tiedeman J, Rashford J, Ferea T, Demeter J, Garcia E, Rolfes R, Brown PO, Botstein D, Philpott CC (2004) Transcriptional remodeling in response to iron deprivation in Saccharomyces cerevisiae. Mol Biol Cell 15: 1233–1243 [DOI] [PMC free article] [PubMed] [Google Scholar]
- Waters BM, Eide DJ (2002) Combinatorial control of yeast FET4 gene expression by iron, zinc, and oxygen. J Biol Chem 277: 33749–33757 [DOI] [PubMed] [Google Scholar]
- Zhao H, Butler E, Rodgers J, Spizzo T, Duesterhoeft S, Eide D (1998) Regulation of zinc homeostasis in yeast by binding of the Zap1 transcriptional activator to zinc-responsive promoter elements. J Biol Chem 273: 28713–28720 [DOI] [PubMed] [Google Scholar]
- Zhao H, Eide D (1996a) The yeast ZRT1 gene encodes the zinc transporter protein of a high-affinity uptake system induced by zinc limitation. Proc Natl Acad Sci U S A 93: 2454–2458 [DOI] [PMC free article] [PubMed] [Google Scholar]
- Zhao H, Eide D (1996b) The ZRT2 gene encodes the low affinity zinc transporter in Saccharomyces cerevisiae. J Biol Chem 271: 23203–23210 [DOI] [PubMed] [Google Scholar]
- Zhao H, Eide DJ (1997) Zap1, a metalloregulatory protein involved in zinc-responsive transcriptional regulation in Saccharomyces cerevisiae. Mol Cell Biol 17: 5044–5052 [DOI] [PMC free article] [PubMed] [Google Scholar]
Associated Data
This section collects any data citations, data availability statements, or supplementary materials included in this article.
Supplementary Materials
Supplementary Figure
Supplementary Figure Legend
Supplementary Table 1
Supplementary Table 2
Supplementary Information