

Abstract
Objective
Evaluate the consistency of the contribution of interactions between single nucleotide polymorphism (SNP) genotype effects to variation in measures of lipid metabolism across ethnic strata within gender.
Methods and Results
We considered 80 SNPs within the apolipoprotein (APO) A1/C3/A4/A5 gene cluster using an over-parameterized general linear model to identify SNPs whose genotype effects combine non-additively to influence plasma levels of high density lipoprotein cholesterol (HDL-C), total cholesterol (TC) and triglycerides (TG) in a consistent manner across ethnic strata. We analyzed population-based samples of unrelated 18 to 30 year old African-Americans (n = 1,858) and European-Americans (n = 1,973) ascertained without regard to health at four field centers (Birmingham, Ala.; Chicago, Ill.; Minneapolis, Minn. and Oakland, Calif., USA) by the Coronary Artery Risk Development in Young Adults (CARDIA) study. To identify which SNP genotype effects combine non-additively we used a two-tier analysis strategy. We first required that pairs of SNPs show statistically significant non-additivity in both ethnic strata within a gender, where experiment-wise significance was evaluated using a permutation test to determine the probability of observing the number of tests significant in both ethnic strata by chance alone. Second, we required no significant evidence of heterogeneity of the relationship between the phenotype and the two SNP genotypes across ethnic strata and across field centers within each ethnic group. From this strategy we identified ten pairs of SNPs, involving thirteen SNPs, that displayed statistically significant non-additivity of SNP genotype effects on TC. Only one of these thirteen SNPs had statistically significant genotype effects that were consistent across samples.
Conclusion
Our analyses suggest that ignoring the contribution of interactions between SNP genotype effects when modeling multi-SNP genotype-phenotype relationships may result in an underestimate of the contribution of genetic variation to variation in quantitative cardiovascular disease (CVD) risk factor traits.
Keywords: Cholesterol, Interaction, Epistasis, APOA1/C3/A4/A5 gene cluster, Association studies
Introduction
Elevated levels of plasma total cholesterol (TC) and triglyceride (TG) and reduced levels of high density lipoprotein cholesterol (HDL-C) have been extensively studied and are well documented risk factors for developing cardiovascular disease (CVD) in westernized societies [1]. The gene products from the apolipoprotein (APO) A1/C3/A4/A5 gene cluster (11q23–24) are involved in lipid metabolism. Apolipoprotein (apo) A-I comprises approximately 70% of the high-density lipoprotein (HDL) particle. It acts as a cofactor of lecithin-cholesterol acyltransferase [2, 3] in facilitating the transport of cholesterol from the peripheral tissues to the liver in a process known as reverse cholesterol transport. ApoC-III is a major component of very low density lipoproteins (VLDL) and chylomicrons. It is thought to play a role in the hepatic uptake of TG-rich particles and their remnants [4]. ApoA-IV has been shown to have a role in lipid absorption, transport and metabolism, as a constituent of HDL and TG-rich lipoprotein particles [5]. Comparisons of human and mouse DNA sequence data have identified the APOA5 gene as a new member of the APOA1/C3/A4 gene cluster [6]. ApoA-V is implicated in regulating lipoprotein lipase-mediated VLDL-TG hydrolysis [7].
The statistical associations between variation in plasma levels of HDL-C, TC and TG and single-site and haplotype variations in the APOA1/C3/A4/A5 gene cluster have clearly established the influence of these genes in determining phenotypic variability [8–14]. It is widely acknowledged that gene-gene and gene-environment interaction effects also play an important role in the determining levels of these plasma measures of lipid metabolism [15–17]. Furthermore, the coordinated roles of the genes in this cluster in regulating lipoprotein structure and metabolism suggest that interactions between sites within the gene cluster may make a major contribution to predicting interindividual variation in HDL-C, TC and TG. To investigate this possibility we evaluated the consistency of the influence of interactions between pairs of single nucleotide polymorphisms (SNPs) within the APOA1/C3/A4/A5 gene region on interindividual variation in plasma HDL-C, TC and TG levels in population-based samples of unrelated African-American and European-American males and females.
To identify which SNPs are interacting to influence trait variability we used a two-tier analysis strategy. We first required that pairs of SNPs show statistically significant non-additivity of SNP genotype effects in both ethnic strata within a gender. Experiment-wise significance was evaluated using a permutation test to determine the probability of observing the number of tests significant in both ethnic strata by chance alone. We chose to consider gender specific consistency because of the well-documented gender differences in the natural history of the risk of developing CVD [18] and evidence for the gender specific genetic architecture of the quantitative CVD risk factors such as blood pressure, obesity and lipid levels [19]. Second, we required that there was no significant evidence of heterogeneity of the phenotype-genotype relationships across ethnic strata and across field centers within each ethnic group. The results from these analyses support three conclusions: (1) variations within the APOA1/C3/A4/A5 gene cluster interact to influence interindividual variation in plasma TC levels; (2) the observed pairwise effects are not a consequence of linkage disequilibrium (LD) between the SNPs, and (3) ignoring interactions between SNP genotype effects when modeling multi-SNP genotype-phenotype relationships may result in underestimating the contribution of genetic variation to quantitative variation in measures of CVD risk.
Methods
Sample and Laboratory Measurements
The details of the CARDIA study have been described in Friedman et al. [20]. This study consists of unrelated young adults aged 18 to 30 years old who were randomly recruited without regard to health status from residents of Birmingham, Ala., USA, from selected census tracts in Chicago, Ill. and Minneapolis, Minn., USA, and from the membership of the Kaiser-Permanente health plan in Oakland, Calif., USA. Study participants were given a baseline examination (1985–1986) and venous blood was drawn after a 12 h fast. While this is a longitudinal study, only analyses of the baseline data are reported here. Plasma HDL-C, TC and TG levels were determined using standard enzymatic methods [21].
For the present study, 80 SNPs within the APOA1/C3/A4/A5 gene cluster (fig. 1) were genotyped in 3,831 individuals (1,075 African-American females, 783 African-American males, 1,041 European-American females and 932 European-American males). The gene cluster spans approximately 48 kb and is located on the long arm of chromosome 11q23-q24. 124 SNPs were identified by completely resequencing 17.7 kb that included the intergenic region between APOA1 and APOC3, the exons, intervening introns and approximately 1000 bp upstream of the APOA1, APOC3, APOA4 and APOA5 genes in 24 unrelated individuals from each of three populations: African-Americans from Jackson, Miss., USA, Europeans from North Karelia, Finland, and European-Americans from Rochester, Minn., USA [22]. After excluding singletons, insertion/deletion polymorphisms, and one short tandem repeat polymorphism, assays for 80 SNPs were successfully completed using a Sequenom MassARRAY System (San Diego, Calif., USA). This assay involves PCR amplification of genomic DNA, a short extension reaction across the polymorphic site and mass spectrometry to detect allele-specific mass differences of the extension product. Approximately 5% of the samples had a blind duplicate which resulted in approximately 99% agreement between the duplicates and the originals.
Fig. 1.
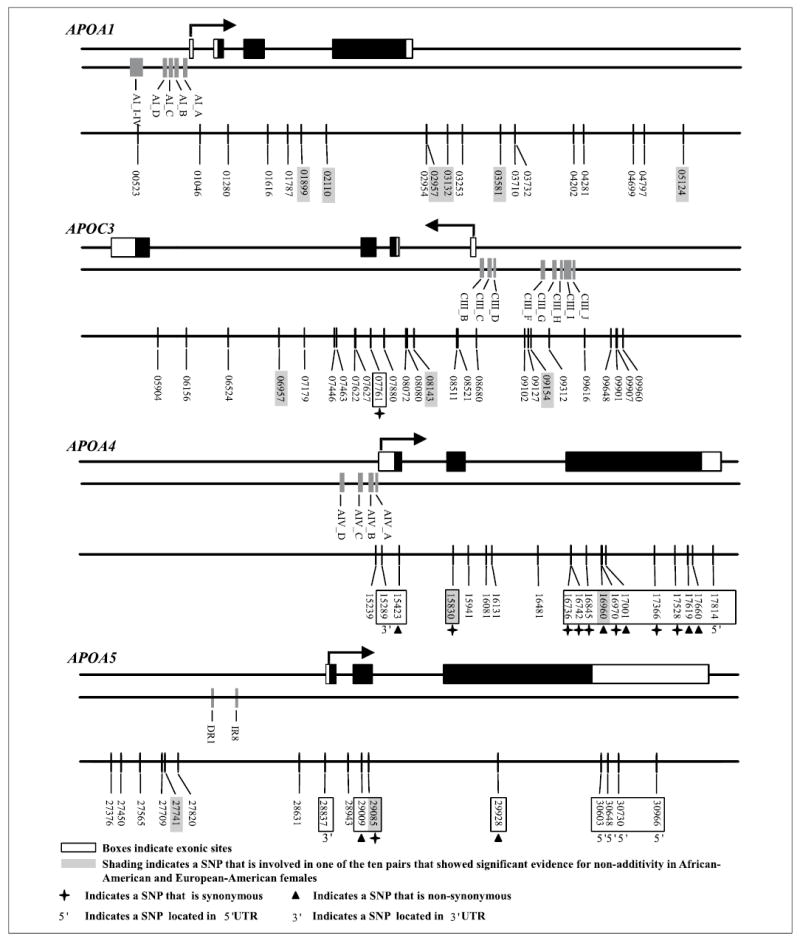
The exon structure and direction of transcription of each gene, previously identified regulatory regions and location of the 80 SNPs genotyped in this study for the APOA1/C3/A4/A5 gene cluster.
Statistical Analyses
Prior to the analyses of phenotype-genotype relationships, TG values were logarithmically (base e) transformed to reduce skewness. Transformation reduced skewness from 2.42 to 0.41 in African-Americans and from 5.04 to 0.68 in European-Americans. Plasma HDL-C, TC and lnTG values were adjusted prior to analysis by fitting an ethnic/gender/field center-specific linear regression model containing age, age 2, age 3 and body mass index (BMI) and adding the residuals to the ethnic/gender-specific mean. Fisher’s F test was used to determine whether there was a statistically significant difference in the variance of age, height, weight, BMI or plasma HDL-C, TC or lnTG between females and males in each ethnic stratum [23]. Student’s t test was used to determine the statistical significance of the difference between gender means when the F test was not significant. Satterthwaite’s modification of the t test was used when the F test for inequality of the variances was significant [23]. The square of the pairwise correlation between SNPs was estimated as
where the composite measure of LD is
[24]. p Values for the test of the composite LD(ΔAB) = 0 were obtained using an approximate χ12 test statistic nρAB2, where n is the sample size.
The one-way analysis of variance was used to test the null hypothesis of additivity of single-SNP genotype mean effects. An over-parameterized statistical model was used to estimate and compare average phenotypic values of two-SNP genotypes to determine if there was evidence that single-SNP genotype effects combine non-additively to influence plasma TC levels [25]. This definition of non-additivity and its relationship to traditional models of epistasis, as well as a full description of the over-parameterized model applied to genetic data, can be found in Hamon et al. [26]. Briefly, an over-parameterized general linear model was fit to two-SNP genotype means and an F statistic, that measures the magnitude of non-additivity, was used to test the statistical significance of deviations from additivity.
Resampling methods were used to determine if there was significant evidence for interaction by creating a test of the null hypothesis that the observed number of significant F tests is not significantly greater than expected by chance sampling. Because the degrees of freedom associated with the F statistic varies among pairs with different numbers of observed genotypes, the p values associated with the F statistics were used to generate the null distribution. Within each ethnic/gender/field center strata the phenotypes were permuted among individuals keeping the two-SNP genotypic structure in each strata fixed [27]. The number of p values that were equal to or less than α = 0.05 level in both ethnic strata of a gender strata was determined for each of 1,000 permutations to create the null distribution of p values [28]. The proportion of these p values that exceeded the observed number of p values significant at the α = 0.05 level in both ethnic strata of the gender strata in the analysis of the original data was taken as the experiment-wise level of statistical significance.
Results
Table 1 summarizes characteristics of the CARDIA participants included in the present study. Within both ethnic strata, males and females differed significantly for mean levels of height, weight, BMI, plasma HDL-C and TG. African-American females had a significantly lower variance for plasma HDL-C and TG and a significantly higher variance for weight and BMI than males, while European-American females had a significantly lower variance for height, plasma TC and TG levels and a significantly higher variance for BMI and plasma HDL-C than males.
Table 1.
Characteristics and tests of homogeneity between males and females for 1,858 African-Americans and 1,973 European-Americans of the CARDIA study
| Females |
Males |
p values |
||||||
|---|---|---|---|---|---|---|---|---|
| Trait | n | mean | variance | n | mean | variance | mean | variance |
| African-Americans | ||||||||
| Age, years | 1,075 | 24.5 | 15.0 | 783 | 24.3 | 14.0 | 0.339 | 0.278 |
| Height, cm | 1,074 | 163.7 | 48.5 | 781 | 177.2 | 48.7 | <0.001 | 0.956 |
| Weight, kg | 1,071 | 69.1 | 716.1 | 780 | 77.2 | 517.9 | <0.001 | <0.001 |
| BMI, kg/m2 | 1,071 | 25.8 | 41.4 | 780 | 24.6 | 19.2 | <0.001 | <0.001 |
| HDL-C, mg/dl | 1,075 | 55.0 | 158.4 | 783 | 53.5 | 183.6 | 0.020 | 0.026 |
| TC, mg/dl | 1,075 | 178.0 | 1,094.5 | 783 | 176.6 | 1,186.1 | 0.360 | 0.225 |
| TG, mg/dl | 1,075 | 62.9 | 876.2 | 783 | 70.7 | 1,616.0 | <0.001 | <0.001 |
| European-Americans | ||||||||
| Age, years | 1,041 | 25.6 | 11.6 | 932 | 25.5 | 11.3 | 0.622 | 0.691 |
| Height, cm | 1,036 | 165.1 | 40.5 | 930 | 178.1 | 46.7 | <0.001 | 0.025 |
| Weight, kg | 1,037 | 63.0 | 356.9 | 930 | 76.9 | 346.2 | <0.001 | 0.637 |
| BMI, kg/m2 | 1,036 | 23.1 | 19.5 | 930 | 24.3 | 12.1 | <0.001 | <0.001 |
| HDL-C, mg/dl | 1,041 | 56.3 | 165.5 | 932 | 47.0 | 112.9 | <0.001 | <0.001 |
| TC, mg/dl | 1,041 | 176.0 | 958.7 | 932 | 176.0 | 1,094.3 | 0.980 | 0.038 |
| TG, mg/dl | 1,041 | 69.4 | 1,505.4 | 932 | 87.7 | 4,462.2 | <0.001 | 0.007 |
The locations of the 80 SNPs genotyped in this study are shown in figure 1. Of the eight SNPs located in exons, one SNP is located in the 5′ UTR, two SNPs resulted in non-synonymous amino acid changes, one SNP was a synonymous change and four SNPs were located in the 3′ UTR. Table 2 presents the SNP nomenclature used in this paper, the dbSNP reference where available, the equivalent number used in Fullerton et al. [22] and the polymorphism for each of the 80 SNPs.
Table 2.
Nomenclature for 80 SNPs
| Fullerton22 |
Fullerton22 |
||||||||||
|---|---|---|---|---|---|---|---|---|---|---|---|
| GENE | SNP number | dbSNP reference | SNP number | polymorphism | GENE | SNP number | dbSNP reference | SNP number | polymorphism | ||
| APOA1 | 523 | 48809 | G | A | APOC3 | 9616 | 39716 | G | A | ||
| APOA1 | 1046 | 5069 | 48286 | C | T | APOC3 | 9648 | 39684 | G | A | |
| APOA1 | 1280 | 5070 | 48052 | C | T | APOC3 | 9901 | 39431 | G | T | |
| APOA1 | 1616 | 2070665 | 47716 | C | T | APOC3 | 9907 | 39425 | C | T | |
| APOA1 | 1787 | 5073 | 47545 | G | A | APOC3 | 9960 | 39372 | C | A | |
| APOA1 | 1899 | 47433 | C | T | APOA4 | 15239 | 5090 | 34093 | G | C | |
| APOA1 | 2110 | 5076 | 47222 | C | T | APOA4 | 15289 | 5091 | 34043 | G | A |
| APOA1 | 2954 | 5081 | 46378 | T | A | APOA4 | 15423 | 33909 | G | A | |
| APOA1 | 2957 | 46375 | A | G | APOA4 | 15830 | 5092 | 33502 | A | G | |
| APOA1 | 3132 | 46200 | A | C | APOA4 | 15941 | 2239013 | 33391 | A | G | |
| APOA1 | 3253 | 46079 | C | T | APOA4 | 16081 | 5094 | 33251 | C | T | |
| APOA1 | 3581 | 45751 | A | G | APOA4 | 16131 | 5095 | 33201 | T | C | |
| APOA1 | 3710 | 45622 | T | C | APOA4 | 16481 | 5098 | 32851 | C | G | |
| APOA1 | 3732 | 45600 | A | C | APOA4 | 16736 | 5101 | 32596 | C | T | |
| APOA1 | 4202 | 45130 | A | C | APOA4 | 16742 | 5103 | 32590 | T | C | |
| APOA1 | 4281 | 1263162 | 45051 | A | T | APOA4 | 16845 | 32693 | C | T | |
| APOA1 | 4699 | 44633 | T | C | APOA4 | 16960 | 5104 | 32372 | A | G | |
| APOA1 | 4797 | 44535 | G | A | APOA4 | 16970 | 2234668 | 32362 | C | T | |
| APOA1 | 5124 | 44208 | T | G | APOA4 | 17001 | 32331 | G | T | ||
| APOC3 | 5904 | 43428 | C | T | APOA4 | 17366 | 5106 | 31966 | C | T | |
| APOC3 | 6156 | 5130 | 43176 | A | G | APOA4 | 17528 | 5109 | 31804 | G | T |
| APOC3 | 6524 | 5132 | 42808 | G | A | APOA4 | 17619 | 675 | 31713 | A | T |
| APOC3 | 6957 | 553080 | 42375 | A | G | APOA4 | 17660 | 5110 | 31672 | G | T |
| APOC3 | 7179 | 42153 | G | A | APOA4 | 17814 | 31518 | C | T | ||
| APOC3 | 7446 | 41886 | G | A | APOA5 | 27376 | 4024 | C | T | ||
| APOC3 | 7463 | 1269330 | 41869 | C | T | APOA5 | 27450 | 3950 | T | C | |
| APOC3 | 7622 | 2070666 | 41710 | A | T | APOA5 | 27565 | 3835 | G | A | |
| APOC3 | 7627 | 2070667 | 41705 | C | T | APOA5 | 27709 | 662799 | 3691 | T | C |
| APOC3 | 7761 | 4520 | 41571 | G | A | APOA5 | 27741 | 1729411 | 3659 | C | T |
| APOC3 | 7880 | 41452 | T | C | APOA5 | 27820 | 3580 | G | A | ||
| APOC3 | 8072 | 41260 | G | A | APOA5 | 28631 | 648450 | 2769 | T | C | |
| APOC3 | 8080 | 5143 | 41252 | C | T | APOA5 | 28837 | 651821 | 2563 | A | G |
| APOC3 | 8143 | 2070668 | 41189 | A | C | APOA5 | 28943 | 2457 | T | G | |
| APOC3 | 8511 | 40821 | G | A | APOA5 | 29009 | 3135506 | 2391 | G | C | |
| APOC3 | 8521 | 40811 | G | A | APOA5 | 29085 | 2315 | A | C | ||
| APOC3 | 8680 | 40652 | A | C | APOA5 | 29928 | 3135507 | 1472 | A | G | |
| APOC3 | 9102 | 40230 | A | G | APOA5 | 30603 | 619054 | 797 | T | C | |
| APOC3 | 9127 | 2854116 | 40205 | A | G | APOA5 | 30648 | 752 | T | C | |
| APOC3 | 9154 | G | A | APOA5 | 30730 | 2266788 | 670 | T | C | ||
| APOC3 | 9312 | 2542052 | 40020 | G | T | APOA5 | 30966 | 434 | T | C | |
In order to mitigate the influence of multiple testing on the rate of false positives (type I errors), specific non-additive SNP genotype effects were investigated only if there was a greater number of significant pairwise tests across ethnic strata within a gender than expected under a designated cutoff (α = 0.05). Table 3 summarizes, separately for each gender, the number of pairs of SNPs for which it is possible to estimate non-additivity in both ethnic strata and the number of tests of these estimates that were significant at the α = 0.05 level of probability in both ethnic strata. The corresponding experiment-wise probability of observing at least the number of observed tests significant at the α = 0.05 level of statistical significance in both ethnic strata by chance is given in the last column of table 3. There was no evidence for an excess in the number of significant tests of non-additivity in both ethnic strata for males or females for HDL-C or lnTG. However, a significant excess (p ≤ 0.05) of statistically significant tests was observed for females in the analysis of TC. We observed 14 or more significant tests of non-additivity in both ethnic strata in only 24 of the 1,000 permutation tests (p = 0.024). To further reduce type I errors we required that the phenotype-genotype relationship be maintained across ethnic strata and across field centers within each ethnic group. Specifically, we required that there was no significant evidence for heterogeneity of the differences among the two-SNP genotype means (α > 0.10) across the ethnic strata and across field centers within each of the ethnic strata (α > 0.10). The ten SNP pairs that satisfied these criteria are presented in table 4. These ten pairs involved 13 SNPs. None of these pairs of SNPs had a significant (p ≤ 0.05) non-additive influence on plasma HDL-C, TC or lnTG levels in males in both ethnic strata.
Table 3.
Characteristics of pairwise SNP combinations and corresponding experiment-wise p values
| Trait | Strata | Total number of tests of interaction | Number of significant α = 0.05 tests of interaction (%) in both ethnic strata | Experiment-wise p value |
|---|---|---|---|---|
| HDL-C | females | 1,587 | 5 (0.0032) | 0.146 |
| HDL-C | males | 1,503 | 1 (0.0007) | 0.914 |
| TC | females | 1,587 | 14 (0.0088) | 0.024 |
| TC | males | 1,503 | 8 (0.0053) | 0.078 |
| lnTG | females | 1,587 | 4 (0.0025) | 0.594 |
| lnTG | males | 1,503 | 1 (0.0007) | 0.596 |
Table 4.
p values for the analyses of the ten pairs of SNPs in females that had statistically significant interaction effects on TC in African-Americans and European-Americans and non-significant evidence for heterogeneity of the phenotype-genotype relationship across ethnic strata and across field centers within each ethnic group
| Test of homogeneity across |
||||||||||
|---|---|---|---|---|---|---|---|---|---|---|
| GENE | SNP 1 | GENE | SNP 2 | Sample size | African-Americans | Sample size | European-Americans | ethnic strata | field centers within African-Americans | field centers within European-Americans |
| A1 | 2110 | C3 | 8143 | 974 | 0.034 | 918 | 0.042 | 0.23 | 0.967 | 0.816 |
| A1 | 1899 | A4 | 15830 | 1,009 | 0.024 | 977 | 0.026 | 0.717 | 0.211 | 0.357 |
| A1/C3 | 3132 | A1/C3 | 5124 | 916 | 0.026 | 933 | 0.013 | 0.811 | 0.146 | 0.311 |
| A1/C3 | 3581 | A1/C3 | 5124 | 934 | 0.015 | 803 | 0.010 | 0.762 | 0.618 | 0.410 |
| A1/C3 | 2957 | C3 | 6957 | 931 | 0.035 | 929 | 0.018 | 0.143 | 0.410 | 0.968 |
| A1/C3 | 3132 | C3 | 9154 | 937 | 0.012 | 952 | 0.024 | 0.140 | 0.365 | 0.512 |
| A1/C3 | 3132 | A4 | 15830 | 956 | 0.013 | 958 | 0.010 | 0.608 | 0.179 | 0.322 |
| A1/C3 | 3581 | A4 | 15830 | 973 | 0.001 | 824 | 0.003 | 0.352 | 0.479 | 0.339 |
| A1/C3 | 3581 | A4 | 16960a | 969 | 0.028 | 720 | 0.019 | 0.984 | 0.442 | 0.493 |
| A5 | 27741 | A5 | 29085b | 989 | 0.025 | 816 | 0.007 | 0.578 | 0.654 | 0.803 |
Indicates statistically significant influence on levels of the plasma TC when considered separately in a single-SNP analysis in African-American and European-American females at α = 0.05.
Indicates a statistically significant influence on levels of the plasma TC when considered separately in a single-SNP analysis in African-American females at α = 0.05.
When considered separately in a single-SNP analysis only one of the 80 SNPs (16960) had a statistically significant (p ≤ 0.05) genotypic effect on plasma TC in females in both ethnic strata. Furthermore, it was also the only SNP that had a significant genotypic effect on TC levels in both the African-American and European-American samples of males. The mean plasma TC level for those individuals with the GG genotype was significantly higher (10 to 20 mg/dl) than those who had AA or AG genotypes in all four ethnic/gender strata (data not shown). This single-SNP was involved in one of the ten pairs described above and in table 4. The other nine pairs involved 12 SNPs that did not have significant single-SNP genotypic differences in mean TC level. In contrast, differences among the means of the two-SNP genotypes defined by each of these nine two-SNP pairs ranged from 10 to 50 mg/dl.
Pairwise LD between the 13 SNPs involved in the ten pairs of SNPs identified by our analyses was evaluated to identify multiple significant SNP pairs that may represent a single functional interaction. A summary of the estimates of a composite measure of LD for these 13 SNPs is shown in table 5. SNPs 01899, 03132 and 03581, are in high LD (>0.75) in both African-Americans and European-Americans suggesting they are marking the same variations in the gene cluster. SNPs 15830 and 16960 are also in high LD in both ethnic strata. These patterns of LD suggest that there are two groups of SNP pairs exhibiting redundant evidence for interaction (group A: 03132–05124 and 03581–05124; group B: 01899–15830, 03132–15830, 03581–15830 and 03581–16960).
Table 5.
The squared correlation between pairs of SNPs (ρAB 2 ) for African-American (lower left hand corner) and European-American (upper right hand corner) strata for thirteen SNPs
| Gene | SNP | A1 1899 | A1 2110 | A1 2957 | A1/C3 3132 | A1/C3 3581 | A1/C3 5124 | C3 6957 | C3 8143 | C3 9154 | A4 15830 | A4 16960 | A5 27741 | A5 29085 |
|---|---|---|---|---|---|---|---|---|---|---|---|---|---|---|
| A1 | 1899 | 0.000 | 0.000 | 0.878*** | 0.695*** | 0.002 | 0.002 | 0.071*** | 0.005** | 0.005** | 0.004** | 0.010*** | 0.000 | |
| A1 | 2110 | 0.009*** | 0.894*** | 0.000 | 0.000 | 0.186*** | 0.521*** | 0.017*** | 0.002 | 0.082*** | 0.007*** | 0.004** | 0.000 | |
| A1 | 2957 | 0.017*** | 0.522*** | 0.000 | 0.000 | 0.204*** | 0.535*** | 0.019*** | 0.001 | 0.077*** | 0.007*** | 0.005** | 0.000 | |
| A1/C3 | 3132 | 0.861*** | 0.011*** | 0.021*** | 0.810*** | 0.004* | 0.002* | 0.070*** | 0.007*** | 0.005** | 0.004* | 0.012*** | 0.000 | |
| A1/C3 | 3581 | 0.771*** | 0.008*** | 0.016*** | 0.907*** | 0.001 | 0.001 | 0.052*** | 0.012*** | 0.004** | 0.004* | 0.011*** | 0.001 | |
| A1/C3 | 5124 | 0.018*** | 0.431*** | 0.627*** | 0.024*** | 0.019*** | 0.088*** | 0.162*** | 0.171*** | 0.579*** | 0.388*** | 0.021*** | 0.001 | |
| C3 | 6957 | 0.027*** | 0.333*** | 0.157*** | 0.026*** | 0.019*** | 0.101*** | 0.039*** | 0.010*** | 0.037*** | 0.012*** | 0.006** | 0.001 | |
| C3 | 8143 | 0.001 | 0.089*** | 0.139*** | 0.000 | 0.000 | 0.172*** | 0.093*** | 0.457*** | 0.220*** | 0.169*** | 0.099*** | 0.018*** | |
| C3 | 9154 | 0.026*** | 0.185*** | 0.080*** | 0.032*** | 0.036*** | 0.138*** | 0.175*** | 0.443*** | 0.304*** | 0.341*** | 0.047*** | 0.002* | |
| A4 | 15830 | 0.002 | 0.003* | 0.001 | 0.002 | 0.002* | 0.013*** | 0.058*** | 0.027*** | 0.046*** | 0.714*** | 0.028*** | 0.005** | |
| A4 | 16960 | 0.001 | 0.033*** | 0.016*** | 0.001 | 0.001 | 0.001 | 0.125*** | 0.029*** | 0.049*** | 0.738*** | 0.019*** | 0.002 | |
| A5 | 27741 | 0.003* | 0.013*** | 0.027*** | 0.000 | 0.001 | 0.035*** | 0.045*** | 0.082*** | 0.034*** | 0.000 | 0.001 | 0.008*** | |
| A5 | 29085 | 0.002 | 0.001 | 0.035*** | 0.004* | 0.004* | 0.036*** | 0.002 | 0.000 | 0.031*** | 0.011*** | 0.006** | 0.009*** |
At α = 0.05,
at α = 0.01,
at α = 0.001 indicates statistically significant evidence for linkage disequilibrium.
Discussion
Our results establish that there are multiple SNPs within the APOA1/C3/A4/A5 gene cluster that do not have significant genotype effects when considered separately, but combine to define two-SNP genotypes that have significant effects on plasma TC levels. The distribution of these SNPs throughout the gene cluster implicates the involvement of multiple gene regions that are involved in defining SNP-SNP interactions. Heterogeneity of the relative frequencies of the two SNP genotypes among samples from different populations has a large influence on the ability to compare phenotype-genotype relationships across populations.
Interaction and Marginal Effects
The approach to modeling epistasis defined by Cockerham [29] and the more recent method for estimating physiological epistasis defined by Cheverud and Routman [30] cannot be applied in this study because for nearly every pair of SNPs there are missing two-site genotype classes and the relative genotype frequencies of the two SNPs are correlated. As an alternative we chose the Searle method [25] to estimate and compare average phenotype values of two-SNP genotypes to determine if single-SNP genotype effects combine non-additively to influence variation in trait values.
A common approach in genetic research is to estimate interaction between loci only when there is evidence that each of locus has a statistically significant influence on trait variation when considered separately [31, 32]. Culverhouse et al. [33] has shown that variable loci that have no marginal genotype effects can still have a component of genetic variance attributable to epistatic effects. Several examples in the literature support this possibility. Nelson et al. [34] reported a significant joint effect of variable sites in the APOA1/C3/A4 gene cluster and the low density lipoprotein receptor gene in determining interindividual variability in TG levels, although the influence of individual variable sites was not statistically significant. Our recent work with the APOE gene also demonstrated non-additive two-SNP genotype effects in the absence of significant single-SNP genotype effects [26]. Similarly, the number of SNPs in the APOA1/C3/A4/A5 gene cluster that have a significant impact on explaining variation in plasma TC level is underestimated by considering only single-SNP analyses. Only one SNP had a significant impact of plasma TC levels that was consistent in both female samples. Twelve of the 80 SNPs involved in pairwise interactions would not have been considered candidates for marking functional gene variation if only single-SNP analyses were considered. Many of these SNPs only have a significant effect in the presence of heterozygosity at a second SNP. This is the type of interaction that will not be detected using single-SNP analyses because SNP genotypes have an effect in only a subset of the population or opposite and canceling effects when in combination with the genotype defined by the second SNP. These statistical results are consistent with the experimental findings in yeast [35, 36], and the working hypothesis that interactions between the effects of genetic variants, and between the effects of genetic variants and exposures to the environment, not the genetic variants themselves, are the primary causes of phenotypic variability [37].
Cholesterol Effects
Genetic variations in the APOA1/C3/A4/A5 gene cluster have been associated with familial combined hyperlipidemia (FCHL) and therefore have been implicated in influencing TC levels [38, 39]. However, an association of TC levels with particular single-site genotypes in the general population has not been consistent across studies [10]. By considering the interactions between SNP effects we were able to observe a consistent influence of the gene cluster on TC levels in females in both African-American and European-American ethnic strata. These effects appear to be independent of the effects of variation in the gene cluster on TG and HDL-C, since none of the ten pairs of SNPs had a consistent non-additive influence of SNP effects on these traits in both ethnic strata. The effects of non-additivity do not necessarily influence a large number of individuals (smallest genotypic class involved four individuals), but the impact of non-additivity on the genotypic value of individuals with these particular two-SNP genotypes may be quite large (differences between two-SNP genotypes ranged from 10–50 mg/dl).
SNP Location and Function
The 13 SNPs that are involved in the ten pairs that showed significant evidence for interaction in African-American and European-American females are located throughout the gene cluster (denoted by shading in fig. 1) suggesting that non-coding regions of the genome may be important for determining phenotypic levels. Nine of the 13 SNPs are located in the APOA1/C3 region. Two of these nine SNPs are located in an intronic region in the APOA1 (01899 and 02110) gene, four (02957, 03132, 03581 and 05124) are located in the intergenic region 3′ to the polyadenylation signals in the APOA1 and APOC3 genes, two are located in intronic regions of the APOC3 (06957 and 08143) gene and one is located in the region 5′ to the transcription start site of the APOC3 (09154) gene. While the 01899, 02110, 02957, 03132, 03581, 05124, 06957 and 08143 SNPs have not been previously considered in studies of lipid metabolism, other SNPs in the APOA1/C3 intergenic region have been shown to predict FCHL status [40]. None of these SNPs are known to be in regulatory regions, although it has been shown that the APOA1/C3 intragenic region may be involved in regulating these two genes [41]. Levels of HDL-C, TG and apoA-I and risk of developing hypertriglyceridemia have been associated with the 09154 (C-482T) SNP [42–45]. This SNP falls within a functional insulin response element and is located between two other promoter elements in the 5′ region of the APOC3 gene [43, 46].
Two of the 13 SNPs were located in the APOA5 gene. One of these (27741) is in the region 5′ to the transcription start site and one (29085) is a synonymous polymorphism located in the second exon. Neither of these SNPs has been investigated previously to determine whether they have a significant influence on measures of lipid metabolism. The remaining two of the 13 SNPs were located in APOA4. One is a synonymous polymorphism located in the second exon (15830) and one is a non-synonymous substitution in the third exon (16960). Measures of lipid metabolism have not been previously associated with the SNP at location 15830.
Statistical methods applied to population-based data cannot distinguish which SNPs within a gene are responsible for the observed phenotype-genotype associations due to the patterns of LD. Laboratory studies using experimental animal models and biochemical and physiological studies of individuals with particular genotypes have been suggested for sorting out which combinations of SNPs have a biological function and are responsible for the statistical results obtained from a population-based association study. However, such experimental and clinical studies may fall short because they cannot replicate the interaction in the particular genetic and environmental backgrounds that may influence the observed phenotype-genotype relationships in the human population at large. In the end, it may be very difficult to know with great precision, which SNPs, in which subset of individuals, are biologically responsible for the observed statistical associations.
Population Genetic Structure and Interaction
We required that a pair of SNPs show significant evidence for interaction in both African-American and European-American females to reduce the probability that the observed significance in either strata was due to a type I error. The differences in relative genotype frequencies between ethnic strata greatly limited our ability to observe consistent evidence of non-additivity. Theoretically, for 80 SNPs there are 3,160 SNP pairs for which it is possible to estimate interaction. Because of missing classes of genotypes in particular ethnic strata, it was possible to estimate non-additivity of SNP genotype effects for only 2,542 pairs of SNPs in African-American females, 1,840 pairs of SNPs in European-American females and 1,586 pairs of SNPs in both strata. Although replication of statistical significance across studies of multiple populations is considered the gold standard for minimizing the probability of committing a type I error, this strategy carries the penalty that it may fail to identify the interaction effects that are context-specific because the multi-locus genotypes necessary to estimate interaction do not occur in all populations being considered.
Conclusions
In this paper we applied an analytical strategy that identified consistent gender dependent SNP-SNP interaction effects. Our application of this strategy illustrates the potential complexity of the phenotype-genotype relationships that must be considered in unraveling the contribution of genetic variation to quantitative variation in risk of a common disease. Non-additivity of gene effects may play a major role in determining susceptibility to a common disease having a complex multifactorial etiology because of the ubiquity of biochemical interactions in gene regulation and in the metabolic systems that are involved [47]. The statistical interactions we detected may reflect physical interactions between the coded proteins and biomolecules or may mark molecules that do not interact directly but impact the phenotype non-additively via alternative pathways, although the caveat must be made that the correspondence between statistical interaction and biological interaction is tenuous at best [48, 49]. The reality of non-additivity of SNP effects calls into question the assumption that any SNP that has a biologically meaningful affect on the phenotype must exhibit a statistically significant marginal effect. Most SNPs may only have an influence on a trait level within a particular genetic background. The key to dissecting the genetic architecture of complex traits is to determine the genetic and environmental context in which a SNP has an impact on phenotypic variation. We have shown that multi-SNP A1/C3/A4/A5 genotypes, not a particular single-SNP variation, is the unit of genomic information for predicting an individual’s TC level in a particular context indexed by gender. The consequences of ignoring the genetic background in which a SNP influences a quantitative trait could be a serious bias in the incorporation of genomic information into strategies for developing personalized medical approaches to the diagnosis and treatment of common diseases having a complex multifactorial etiology.
Acknowledgments
We thank Christine Brown, Michael Glynn, Lynn Illeck, Paul Kopec, Thomas Rea, Deborah Theodore and Kenneth Weiss at the University of Michigan and Megan Grove at the University of Texas Health Science Center at Houston for their technical assistance and for critical comments that helped shape this manuscript. This research was supported by NIH grants GM065509, HL039107, HL072904, HL072905, HL072810, HC048047, HC048048, HC048049, HC048050 and HC095095.
References
- 1.National Heart, Lung, and Blood Institute . Morbidity and mortality 2002 chart book on cardiovascular, lung and blood diseases. National Institutes of Health; Bethesda, MD.: 2002. [Google Scholar]
- 2.Fielding CJ, Shore VG, Fielding PE. A protein co-factor of lecithin: cholesterol acyltransferase. Biochem Biophys Res Commun. 1972;46:1493–1498. doi: 10.1016/0006-291x(72)90776-0. [DOI] [PubMed] [Google Scholar]
- 3.Barter PJ. Hugh Sinclair Lecture: the regulation and remodeling of HDL by plasma factors. Atheroscler Supp. 2002;3:39–47. doi: 10.1016/s1567-5688(02)00041-7. [DOI] [PubMed] [Google Scholar]
- 4.Windler E, Chao Y, Havel R. Regulation of the hepatic uptake of triglyceride-rich lipoproteins in the rat. Opposing effects of homologous apolipoprotein E and individual C apoproteins. J Biol Chem. 1980;255:8303–8307. [PubMed] [Google Scholar]
- 5.Stan S, Delvin E, Lambert M, Seidman E, Levy E. Apo A-IV: An update on regulation and physiologic functions. Biochim Biophys Acta. 2003;1631:177–187. doi: 10.1016/s1388-1981(03)00004-0. [DOI] [PubMed] [Google Scholar]
- 6.Pennacchio LA, Olivier M, Hubacek JA, Cohen JC, Cox DR, Fruchart JC, Krauss RM, Rubin EM. An apolipoprotein influencing triglycerides in humans and mice revealed by comparative sequencing. Science. 2001;294:169–173. doi: 10.1126/science.1064852. [DOI] [PubMed] [Google Scholar]
- 7.Schaap FG, Rensen PC, Voshol PJ, Vrins C, van der Vliet HN, Chamuleau RA, Havekes LM, Groen AK, van Dijk KW. ApoAV reduces plasma triglycerides by inhibiting very low density lipoprotein-triglyceride (VLDL-TG) production and stimulating lipoprotein lipase-mediated VLDL-TG hydrolysis. J Biol Chem. 2004;279:27941–27947. doi: 10.1074/jbc.M403240200. [DOI] [PubMed] [Google Scholar]
- 8.van Dijk KW, Rensen PC, Voshol PJ, Havekes LM. The role and mode of action of apolipoproteins CIII and AV: Synergistic actors in tri-glyceride metabolism? Curr Opin Lipidol. 2004;15:239–246. doi: 10.1097/00041433-200406000-00002. [DOI] [PubMed] [Google Scholar]
- 9.Pennacchio LA, Rubin EM. Apolipoprotein A5, a newly identified gene that affects plasma triglyceride levels in humans and mice. Arterioscler Thromb Vasc Biol. 2003;23:529–534. doi: 10.1161/01.ATV.0000054194.78240.45. [DOI] [PubMed] [Google Scholar]
- 10.Groenendijk M, Cantor RM, de Bruin TW, Dallinga-Thie GM. The apoAI-CIII-AIV gene cluster. Atherosclerosis. 2001;157:1–11. doi: 10.1016/s0021-9150(01)00539-1. review. [DOI] [PubMed] [Google Scholar]
- 11.Eichenbaum-Voline S, Olivier M, Jones EL, Naoumova RP, Jones B, Gau B, Patel HN, Seed M, Betteridge DJ, Galton DJ, Rubin EM, Scott J, Shoulders CC, Pennacchio LA. Linkage and association between distinct variants of the APOA1/C3/A4/A5 gene cluster and familial combined hyperlipidemia. Arterioscler Thromb Vasc Biol. 2004;24:167–174. doi: 10.1161/01.ATV.0000099881.83261.D4. [DOI] [PMC free article] [PubMed] [Google Scholar]
- 12.Lai CQ, Demissie S, Cupples LA, Zhu Y, Adiconis X, Parnell LD, Corella D, Ordovas JM. Influence of the APOA5 locus on plasma triglyceride, lipoprotein subclasses, and CVD risk in the Framingham Heart Study. J Lipid Res. 2004;45:2096–2105. doi: 10.1194/jlr.M400192-JLR200. [DOI] [PubMed] [Google Scholar]
- 13.Wang QF, Liu X, O’Connell J, Peng Z, Krauss RM, Rainwater DL, VandeBerg JL, Rubin EM, Cheng JF, Pennacchio LA. Haplotypes in the APOA1-C3-A4-A5 gene cluster affect plasma lipids in both humans and baboons. Hum Mol Genet. 2004;13:1049–1056. doi: 10.1093/hmg/ddh121. [DOI] [PubMed] [Google Scholar]
- 14.Klos KL, Hamon S, Clark AG, Boerwinkle E, Liu K, Sing CF. The influence of APOA5 polymorphisms on variation in plasma triglycerides in young, healthy African-Americans and Whites of the CARDIA study. J Lipid Res. 2004;46:564–570. doi: 10.1194/jlr.M400437-JLR200. [DOI] [PubMed] [Google Scholar]
- 15.Talmud PJ, Humphries SE. Gene: Environment interactions and coronary heart disease risk. World Rev Nutr Diet. 2004;93:29–40. doi: 10.1159/000081250. [DOI] [PubMed] [Google Scholar]
- 16.Tiret L. Gene-environment interaction: A central concept in multifactorial diseases. Proc Nutr Soc. 2002;61:457–463. doi: 10.1079/pns2002178. [DOI] [PubMed] [Google Scholar]
- 17.Ellsworth DL, Sholinsky P, Jaquish C, Fabsitz RR, Manolio TA. Coronary heart disease. At the interface of molecular genetics and preventive medicine. Am J Prev Med. 1999;16:122–133. doi: 10.1016/s0749-3797(98)00138-x. [DOI] [PubMed] [Google Scholar]
- 18.Barrett-Connor E. Sex differences in coronary heart disease. Why are women so superior? The 1995 Ancel Keys Lecture. Circulation. 1997;95:252–264. doi: 10.1161/01.cir.95.1.252. [DOI] [PubMed] [Google Scholar]
- 19.Weiss LA, Pan L, Abney M, Ober C. The sex-specific genetic architecture of quanititative traits in humans. Nat Genet. 2006;38:218–222. doi: 10.1038/ng1726. [DOI] [PubMed] [Google Scholar]
- 20.Friedman GD, Cutter GR, Donahue RP, Hughes GH, Hulley SB, Jacobs DR, Jr, Liu K, Savage PJ. CARDIA: study design, recruitment, and some characteristics of the examined subjects. J Clin Epidemiol. 1988;41:1105–1116. doi: 10.1016/0895-4356(88)90080-7. [DOI] [PubMed] [Google Scholar]
- 21.Warnick GR. Enzymatic methods for quantification of lipoprotein lipids. Methods Enzymol. 1986;129:101–123. doi: 10.1016/0076-6879(86)29064-3. [DOI] [PubMed] [Google Scholar]
- 22.Fullerton SM, Buchanan AV, Sonpar VA, Taylor SL, Smith JD, Carlson CS, Salomaa V, Stengård JH, Boerwinkle E, Clark AG, Nickerson DA, Weiss KM. The effects of scale: variation in the APOA1/C3/A4/A5 gene cluster. Hum Genet. 2004;115:36–56. doi: 10.1007/s00439-004-1106-x. [DOI] [PubMed] [Google Scholar]
- 23.Sokal RR, Rohlf FJ. Biometry: The Principles and Practice of Statistics in Biological Research. 3rd. New York, NY: WH Freeman and Co.; 1995. [Google Scholar]
- 24.Weir BS. Genetic Data Analysis II. Sunderland, MA: Sinauer Associates, Inc.; 1996. [Google Scholar]
- 25.Searle SR. Linear Models. New York, NY: Wiley and Sons; 1971. [Google Scholar]
- 26.Hamon SC, Stengård JH, Clark AG, Salomaa V, Boerwinkle E, Sing CF. Evidence for non-additive influence of single nucleotide polymorphisms within the apolipoprotein E gene. Ann Hum Genet. 2004;68:521–535. doi: 10.1046/j.1529-8817.2003.00112.x. [DOI] [PubMed] [Google Scholar]
- 27.Good PI. Permutation Tests: A Practical Guide to Resampling Methods for Testing Hypotheses. New York, NY: Springer-Verlag; 2000. [Google Scholar]
- 28.Churchill GA, Doerge RW. Empirical threshold values for quantitative trait mapping. Genetics. 1994;138:963–971. doi: 10.1093/genetics/138.3.963. [DOI] [PMC free article] [PubMed] [Google Scholar]
- 29.Cockerham CC. An extension of the concept of partitioning hereditary variance for analysis of covariances among relatives when epistasis is present. Genetics. 1954;39:51–54. doi: 10.1093/genetics/39.6.859. [DOI] [PMC free article] [PubMed] [Google Scholar]
- 30.Cheverud JM, Routman EJ. Epistasis and its contribution to genetic variance components. Genetics. 1995;139:1455–1461. doi: 10.1093/genetics/139.3.1455. [DOI] [PMC free article] [PubMed] [Google Scholar]
- 31.Blangero J, Williams JT, Almasy L. Quantitative trait locus mapping using human pedigrees. Hum Biol. 2000;72:35–62. [PubMed] [Google Scholar]
- 32.Mackay TF. The genetic architecture of quantitative traits. Ann Rev Genet. 2001;35:303–333. doi: 10.1146/annurev.genet.35.102401.090633. [DOI] [PubMed] [Google Scholar]
- 33.Culverhouse R, Suarez BK, Lin J, Reich T. A perspective on epistasis: Limits of models displaying no main effect. Am J Hum Genet. 2002;70:461–471. doi: 10.1086/338759. [DOI] [PMC free article] [PubMed] [Google Scholar]
- 34.Nelson M, Kardia SL, Ferrell RE, Sing CF. A combinatorial partitioning method to identify multilocus genotypic partitions that predict quantitative trait variation. Genome Res. 2001;11:458–470. doi: 10.1101/gr.172901. [DOI] [PMC free article] [PubMed] [Google Scholar]
- 35.Hartwell L. Robust interactions. Science. 2004;303:774–775. doi: 10.1126/science.1094731. [DOI] [PubMed] [Google Scholar]
- 36.Dolinski K, Botstein D. Changing perspectives in yeast research nearly a decade after the genome sequence. Genome Res. 2005;15:1611–1619. doi: 10.1101/gr.3727505. [DOI] [PubMed] [Google Scholar]
- 37.Sing CF, Stengård JH, Kardia SLR. Dynamic relationships between the genome and exposures to environments as causes of common human diseases; in Simopoulos AP, Ordovas JM (eds): Nutrigenetics and Nutrigenomics. World Rev Nutr Diet, Basel, Karger. 2004;93:77–91. doi: 10.1159/000081252. [DOI] [PubMed] [Google Scholar]
- 38.Wojciechowski AP, Farrall M, Cullen P, Wilson TME, Bayliss JD, Farren B, Griffin BA, Caslake MJ, Packard CJ, Shepherd J, Thakker R, Scott J. Familial combined hyperlipidaemia linked to the apolipoprotein AI-CIII-AIV gene cluster on chromosome 11q23-q24. Nature. 1991;349:161–164. doi: 10.1038/349161a0. [DOI] [PubMed] [Google Scholar]
- 39.Shoulders CC, Ball MJ, Baralle FE. Variation in the apo AI/CIII/AIV gene complex: Its association with hyperlipidemia. Atherosclerosis. 1989;80:111–118. doi: 10.1016/0021-9150(89)90018-x. [DOI] [PubMed] [Google Scholar]
- 40.Groenendijk M, Cantor RM, De Bruin TWA, Dallinga-Thie GM. New genetic variants in the apoA-I and apoC-III genes and familial combined hyperlipidemia. J Lipid Res. 2001;42:188–194. [PubMed] [Google Scholar]
- 41.Haase A, Stoffel W. The 3′-flanking region shared by the human apolipoprotein AI and CIII gene regulates gene expression in cooperation with 5′-flanking elements. Biol Chem Hoppe Seyler. 1990;371:375–382. doi: 10.1515/bchm3.1990.371.1.375. [DOI] [PubMed] [Google Scholar]
- 42.Dammerman M, Sandkuijl L, Halaas J, Chung W, Breslow J. An apolipoprotein CIII haplotype protective against hypertriglyceridemia is specified by promoter and 3′ untranslated region polymorphisms. Proc Natl Acad Sci USA. 1993;90:4562–4566. doi: 10.1073/pnas.90.10.4562. [DOI] [PMC free article] [PubMed] [Google Scholar]
- 43.Li WW, Dammerman MM, Smith JD, Metzger S, Breslow JL, Leff T. Common genetic variation in the promoter of the human apoCIII gene abolishes regulation by insulin and may contribute to hypertriglyceridemia. J Clin Invest. 1995;96:2601–2605. doi: 10.1172/JCI118324. [DOI] [PMC free article] [PubMed] [Google Scholar]
- 44.Hoffer M, Sijbrands E, de Man F, Havekes L, Smelt A, Frants R. Increased risk for endogenous hypertriglyceridaemia is associated with an apolipoprotein C3 haplotype specified by the SstI polymorphism. Eur J Clin Invest. 1998;28:807–812. doi: 10.1046/j.1365-2362.1998.00361.x. [DOI] [PubMed] [Google Scholar]
- 45.Miller M, Rhyne J, Khatta M, Parekh H, Zeller K. Prevalence of the APOC3 promoter polymorphisms T-455C and C-482T in Asian-Indians. Am J Cardiol. 2001;87:220–221. doi: 10.1016/s0002-9149(00)01322-9. [DOI] [PubMed] [Google Scholar]
- 46.Zannis VI, Kan HY, Kritis A, Zanni E, Kardassis D. Transcriptional regulation of the human apolipoprotein genes. Front Biosci. 2001;6:D456–D504. doi: 10.2741/zannis. [DOI] [PubMed] [Google Scholar]
- 47.Nagel RL. Epistasis and the genetics of human diseases. C R Biol. 2005;328:606–615. doi: 10.1016/j.crvi.2005.05.003. [DOI] [PubMed] [Google Scholar]
- 48.Lewontin RC. The analysis of variance and the analysis of causes. Am J Hum Genet. 1974;26:400–411. [PMC free article] [PubMed] [Google Scholar]
- 49.Moore JH, Williams SM. Traversing the conceptual divide between biological and statistical epistasis: Systems biology and a more modern synthesis. Bioessays. 2005;27:637–646. doi: 10.1002/bies.20236. [DOI] [PubMed] [Google Scholar]