Abstract
A limitation of many gene expression analytic approaches is that they do not incorporate comprehensive background knowledge about the genes into the analysis. We present a computational method that leverages the peer-reviewed literature in the automatic analysis of gene expression data sets. Including the literature in the analysis of gene expression data offers an opportunity to incorporate functional information about the genes when defining expression clusters. We have created a method that associates gene expression profiles with known biological functions. Our method has two steps. First, we apply hierarchical clustering to the given gene expression data set. Secondly, we use text from abstracts about genes to (i) resolve hierarchical cluster boundaries to optimize the functional coherence of the clusters and (ii) recognize those clusters that are most functionally coherent. In the case where a gene has not been investigated and therefore lacks primary literature, articles about well-studied homologous genes are added as references. We apply our method to two large gene expression data sets with different properties. The first contains measurements for a subset of well-studied Saccharomyces cerevisiae genes with multiple literature references, and the second contains newly discovered genes in Drosophila melanogaster; many have no literature references at all. In both cases, we are able to rapidly define and identify the biologically relevant gene expression profiles without manual intervention. In both cases, we identified novel clusters that were not noted by the original investigators.
INTRODUCTION
High throughput gene expression analysis offers an opportunity to assay the induction of all genes in an organism. Recent applications include profiling of human cancer specimens (1–3), tracking gene expression during fruit fly development (4,5) and the comprehensive measurement of yeast gene expression in response to specific gene deletions (6,7). A challenge in the field has been to rapidly analyze and interpret these comprehensive data sets with hundreds of measurements of thousands of genes. It is critical to include comprehensive background knowledge to appropriately analyze such data sets and to fully understand them. We have argued elsewhere that it is effective to use computational methods that incorporate external information, such as functional information about the genes, upstream nucleotide sequences and scientific literature, to help drive the interpretation and organization of the expression data (8).
Currently, clustering methods that use no background knowledge remain the most popular computational approach to apply to gene expression data. Clustering methods organize complex expression data sets into tractable subgroups, or clusters, of genes sharing similar expression patterns and thus suggesting co-regulation and possibly common biological function (9,10). Careful examination of the genes that cluster together can lead to hypotheses about gene function and co-regulation. However, the quality of clusters and their ability to explain biological function can vary greatly.
Published scientific text contains a distilled version of all of the most significant biological discoveries and is a potent source of functional information for analytical algorithms. Text analysis of scientific literature has been applied successfully to many biological problems (11). Article abstracts about genes can successfully predict gene function (12–15). Genes can be clustered based on text in the scientific literature into functionally related groups (16). Co-occurrence of gene names in abstracts implies networks of related genes that are potentially useful for gene expression analysis (17).
The most commonly used clustering method, hierarchical clustering, offers considerable ambiguity in determining the exact cluster boundaries. Hierarchical clustering organizes expression data into a binary tree, in which the leaves are genes and the interior nodes (or branch points) are candidate clusters (Fig. 1) (10). The more similar the gene expression patterns of two genes, the closer they are within the tree structure. In many cases, genes with a shared biological function also share expression features and therefore cluster together in a node.
Figure 1.
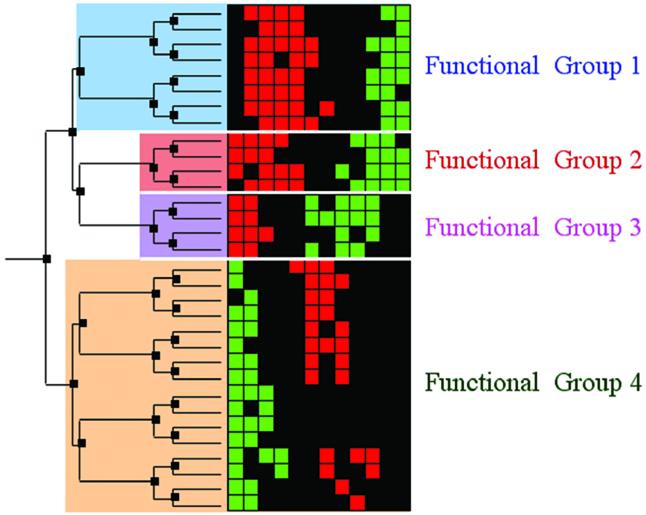
Hierarchical clustering and cluster boundary definition. A schematic of hierarchically clustered expression data with subsequent cluster boundary definition. On the right are gene expression data represented as a colored grid. Each row in the grid represents the expression of a single gene across multiple conditions; each column represents the expression of each of the genes in a specific condition. Red squares indicate gene induction, while green squares indicate repression. On the left is a tree generated by a hierarchical clustering algorithm. The tree consists of nodes (dark boxes) that organize the genes according to expression similarity. All of the genes that descend from one node are the genes in the candidate cluster defined by that node. In this schematic, we illustrate a pruning of the tree into four disjoint biologically relevant gene clusters. Pruning the tree defines concrete clusters and their boundaries. After clustering the data, one must identify the biologically significant candidate clusters. Typically, careful expert examination of the genes in the clusters is required to identify the critical clusters in which the genes share function and to draw cluster boundaries that respect biological function. We assert that scientific literature can be mined automatically instead to identify biologically consistent clusters, and to draw cluster boundaries that respect biological function.
Once a tree has been devised, the challenge is to properly define the final cluster boundaries by pruning the tree or, in other words, to select nodes appropriately so that the genes are divided into non-overlapping biologically meaningful clusters. Typically, cluster boundaries are drawn so that the final clusters contain functionally related genes. In practice, investigators define clusters by a manual scan of the genes in each node and rely on their biological expertise to notice shared functional properties of genes within a node, and then select the nodes that are most coherent. The entire process is very laborious, as it must be done one node at a time. Some have proposed automatically selecting nodes and defining boundaries based on statistical properties of the gene expression profiles within them; however, the same statistical criteria may not be generally applicable to identify all relevant biological functions (18).
We previously have described and evaluated a computational method, neighbor divergence per gene (NDPG), which uses scientific text to compute an information theoretical score indicating how functionally coherent a set of genes is (19–21). Thus, groups of genes with shared function receive high scores. The method requires a corpus of documents and an index connecting the documents to genes. Here we investigate the application of the literature-based NDPG approach at resolving gene expression cluster boundaries. We use scientific literature to define cluster boundaries by selecting a disjoint set of nodes that correspond to biological functions. Our method selects nodes so that the total weighted average of NDPG cluster scores is maximal. Since selected nodes with the highest scores are likely to constitute functionally relevant clusters, the NDPG scores can be used to prioritize clusters for subsequent detailed manual analysis and experimental follow-up.
To test our method, we applied our pruning method to the Saccharomyces cerevisiae (yeast) gene expression data set based on measurements of 2467 genes over 79 experimental conditions published by Eisen and colleagues (10). This data set contains measurements of mostly well-studied genes whose functions have been elucidated and described in the literature. If our method is successful, the expression clusters defined by our method should correspond to well-defined functional groups of genes. Fortunately, a carefully constructed catalog of yeast gene functions, gene ontology (GO), is available for use as a gold standard for comparison (22).
In a more challenging test, we applied this strategy to analyzing a Drosophila melanogaster (fly) development series containing expression measurements for 3987 genes, most of which are poorly characterized (4). This data set is more challenging since only 1681 of the genes have any primary literature. To effectively use our literature-based method with a data set with a paucity of literature, we can use sequence similarity searches to identify homologous genes for each gene in the study, and associate references from the homologous gene to the study gene. Such references augmented the number of genes with references while providing clues about potential gene functions.
In both cases, we are able to successfully define and identify the key reported functional groups of genes guided only by the scientific literature. In addition, we also find novel clusters not reported in the original publications. Our results are comparable with those produced manually by the original investigators and required only about an hour of computation.
MATERIALS AND METHODS
Defining hierarchical cluster boundaries
Application of hierarchical clustering on K genes yields K – 1 internal nodes containing at least two genes, and K leaf nodes containing a single gene. The root node contains all K genes. The goal of the algorithm presented here is ‘prune the tree’, or rather to select a subset of nodes, S, such that each gene is contained in a single selected node (Fig. 1). The objective of our pruning strategy is to maximize the functional relatedness of the genes in each selected node based on the scientific literature. To this end, we select nodes so that the weighted average of the literature-based NDPG functional coherence score is maximized. This method also applies if an alternative functional coherence metric is used instead.
The NDPG weighted average of a disjoint set of nodes S, is defined as:
where fi is the NDPG score of the node i, and K is the total number of genes. The average is weighted by the number of genes in the node i, ni. Our algorithm selects disjoint nodes S so that equation 1 is maximized. The key insight to the algorithm is that if a node is in the optimal set, then the NDPG score of the node must exceed the weighted average NDPG score of any disjoint set of its descendants.
Our algorithm has three states that a node can be in: unvisited, visited and selected. After running the algorithm, the set of selected nodes constitutes the final set S of clusters; the remainder of the nodes will be in the visited state.
The algorithm is summarized in Table 1. Initially all internal nodes are unvisited and the terminal leaves are selected. The pruning algorithm proceeds iteratively, visiting unvisited nodes whose descendants are in the visited or selected state; the status of the node is changed to visited. If the functional coherence score of this node equals or exceeds that of the weighted average of its selected descendants, it is placed in the selected state, and all of its selected descendant children are de-selected and placed in the visited state. The process repeats until all nodes up to the root node have been examined; the nodes that are still selected define the final set of clusters that maximize NDPG weighted average across the hierarchical tree.
Table 1. Algorithm to define cluster boundaries.
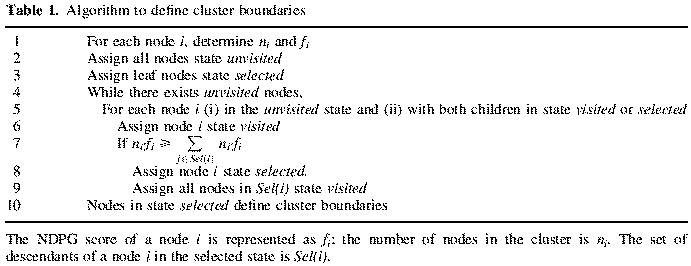
The NDPG score of a node i is represented as fi; the number of nodes in the cluster is ni. The set of descendants of a node i in the selected state is Sel(i).
Literature reference indices
Reference indices connecting each of the PubMed abstracts to the genes are required for NDPG calculation. For yeast, we obtained the index from the Saccharomyces Genome Database (SGD) (23).
The fly data set contained expression measurements for 4040 expressed sequence tags (ESTs); 4032 of these corresponded to 3987 different known fly genes. The available reference index from Flybase contained PubMed references for only 1681 of the 3987 unique fly data set genes represented in the data set (24). We augmented this reference index by looking for well-documented genes in fly, mouse and yeast that have the protein sequences most similar to that of the gene protein product and then transferring its references. We were able to associate 3962 fly data set genes with protein sequences from SWISS-PROT or SPTREMBL. We then identified all of the genes in fly, yeast and mouse with five or more PubMed references assigned by Flybase, SGD or the Mouse Genome Database (MGD); this constituted our set of well-documented genes. We obtained protein sequences for all of these genes from the same databases. Then, for each of these 3962 fly data set gene protein sequences, BLAST was used to find the single most similar well-documented protein sequence corresponding to a fly, yeast or mouse gene. The fly gene was assigned references from the most similar gene if the e-value score of the similarity was less than 1 × 10⁻⁶. We did not transfer references if the e-value was larger than this arbitrary threshold, as the similarity may have represented a local or spurious similarity.
Hierarchical clustering
For all data sets, we used the gene expression analysis software Cluster to create hierarchical clusterings (10). The yeast gene expression data set was published initially by Eisen and colleagues and consisted of 79 diverse conditions compiled from eight separate experimental series (10). Expression measurements were compiled on 2467 genes. To create the clustered dendrogram of the data, we used average linkage clustering with the centered correlation metric option to calculating inter-gene distances. In inter-gene distance calculations, conditions were differentially weighted according to the scheme introduced in the original publication; each condition was weighted with the square root of the number of conditions in that series.
The fly gene expression data set consisted of 4040 ESTs measured over 85 conditions, 75 of which were part of a wild-type developmental time series, four that were segregated by sex, and five that involved mutations in specific genes. To create the clustered dendrogram of the data, we used average linkage clustering with the uncentered correlation metric option to calculating inter-gene distances.
We define the tightness of a cluster as the correlation between the two nodes fused to constitute that cluster.
Scoring a cluster of genes for related function with scientific literature
To score how related a set of genes contained in a cluster are with the scientific literature automatically, we utilize the NDPG method; the details and validation of this method and its evaluation are provided elsewhere (19,20). Based on scientific literature, the method assigns a positive information theoretic score that is proportional to the number of genes in a group that share a common function. Detection of coherence is difficult in gene groups that are too small due to limited statistical power. In addition, coherent groups of genes that are too large are likely to share a function too broad to be of general interest. Therefore, in this study, groups containing fewer than six or more than 200 genes with at least one reference are assigned a score of zero.
NDPG requires a reference index that connects genes to articles as well as the text of the article abstracts. The abstracts were obtained from the PubMed database; only title and abstract fields were employed.
Given the text of the abstracts, NDPG identifies for each abstract the N most similar abstracts, or semantic neighbors, based on word use similarity between abstracts. Here we used n = 19, but n = 199 generated similar results. NDPG quantifies the similarity between two documents with the cosine angle between the two inverse document frequency weighted article abstract word vectors.
Then given a group of genes and reference index, NDPG scores each of the referring abstracts for overall relevance to the given gene group by counting the number of its semantic neighbors that also have references to group genes. For each gene in the group, the scores of its articles are compared with the expected distribution of scores if the group of genes was a random one. The functional relevance of each gene to the subgroup is scored as the KL-divergence between its article scores and the random distribution. The NDPG score for the group is the average divergence for all genes in the group.
GO annotations
For yeast, GO annotations were obtained from http://www.geneontology.org to use as a gold standard. GO is a hierarchical vocabulary of gene functional terms in which more general parent terms have more specific children terms. For each GO code, a functional group was defined that contained (i) all genes with that code as an annotation and (ii) all genes with a descendant of that code as an annotation. We used the January 23, 2002 release of GO component ontology, the January 24, 2002 releases of the GO process and function ontologies, and the January 24, 2002 GO gene associations for yeast. To assess the concordance or overlap of a cluster with a functional group, we used the following formula:
Where G is the GO functional group and C is the cluster of genes produced after resolving boundaries. This is the percentage of genes in either the cluster or the GO functional group that are in both.
RESULTS AND DISCUSSION
Analysis of the yeast data set
The literature reference index obtained from SGD had references available for 2394 of the 2467 genes (97%) in the data set. There were a total of 40 351 references to 17 858 articles. Each gene had a median of eight article references, but a mean of 16.9 references. The distribution of article references per gene is skewed; a few articles have many references. This data set had the advantage of containing genes that had excellent coverage in the scientific literature.
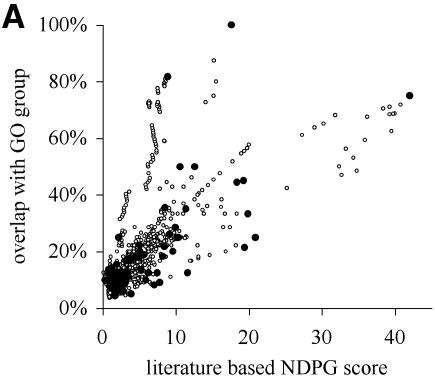
Hierarchical clustering of the yeast gene expression data set creates a total of 2466 internal nodes containing two or more genes; the availability of the SGD literature reference index and corpus of article abstracts allows NDPG evaluation of the functional coherence of each node. Here we use overlap with GO functional groups as an independent measure of functional coherence. An overlap of 100% indicates that the GO functional group and the node contain the same genes and the node is functionally coherent, while 0% indicates that there are no shared genes between the functional group and the node. In Figure 2A, we show that the literature-based NDPG score of a node predicts how well it corresponds to a GO functional group (non-parametric Spearman-rank correlation r = 0.81). Therefore, selecting nodes with large NDPG groups will result in selecting nodes whose genes share a common function.
Figure 2.
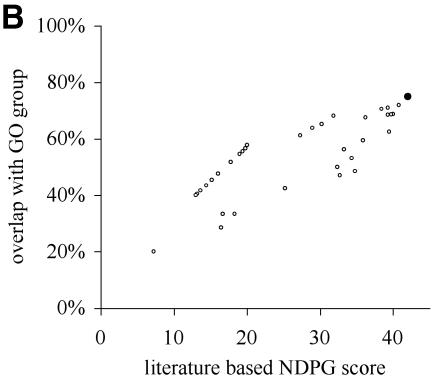
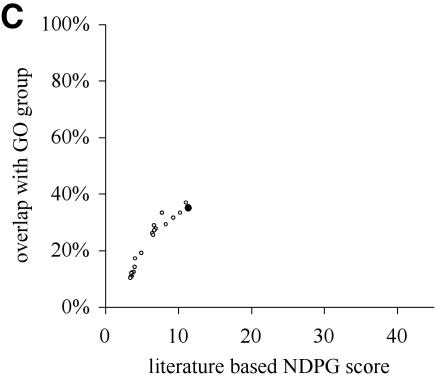
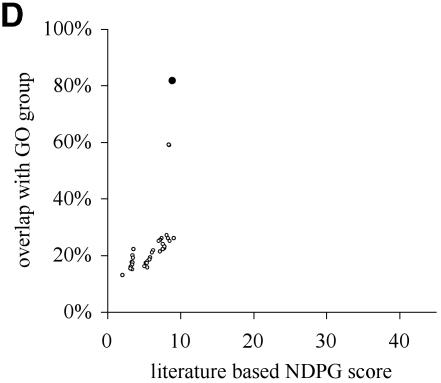
NDPG score correlates with cluster functional coherence. (A) After clustering the yeast gene expression data into 2466 nodes, we have plotted the literature-based NDPG score of the 1150 nodes containing 6–200 genes on the x-axis and the highest percentage concordance with a GO functional group on the y-axis. Black circles indicate the nodes selected by the computational method. (B) Similar to (A), except we have plotted the NDPG score and the highest percentage concordance with a GO functional group for the clusters containing threonine endopeptidase genes. The cluster selected by the algorithm is the black circle; other points represent nodes that are the ancestors and descendants of the selected node containing subsets or supersets of the genes in the selected node. (C) Similar plot for nodes containing heat shock genes. (D) Similar plot for nodes containing cytoplasmic ribosome genes.
Defining cluster boundaries that respect biological function by maximizing total NDPG weighted average selects 369 non-overlapping nodes as the final clusters. These nodes are indicated as black circles in Figure 2A. Figure 2B, C and D individually plot three of the selected nodes as black circles that correspond to biological functions: threonine endopeptidase, heat shock and cytosolic ribsome, respectively. The other points in these plots correspond to other nodes that are either ancestors or descendants of the selected node; these nodes contain a subset or superset of the genes in the selected nodes. The selected nodes usually have greater concordance with a GO functional group than almost all of the other nodes in the same plot; these are nodes that might have been selected instead.
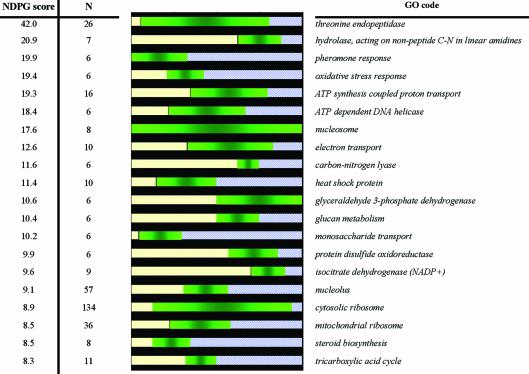
We ranked the clusters by NDPG scores; in Figure 3 we list the top 20 clusters. To evaluate whether the selected genes are true functional groups of genes, we checked the degree to which they corresponded to any of the functional groups defined by GO. Listed alongside the clusters is the best corresponding GO code and a graphical depiction of the overlap between that GO code and the cluster. Nine of the 10 functional clusters noted in the original publication of the data set are included in our list, along with other functional clusters (10). These functions include threonine endopeptidase, ATP synthesis-coupled proton response, ATP-dependent DNA helicase, nucleosome, electron transport, glyceraldehyde 3-phosphate dehydrogenase, cytosolic ribosome, mitochondrial ribosomeand tricarboxylic acid cycle (TCA). The other depicted groups also contain functionally related genes, but were not described in the original publication, such as pheromone response, heat shock protein and nucleolus.
Figure 3.
Top 20 yeast gene clusters in order of literature-based functional coherence. To check if these clusters correspond to groups of genes with shared function, we correlate the clusters with yeast GO codes. On the left of the graphic, we list the literature-based NDPG score of each cluster and the number of genes within the cluster. On the right, we list the GO code that best corresponds to the cluster. The length of the green bar in the graphic is proportional to the number of genes in the cluster that are also assigned the GO function listed on the right. The length of the yellow bar is proportional to the number of genes in the cluster not assigned the corresponding function by GO. The length of the blue bar is proportional to the number of additional genes assigned the GO function that are not in the cluster. The longer the green bar, the better the cluster represents that specific function.
It should be noted that for many functional groups, the percentage overlap underestimates the functional relatedness of the gene group. For example, the eleventh listed cluster has the highest overlap with the glyceraldehydes-3-phosphate dehydrogenase (G3PD) GO code, but the non-G3PD genes in the cluster are other closely related glycolysis genes.
Analysis of the fly data set
The initial literature reference index obtained from Flybase contained primary references for 1681 of the 3987 genes (42%) in the data set. There were a total of 30 622 references to 11 070 articles. Each gene had a median of three article references and a mean of 18.2 references.
In the augmented reference index, containing references transferred from homologous genes, 2602 of the 3987 genes (65%) had references. There were a total of 77 509 references to 29 115 articles. Each gene had a median of eight article references and a mean of 29.8 references.
Defining cluster boundaries by maximizing NDPG weighted average selects 525 non-overlapping nodes as the final clusters. Many of the defined clusters correspond to well-defined biological functions such as photoreceptor genes, protein degradation, protein synthesis, muscle function, citric acid cycle and proton transport (Table 2). Some of these clusters listed are graphically depicted in Figure 4; the others are available in the Supplementary Material. Most of these clusters corresponded exactly or closely to clusters described in the original publication of the data (4). These are discussed in detail, and validated with in situ hybridization and mutation experiments in that publication.
Table 2. Fly functional clusters.
| NDPG score | Tightness | n | Function |
|---|---|---|---|
| 22.5 | 0.93 | 7 | Nucleolar maternally expressed |
| 20.5 | 0.84 | 7 | Vacuolar ATPase |
| 8.3 | 0.79 | 7 | Photoreceptor |
| 6.7 | 0.71 | 41 | Proteasome |
| 6.6 | 0.71 | 8 | Vacuolar ATPase |
| 6.5 | 0.84 | 7 | T-ring complex |
| 6.0 | 0.81 | 10 | TCA cycle |
| 5.2 | 0.84 | 7 | Cell adhesion |
| 5.0 | 0.81 | 34 | Ribosomal |
| 4.8 | 0.74 | 7 | Vesicle transport—coatomer |
| 4.8 | 0.58 | 12 | |
| 4.1 | 0.92 | 9 | Muscle |
| 4.1 | 0.70 | 13 | |
| 3.9 | 0.72 | 7 | |
| 3.7 | 0.89 | 22 | Strict maternal |
| 3.7 | 0.85 | 7 | Photoreceptor |
| 2.9 | 0.82 | 10 | |
| 2.7 | 0.29 | 12 | |
| 2.7 | 0.33 | 12 | |
| 2.7 | 0.68 | 12 |
Functional clusters obtained after using NDPG to define boundaries on a hierarchical clustering of a fly development time series are listed here. Here we list the top 20 clusters sorted by NDPG score. Listed also are the number of genes in the cluster, the tightness of the cluster and whether or not a similar or identical cluster was reported in the original publication of the data. We listed an appropriate cluster function if it was immediately apparent. Clusters are depicted in greater detail in the Supplementary Material.
Figure 4.
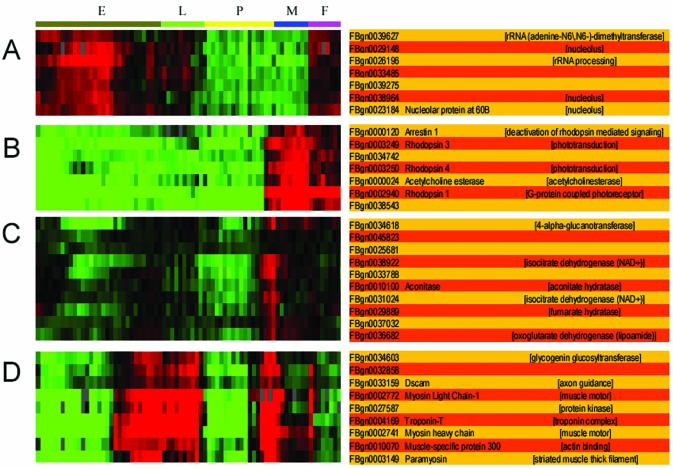
Four examples of gene expression clusters from a fly development time course whose boundaries were defined with scientific literature. The gene expression conditions are annotated at the top with E (embryo), L (larvae), P (pupae), M (adult male) and F (adult female). On the right, genes are listed by FlyBase ID and name if available. On the far right, we have listed the appropriate GO code annotation for that gene if available. (A) Nucleolar maternal genes. This cluster had not been identified in the original publication. (B) Photoreceptor genes. We found two separate photoreceptor clusters, as did the authors of the original publication. (C) Citric acid cycle genes. Most of these genes have not yet been studied. Using sequence homology to obtain additional references made it feasible to identify this cluster of genes. A related but broader cluster was identified in the original publication. (D) Muscle-specific genes. A similar but broader cluster was identified in the original publication containing more unknown genes.
One novel cluster not previously noted represents uncharacterized maternally expressed genes that localize primarily to the nucleolus; this functional cluster was not identified in the original publication and has the highest NDPG score of the selected nodes (Fig. 4A). The maternal expression of these genes is apparent from the expression profile: transcripts are seen in the female adult, but not the male adult, and in the embryo. These genes probably constitute an interesting biological module of developmentally regulated fly genes. Only two genes in the cluster are well studied, each with five primary papers listed in FlyBase. It has already been demonstrated that these two genes, the Fbgn0029196 (Nop5) and FBgn0023184 (Nop60B) genes, are in fact maternally expressed genes that localize to the nucleolus (25,26). The FBgn0038964 (Nop56) gene has only a single primary document that indicates that it is a nucleolar gene (27). The Fbgn0029148 (NHP2) and Fbgn0039627 genes have no primary papers but do have GO annotations. The Fbgn0029148 gene has been assigned the nucleolus GO code by FlyBase, citing a non-traceable author statement as evidence; the Fbgn0039627 gene has been assigned the rRNA modification GO codes by FlyBase by sequence similarity. Two genes, Fbgn0033485 (CG1381) and FBgn0039275 (CG33095), are uncharacterized genes without any primary literature or GO annotations.
Proper resolution for approximately half of the labeled functional clusters, including the nucleolar maternal cluster in Figure 4A, required the use of the augmented reference index, as the published primary literature on the fly genes was sparse.
Understanding uncharacterized genes
One of the primary goals of gene expression analysis is to attribute functions to unidentified genes and identify novel functions based on gene co-expression. If a gene with unknown function is in a functionally coherent cluster, it probably shares the common function of the other genes in the cluster. Experimental follow-up is necessary to confirm the putative gene function. In addition, detailed examination of unstudied genes just outside the cluster may be fruitful since they may also share the cluster function.
For example, Figure 4D appears to be a cluster of muscle genes. Some of the genes, have not been specifically annotated as muscle-expressed genes, but are likely candidates. Glycogenin, Fbgn0034603, was recently confirmed to be a muscle-specific gene by in situ hybridization (4). In addition, other putative muscle genes were confirmed that were just outside this cluster. Similarly, the cluster depicted in Figure 4A consists of genes that are maternally expressed that localize to the nucleolus; it contains two completely uncharacterized genes. The Fbgn0033485 (CG1381) and FBgn0039275 (CG33095) genes may share function with the other genes in the cluster. Experimental follow-up looking for genetic interactions or immunolocalization studies could confirm the function of these genes. In addition, the Fbgn0029148 and Fbgn0039627 genes have GO annotations based on poor evidence that already supports the possibility that they are nucleolar maternal genes; experimental validation could confirm this possibility.
Assessing the functional coherence of groups of genes
When we evaluated NDPG, it was 96% sensitive in yeast and 82% sensitive in fly at discriminating between functional groups of genes and random groups of genes at 99.9% specificity (20). We also found that one of the limitations of this (and probably any) literature-based approach is that certain biological functions have not been studied and reported on in the literature in certain organisms. For example, cellular and metabolic functions of many genes are better characterized in yeast than in fly or mouse. So, in many cases, transferring references from well-studied homologous genes from other model organisms as we have done here may be necessary to obtain a complete analysis. Additionally, the score of a group is also related to how extensively the function that it embodies is described in the literature.
Since abstracts have limited information, we believe there is the potential to further increase performance by including whole text of scientific articles and citation information.
Once the functionally related groups of genes are partitioned based on our method, the next challenge is to discern the common function represented by the group. Some groups have proposed algorithms that can identify keywords for groups of genes automatically that describe the function of the group from text about the genes (28–30). Since NDPG scores articles for relevance to the unifying biological function of the group, we could enhance the performance of these approaches by only including the most relevant articles.
The cluster boundary definition method proposed here would be effective with an alternative scoring of functional coherence that relied on scientific text or other knowledge-based resources, such as gene ontology annotations. The preferred criteria for a scoring system are (i) that the groups of genes containing all genes with a shared function should receive a higher score than random groups; (ii) combination of two unrelated coherent groups should result in a lower score; (iii) the score should increase steadily as a greater proportion of genes in a group share function; and (iv) large coherent groups should not score consistently higher or lower than small functionally coherent groups.
Hierarchical clustering
Hierarchical clustering can be implemented in multiple different ways (such as average linkage, centered linkage, etc.) with one of a wide array of metrics (such as euclidean, manhattan, jack-knife, etc.). In this study, we did not wish to explicitly evaluate the choice of hierarchical clustering implementation. We attempted to use methodology that was as consistent as possible with the original publication so that our results were comparable. However, maximization of NDPG weighted average to select cluster boundaries could be used in evaluating the output of different implementations of hierarchical clustering and selection of the best one. The better implementation will produce hierarchical trees that are more easily segmented into clusters that respect biological function. Such hierarchical trees will have higher total maximized NDPG weighted average than trees produced by an implementation less effective for the specific data set.
Objective cluster boundary definition
The most labor-intensive component of gene expression array projects is the identification of biologically relevant clusters and optimization of cluster boundaries. This task is difficult and often arbitrary, requiring laborious steps of gathering information on genes within a cluster, identifying a common biological process, and drawing a boundary line somewhere around a cluster. This method not only automates the identification of biologically relevant data using the same source literature that researchers would access to make the same comparisons by hand, but it also creates an optimized version of each cluster, at the level of highest enrichment for a given biological function. Not only has this method almost completely recapitulated the biologically relevant associations found through months of hands-on, one-gene-at-a-time work by teams of scientists working in both yeast and fly, but it has also been able to identify new clusters that were missed by the primary researchers. Furthermore, this method was able to accomplish this task in the order of hours. This approach will give researchers the capability to simplify significantly the amount of data analysis required to begin to make meaning from the mountain of experimental data.
SUPPLEMENTARY MATERIAL
Supplementary Material is available at NAR Online.
Acknowledgments
ACKNOWLEDGEMENTS
The authors thank SGD, Flybase and MGD for access to their literature resources. R.B.A. is supported by NIH 3-U01-GM-61374; SR is supported by NIH GM-07365.
REFERENCES
- 1.Alizadeh A.A., Eisen,M.B., Davis,R.E., Ma,C., Lossos,I.S., Rosenwald,A., Boldrick,J.C., Sabet,H., Tran,T. and Yu,X. (2000) Distinct types of diffuse large B-cell lymphoma identified by gene expression profiling. Nature, 403, 503–511. [DOI] [PubMed] [Google Scholar]
- 2.Bittner M., Meltzer,P., Chen,Y., Jiang,Y., Seftor,E., Hendrix,M., Radmacher,M., Simon,R., Yakhini,Z., Ben-Dor,A. et al. (2000) Molecular classification of cutaneous malignant melanoma by gene expression profiling. Nature, 406, 536–540. [DOI] [PubMed] [Google Scholar]
- 3.Golub T.R., Slonim,D.K., Tamayo,P., Huard,C., Gaasenbeek,M., Mesirov,J.P., Coller,H., Loh,M.L., Downing,J.R., Caligiuri,M.A. et al. (1999) Molecular classification of cancer: class discovery and class prediction by gene expression monitoring. Science, 286, 531–537. [DOI] [PubMed] [Google Scholar]
- 4.Arbeitman M.N., Furlong,E.E., Imam,F., Johnson,E., Null,B.H., Baker,B.S., Krasnow,M.A., Scott,M.P., Davis,R.W. and White,K.P. (2002) Gene expression during the life cycle of Drosophila melanogaster. Science, 297, 2270–2275. [DOI] [PubMed] [Google Scholar]
- 5.Zou S., Meadows,S., Sharp,L., Jan,L.Y. and Jan,Y.N. (2000) Genome-wide study of aging and oxidative stress response in Drosophila melanogaster. Proc. Natl Acad. Sci. USA, 97, 13726–13731. [DOI] [PMC free article] [PubMed] [Google Scholar]
- 6.Hughes T.R., Marton,M.J., Jones,A.R., Roberts,C.J., Stoughton,R., Armour,C.D., Bennett,H.A., Coffey,E., Dai,H., He,Y.D. et al. (2000) Functional discovery via a compendium of expression profiles. Cell, 102, 109–126. [DOI] [PubMed] [Google Scholar]
- 7.Roberts C.J., Nelson,B., Marton,M.J., Stoughton,R., Meyer,M.R., Bennett,H.A., He,Y.D., Dai,H., Walker,W.L., Hughes,T.R. et al. (2000) Signaling and circuitry of multiple MAPK pathways revealed by a matrix of global gene expression profiles. Science, 287, 873–880. [DOI] [PubMed] [Google Scholar]
- 8.Altman R.B. and Raychaudhuri,S. (2001) Whole-genome expression analysis: challenges beyond clustering. Curr. Opin. Struct. Biol., 11, 340–347. [DOI] [PubMed] [Google Scholar]
- 9.Sherlock G. (2000) Analysis of large-scale gene expression data. Curr. Opin. Immunol., 12, 201–205. [DOI] [PubMed] [Google Scholar]
- 10.Eisen M.B., Spellman,P.T., Brown,P.O. and Botstein,D. (1998) Cluster analysis and display of genome-wide expression patterns. Proc. Natl Acad. Sci. USA, 95, 14863–14868. [DOI] [PMC free article] [PubMed] [Google Scholar]
- 11.Yandell M. and Majoros,W. (2002) Genomics and natural language processing. Nature Rev. Genet., 3, 601–610. [DOI] [PubMed] [Google Scholar]
- 12.Raychaudhuri S., Chang,J.T., Sutphin,P.D. and Altman,R.B. (2002) Associating genes with gene ontology codes using a maximum entropy analysis of biomedical literature. Genome Res., 12, 203–214. [DOI] [PMC free article] [PubMed] [Google Scholar]
- 13.Tamames J., Ouzounis,C., Casari,G., Sander,C. and Valencia,A. (1998) EUCLID: automatic classification of proteins in functional classes by their database annotations. Bioinformatics, 14, 542–543. [DOI] [PubMed] [Google Scholar]
- 14.Eisenhaber F. and Bork,P. (1999) Evaluation of human-readable annotation in biomolecular sequence databases with biological rule libraries. Bioinformatics, 15, 528–535. [DOI] [PubMed] [Google Scholar]
- 15.Fleischmann W., Moller,S., Gateau,A. and Apweiler,R. (1999) A novel method for automatic functional annotation of proteins. Bioinformatics, 15, 228–233. [DOI] [PubMed] [Google Scholar]
- 16.Chaussabel D. and Sher,A. (2002) Mining microarray expression data by literature profiling. Genome Biol., 3, Research0055.1–0055.16. [DOI] [PMC free article] [PubMed] [Google Scholar]
- 17.Jenssen T.K., Laegreid,A., Komorowski,J. and Hovig,E. (2001) A literature network of human genes for high-throughput analysis of gene expression. Nature Genet., 28, 21–28. [DOI] [PubMed] [Google Scholar]
- 18.Horimoto K. and Toh,H. (2001) Statistical estimation of cluster boundaries in gene expression profile data. Bioinformatics, 17, 1143–1151. [DOI] [PubMed] [Google Scholar]
- 19.Raychaudhuri S., Schütze,H.S. and Altman,R.B. (2003) Inclusion of textual documentation in the analysis of multidimensional data sets: application to gene expression data. Machine Learn., 52, 119–145. [Google Scholar]
- 20.Raychaudhuri S. and Altman,R.B. (2003) A literature-based method for assessing the functional coherence of a gene group. Bioinformatics, 19, 396–401. [DOI] [PMC free article] [PubMed] [Google Scholar]
- 21.Raychaudhuri S., Schütze,H.S. and Altman,R.B. (2002) Text analysis of scientific literature can automatically determine if a group of genes share a common biological function. Genome Res., 12, 1582–1590. [DOI] [PMC free article] [PubMed] [Google Scholar]
- 22.Ashburner M., Ball,C.A., Blake,J.A., Botstein,D., Butler,H., Cherry,J.M., Davis,A.P., Dolinski,K., Dwight,S.S., Eppig,J.T. et al. (2000) Gene ontology: tool for the unification of biology. The Gene Ontology Consortium. Nature Genet., 25, 25–29. [DOI] [PMC free article] [PubMed] [Google Scholar]
- 23.Cherry J.M., Adler,C., Ball,C., Chervitz,S.A., Dwight,S.S., Hester,E.T., Jia,Y., Juvik,G., Roe,T., Schroeder,M. et al. (1998) SGD: Saccharomyces Genome Database. Nucleic Acids Res., 26, 73–79. [DOI] [PMC free article] [PubMed] [Google Scholar]
- 24.Gelbart W.M., Crosby,M., Matthews,B., Rindone,W.P., Chillemi,J., Russo Twombly,S., Emmert,D., Ashburner,M., Drysdale,R.A., Whitfield,E. et al. (1997) FlyBase: a Drosophila database. The FlyBase consortium. Nucleic Acids Res., 25, 63–66. [DOI] [PMC free article] [PubMed] [Google Scholar]
- 25.Vorbruggen G., Onel,S. and Jackle,H. (2000) Restricted expression and subnuclear localization of the Drosophila gene Dnop5, a member of the Nop/Sik family of the conserved rRNA processing factors. Mech. Dev., 90, 305–308. [DOI] [PubMed] [Google Scholar]
- 26.Phillips B., Billin,A.N., Cadwell,C., Buchholz,R., Erickson,C., Merriam,J.R., Carbon,J. and Poole,S.J. (1998) The Nop60B gene of Drosophila encodes an essential nucleolar protein that functions in yeast. Mol. Gen. Genet., 260, 20–29. [DOI] [PubMed] [Google Scholar]
- 27.Garcia-Planells J., Paricio,N., Palau,F. and de Frutos,R. (2000) Dnop56, a Drosophila gene homologous to the yeast nucleolar NOP56 gene. Genetica, 109, 275–282. [DOI] [PubMed] [Google Scholar]
- 28.Andrade M.A. and Valencia,A. (1997) Automatic annotation for biological sequences by extraction of keywords from MEDLINE abstracts. Development of a prototype system. Proc. Int. Conf. Intell. Syst. Mol. Biol., 5, 25–32. [PubMed] [Google Scholar]
- 29.Iliopoulos I., Enright,A.J. and Ouzounis,C.A. (2001) Textquest: document clustering of Medline abstracts for concept discovery in molecular biology. Pac. Symp. Biocomput., 90, 384–395. [DOI] [PubMed] [Google Scholar]
- 30.Shatkay H., Edwards,S., Wilbur,W.J. and Boguski,M. (2000) Genes, themes and microarrays: using information retrieval for large-scale gene analysis. Proc. Int. Conf. Intell. Syst. Mol. Biol., 8, 317–328. [PubMed] [Google Scholar]
Associated Data
This section collects any data citations, data availability statements, or supplementary materials included in this article.


