Abstract
Small molecules that intercalate in DNA and RNA are powerful agents for controlling nucleic acid structural transitions. We recently demonstrated that coralyne, a small crescent-shaped molecule, can cause the complete and irreversible disproportionation of duplex poly(dA)·poly(dT) into triplex poly(dA)·poly(dT)·poly(dT) and a poly(dA) self- structure. Both DNA secondary structures that result from duplex disproportionation are stabilized by coralyne intercalation. In the present study, we show that the kinetics and thermodynamics of coralyne-driven duplex disproportionation strongly depend on oligonucleotide length. For example, disproportionation of duplex (dA)16·(dT)16 by coralyne reverts over the course of hours if the sample is maintained at 4°C. Coralyne-disproportioned (dA)32· (dT)32, on the other hand, only partially reverts to the duplex state over the course of days at the same temperature. Furthermore, the equilibrium state of a (dA)16·(dT)16 sample in the presence of coralyne at room temperature contains three different secondary structures [i.e. duplex, triplex and the (dA)16 self-structure]. Even the well-studied process of triplex stabilization by coralyne binding is found to be a length-dependent phenomenon and more complicated than previously appreciated. Together these observations indicate that at least one secondary structure in our nucleic acid system [i.e. duplex, triplex or (dA)n self-structure] binds coralyne in a length-dependent manner.
INTRODUCTION
For many years, small molecules that bind duplex DNA were primarily studied with the goal of understanding their activity in either the cause or treatment of cancer (1–5). Within the last decade, the proposed applications for small molecule–DNA interactions have increased substantially. For example, small molecules have now been developed that bind sequence specifically in the minor groove of duplex DNA and function as artificial gene regulation elements (6,7). In addition to duplex DNA, a number of laboratories have also worked towards the development of small molecules that specifically bind and stabilize triplex and G-quadruplex DNA (8–10). The use of such molecules in vivo to facilitate the formation of non-duplex DNA structures has principally been pursued as a possible route to antigene therapy. The recent demonstration that a cationic porphyrin derivative can suppress gene expression by promoting the formation of a G-quadruplex in living cells clearly illustrates the potential for this approach in the development of new therapeutics (10).
Our laboratory is also interested in the use of small molecules as a general means to drive nucleic acid assembly and structural transitions. Part of our motivation in this pursuit comes from our recent proposal that small molecule intercalation may have played a central role in early life (i.e. the RNA world) by facilitating nucleic acid assembly and replication (11). In the same way, small molecule intercalation may provide a route to protein-free template-directed synthesis of nucleic acids (11). Towards this end, we have initiated studies of how small molecule binding to nucleic acids by intercalation can drive the assembly of multi-stranded DNA and RNA structures.
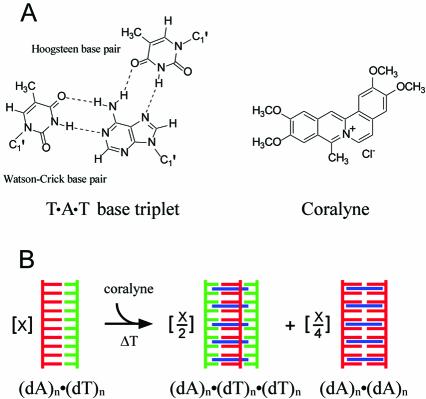
Coralyne (Scheme 1) is a small crescent-shaped molecule that is among a group of molecules known to preferentially intercalate DNA triplexes over duplexes and to increase the thermal stability of triplex DNA (12–16). Previously, we demonstrated that coralyne can also drive the complete and irreversible disproportionation of duplex poly(dA)·poly(dT) (17), i.e. coralyne causes the repartitioning of duplex poly(dA)·poly(dT) into coralyne-intercalated triplex poly(dA)·poly(dT)·poly(dT) and poly(dA) (Scheme 1). We also discovered that poly(dA) forms a self-structure in the presence of coralyne that is stable up to at least 47°C. Data from several experimental techniques indicate that this poly(dA) self-structure is a duplex with A·A base pairs that is intercalated up to a level of one coralyne molecule per 2 bp (17). This serendipitous discovery provides an excellent illustration of how small molecule intercalation can be used to drive nucleic acid assembly, because poly(dA) does not form a stable multi-stranded self-structure at neutral pH in the absence of coralyne.
Scheme 1. (A) Structural representations of the T·A·T base triplet and coralyne chloride. (B) Schematic representation of the disproportionation of a (dA)n·(dT)n duplex into coralyne-intercalated triplex (dA)n·(dT)n·(dT)n and the (dA)n self-structure.
In the present work, we report how DNA strand length can affect the ability of coralyne binding to control DNA secondary structure. Coralyne is shown to cause the complete disproportionation of duplex (dA)16·(dT)16 at 36°C, as we previously demonstrated for duplex poly(dA)·poly(dT). However, our studies of duplex (dA)16·(dT)16 have revealed that duplex disproportionation by coralyne is not strictly irreversible. Over the course of hours at 4°C, a disproportioned (dA)16·(dT)16 sample reverts back to the duplex state from the coralyne-intercalated triplex and (dA)16 self-structure. Furthermore, at room temperature a disproportioned duplex (dA)16·(dT)16 sample requires days to reach equilibrium, and the equilibrium state contains a mixture of duplex, triplex and (dA)16 self-structure. Coralyne-disproportioned samples of duplex (dA)32·(dT)32 and duplex poly(dA)·poly(dT) were found to require several weeks to reach structural equilibrium. We also show that even the kinetics of triplex stabilization by coralyne depend on oligonucleotide length. The results reported here illustrate the potential for small molecule binding to be used in concert with temperature to drive nucleic acid structural transitions.
MATERIALS AND METHODS
Materials
(dA)16, (dT)16, (dA)32 and (dT)32 oligonucleotides were purchased from Integrated DNA Technologies (Coralville, IA). Duplex poly(dA)·poly(dT) and poly(dA) nucleotides were purchased from Amersham Pharmacia Biotech (Piscataway, NJ). Poly(dT) (lot 16H10741) was purchased from Sigma (St Louis, MO). Length of polymers in duplex poly(dA)·poly(dT) and single-stranded poly(dT) were >500 nt and poly(dA) was ∼310 nt in length. DNA lengths were confirmed by denaturing polyacrylamide gel electrophoresis. Coralyne chloride (lot 106C0362) was purchased from Sigma. Polynucleotides and coralyne were used without further purification.
Sample preparation
Oligonucleotides (16mers and 32mers) were purified on a 1 m G-25 Sephadex column. Fractions containing the purified oligonucleotides were pooled, lyophilized and the DNA was resuspended in dH2O. Concentrations of oligonucleotides were determined by UV-Vis spectroscopy using the following extinction coefficients (16): poly(dA)·poly(dT), ε260 = 12 000 M–1 cm–1 per base pair; (dT)16, (dT)32, and poly(dT), ε264 = 8520 M–1 cm–1 per base; (dA)16, (dA)32, and poly(dA), ε257 = 8600 M–1 cm–1 per base; coralyne chloride, ε420 = 14 500 M–1 cm–1. All DNA samples were 55 µM in base, base pair or base triplet, 115 mM NaCl, 13 mM sodium cacodylic buffer, pH 6.8 (unless otherwise stated). Coralyne chloride concentrations are given in figure captions.
Data collection
Circular dichroism (CD) spectra were acquired on a JASCO J-720 CD spectropolarimeter equipped with an RTE-111 temperature control unit. Spectra were acquired using a 10 mm path length cell. CD melting profiles were acquired by increasing the sample temperature at a rate of 0.8°C min–1 from 3 to 75°C. UV-Vis absorbance measurements were performed using a HP 8453 UV-Vis diode array spectrophotometer with an Agilent 89090A Peltier temperature control unit.
RESULTS AND DISCUSSION
Complete triplex formation and coralyne intercalation by (dA)16·(dT)16 + (dT)16 is inhibited by a kinetic trap at 4°C
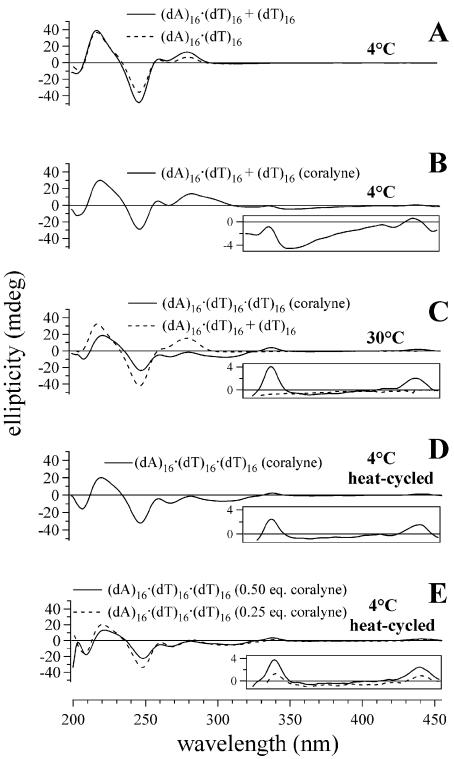
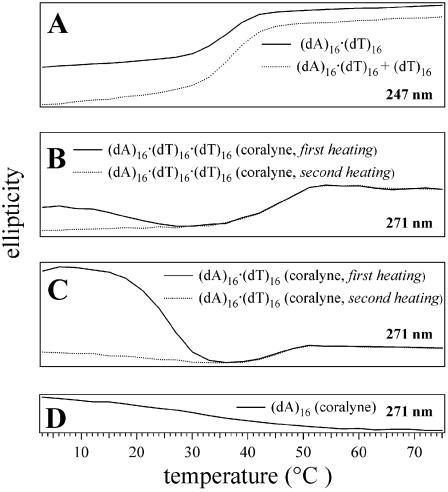
The pyrimidine triplex (dA)16·(dT)16·(dT)16 is not stable under the solution conditions of our study, even at 4°C. This is illustrated by the fact that a sample with a 1:2 molar ratio of (dA)16 and (dT)16 exhibits a CD spectrum that is virtually identical to that of the (dA)16·(dT)16 duplex in a sample containing a 1:1 molar ratio of (dA)16 and (dT)16 (Fig. 1A). Additionally, the CD melting profiles of these two samples exhibit the same single melting transition (i.e. Tm2→1) at 37°C (Fig. 2A). Thus, the only secondary structure present in the sample with a 1:2 molar ratio of (dA)16 and (dT)16 is the duplex (dA)16·(dT)16, which coexists with an equal molar equivalent of single-stranded (dT)16. We will refer to a sample in this state as ‘(dA)16·(dT)16 + (dT)16’, as opposed to (dA)16·(dT)16·(dT)16, to emphasize that in this sample the triplex secondary structure is either absent or in equilibrium with an appreciable amount of duplex and single-stranded (dT)16. The absence of triplex secondary structure in the (dA)16·(dT)16 + (dT)16 sample is somewhat particular to the conditions of our study, as the addition of divalent cations can facilitate triplex formation by oligonucleotides of this length and sequence at 4°C (18). However, in order to be consistent with our past studies (17), and given our specific aim to explore nucleic acid stabilization by intercalation, we have used solution conditions in which the triplex (dA)16·(dT)16·(dT)16 is unstable in the absence of coralyne intercalation.
Figure 1.
CD spectra of triplex and duplex 16mer DNA samples demonstrating that complete triplex (dA)16·(dT)16·(dT)16 formation requires heating of the DNA sample in the presence of coralyne. (A) Spectra of duplex (dA)16·(dT)16 and (dA)16·(dT)16 + (dT)16 (unstable triplex) samples at 4°C. (B) Spectrum of (dA)16·(dT)16 + (dT)16 in the presence of coralyne at 4°C. (C) Spectrum of (dA)16·(dT)16 + (dT)16 at 30°C without coralyne and triplex (dA)16·(dT)16·(dT)16 spectrum with coralyne at 30°C. (D) CD spectrum acquired at 4°C of (dA)16·(dT)16·(dT)16 after being heated to 75°C with coralyne. (E) Spectra of triplex (dA)16·(dT)16·(dT)16 at 4°C after heat cycling with 0.25 and 0.5 molar equivalents of coralyne, respectively. DNA concentrations were 55 µM base pair or base triplet, respectively. Coralyne concentration, in samples containing coralyne, was 0.25 molar equivalents per base pair or base triplet, respectively, except as stated in (E).
Figure 2.
CD melting profiles for 16mer DNA samples at wavelengths selected to show structural transitions. (A) Duplex (dA)16·(dT)16 and (dA)16·(dT)16 + (dT)16 melting curves exhibit a transition (Tm2→1) at 37°C. (B) First and second heating of a triplex (dA)16·(dT)16·(dT)16 sample after the addition of coralyne indicates triplex melting (Tm3→1) at 46°C. The first heating of this sample after the addition of coralyne also shows a transition centered at ∼15°C, which is assigned to the reorganization of DNA strands from partial duplex and partial triplex to complete triplex. (C) First and second heating of duplex (dA)16·(dT)16 after the addition of coralyne; the duplex disproportionation transition is observed at ∼23°C during the first heating and triplex melting (Tm3→1) is observed at 46°C in both the first and second heating of the sample. (D) (dA)16 with coralyne exhibits the melting transition of the (dA)16 self-structure at ∼25°C. The vertical ellipticity scale is the same for all samples. DNA concentrations were 55 µM nucleotide, base pair or base triplet, respectively. Coralyne concentration, in samples containing coralyne, was 0.25 molar equivalents per nucleotide, base pair or base triplet, respectively.
Coralyne has previously been shown to intercalate triplex DNA and thereby enhance the thermal stability of the triplex secondary structure (19). The addition of coralyne to a (dA)16·(dT)16 + (dT)16 sample at 4°C results in an appreciable change in the sample CD spectrum (Fig. 1B). However, complete triplex formation and coralyne intercalation does not appear to occur upon coralyne addition, as the coralyne-intercalated triplex produces small positive CD bands at ∼340 and ∼440 nm (17). Local maxima are observed at these wavelengths, but appear to ride atop a broad negative band that has a minimum at 350 nm (Fig. 1B, inset). The persistence of duplex secondary structure in this sample is supported by the observation of similar (but more intense) negative CD bands at ∼350 nm for a sample of duplex (dA)16·(dT)16 with coralyne at the same temperature (vide infra). This indicates that coralyne does not cause the complete and spontaneous formation of a triplex in this sample when it is maintained at 4°C, which is surprising given the fact that coralyne is well known to greatly increase the melting temperature of A·T·T triplexes (12).
Heating the (dA)16·(dT)16 + (dT)16 sample with added coralyne to 30°C causes the CD spectrum of this sample to adopt spectral features that are typical of a DNA triplex with intercalated coralyne, including the appearance of small positive CD bands at ∼340 and ∼440 nm (Fig. 1C, inset). The CD spectrum of the (dA)16·(dT)16 + (dT)16 sample at 30°C without coralyne, on the other hand, remains similar to that of duplex (dA)16·(dT)16 (Fig. 1A and C). Thus, heating of the (dA)16·(dT)16 + (dT)16 sample with coralyne to 30°C actually promotes the formation of triplex (dA)16·(dT)16·(dT)16. The CD heating profile for triplex (dA)16·(dT)16·(dT)16 with added coralyne reveals that the intercalated triplex melts at 46°C into single strands in a single transition (Tm3→1) (Fig. 2B). The CD spectrum of triplex (dA)16·(dT)16·(dT)16 with coralyne at 4°C after being heat cycled above 30°C is significantly different from the CD spectrum of the same sample at 4°C prior to being heated (Fig. 1B and D). This demonstrates that the transition to a sample of complete coralyne-intercalated triplex is not reversed upon cooling. This is also illustrated by the fact that the CD melting profile for the first heating of the (dA)16·(dT)16 + (dT)16 sample with coralyne has a transition at ∼15°C, assigned to DNA strand reorganization, that is absent during the second heating of the sample (Fig. 2B).
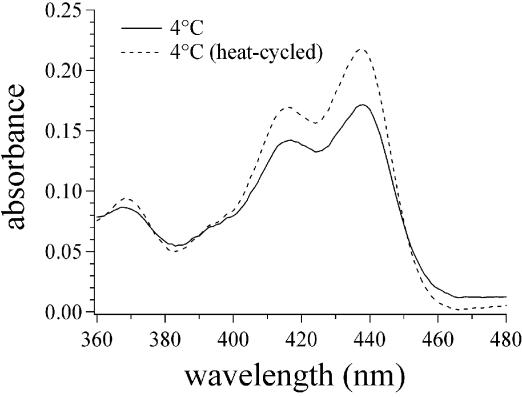
UV-Vis spectrophotometry provides additional evidence that heat cycling of the (dA)16·(dT)16 + (dT)16 sample changes the nature of coralyne–DNA interactions (Fig. 3). Local maxima at ∼420 and ∼440 nm appear in the absorption spectrum of coralyne upon binding to DNA (13). A comparison of the 360–480 nm region from the absorption spectrum of coralyne in a sample of (dA)16·(dT)16 + (dT)16 before and after heat cycling reveals that the intensity of the coralyne band at 440 nm at 4°C has increased relative to the 420 nm absorption band (Fig. 3). This is consistent with increased coralyne intercalation by the (dA)16·(dT)16·(dT)16 triplex after heating (13).
Figure 3.
The 360–480 nm region of the UV-Vis absorption spectra of coralyne in the presence of triplex (dA)16·(dT)16·(dT)16. Spectra at 4°C before and after heating illustrate the change in binding of coralyne to the 16mer triplex that is promoted by heat cycling above 36°C. DNA concentration was 142 µM base triplet. Coralyne concentration was 0.25 molar equivalents per base triplet.
The coralyne-intercalated (heat cycled) triplex (dA)16· (dT)16·(dT)16 samples discussed thus far were intercalated only to a level of one coralyne per four base triplets, i.e. 0.25 equivalents of coralyne per base triplet. Coralyne was initially added to a (dA)16·(dT)16 + (dT)16 sample to a concentration that corresponded to 0.50 molar equivalents of coralyne per (potential) base triplet (i.e. a coralyne concentration of 27.5 µM). This concentration of coralyne would allow intercalation of the triplex to the level of one coralyne per every other base triplet, the maximum level allowed under the nearest neighbor exclusion principle. However, the addition of coralyne to this concentration in a (dA)16·(dT)16 + (dT)16 sample at 4°C immediately resulted in clouding of the sample and subsequent precipitation of coralyne. It was found that coralyne could be added to 0.25 molar equivalents of coralyne per base triplet at 4°C without precipitation. Once this sample was heat cycled up to 75°C and back to 4°C, the coralyne concentration could be increased to 0.5 molecules per base triplet without sample clouding or coralyne precipitation. Heat cycling of the sample with the full 0.5 molar equivalents of coralyne then resulted in an increase in coralyne intercalation, based upon the intensity of CD bands at ∼340 and ∼440 nm that approximately doubled in comparison with the sample that contained only 0.25 molar equivalents of coralyne (Fig. 1E, inset). Thus, it appears that upon heating, coralyne causes a rearrangement of the DNA strands in such a manner (i.e. complete triplex formation) that additional sites for coralyne intercalation are provided.
The ability of small molecule intercalation to stabilize triplex structures has traditionally been demonstrated by measuring a shift in the Tm of a triplex in the presence of the small molecule (20). However, the data presented here illustrate that if a triplex is not stable at the temperature at which the small molecule is added to the solution, heating may be required to facilitate complete triplex formation and intercalation. This would likely have gone unnoticed in past studies, where only sample absorption at 260 nm was monitored as a function of temperature. Nevertheless, our results indicate that the ability of a small molecule to stabilize a triplex could depend upon the initial state of the sample, as the duplex structure or small molecule self-association can apparently act as a kinetic barrier to triplex formation. This may have significant implications regarding the proposed use of intercalators to stabilize triplex structures under conditions where the triplex is not stable in the absence of intercalation.
Coralyne causes the complete disproportionation of duplex (dA)16·(dT)16 at 30°C
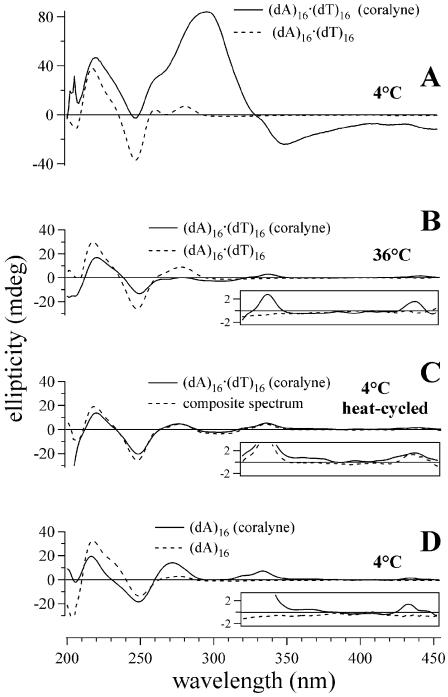
The CD spectrum of duplex (dA)16·(dT)16 at 4°C changes dramatically upon the addition of 0.25 molar equivalents of coralyne per DNA base pair (Fig. 4A). These changes include the appearance of a substantial positive CD band (or bands) near 300 nm and negative CD bands near 350 nm. Similar CD bands are also observed upon the addition of coralyne to a (dA)16·(dT)16 + (dT)16 sample at 4°C (Fig. 1B). However, these CD bands are much more pronounced in the duplex (dA)16·(dT)16 sample (Fig. 4A).
Figure 4.
CD spectra of duplex (dA)16·(dT)16 samples that illustrate duplex disproportionation. (A) Duplex (dA)16·(dT)16 sample with and without added coralyne at 4°C prior to heating. (B) Spectra of duplex (dA)16·(dT)16 samples with and without coralyne at 36°C. (C) Heat-cycled spectrum of disproportioned (dA)16·(dT)16 sample in the presence of coralyne at 4°C and composite spectrum {sum of spectra acquired at 4°C: [0.50 × triplex (dA)16·(dT)16·(dT)16 with 0.25 molar equivalents of coralyne] + [0.50 × single stranded (dA)16 with 0.25 molar equivalents of coralyne]}. (D) Spectra of (dA)16 sample with and without coralyne at 4°C. DNA concentrations were 55 µM nucleotide or base pair, respectively. Coralyne concentration was 0.25 molar equivalents per nucleotide or base pair, respectively.
Several experimental observations indicate that upon heating, duplex (dA)16·(dT)16 in the presence of coralyne undergoes disproportionation into 0.50 molar equivalents of triplex (dA)16·(dT)16·(dT)16 and 0.50 molar equivalents of (dA)16. These observations include: heating of the (dA)16·(dT)16 sample with added coralyne to 36°C dramatically reduces the magnitude of the duplex-specific coralyne CD bands at 300 and 350 nm (Fig. 4B); the shapes of the DNA bands between 200 and 260 nm change with heating to more closely resemble those of a DNA triplex (Fig. 4B); the CD spectrum of the (dA)16·(dT)16 sample with coralyne at 36°C shows small positive bands at ∼340 and ∼440 nm (Fig. 4B, inset), similar to CD bands observed for coralyne intercalated in the (dA)16·(dT)16·(dT)16 triplex (Fig. 1D, inset). Additionally, the melting profile of the (dA)16·(dT)16 sample with coralyne added exhibits a transition at 46°C (Fig. 2C), which is the same temperature at which the coralyne-intercalated triplex (dA)16·(dT)16·(dT)16 melts (Fig. 2B). The magnitude of this transition in the CD melting profile of the duplex sample with added coralyne is half the transition in the triplex sample with added coralyne (Fig. 2B and C), which is also consistent with the (dA)16·(dT)16 sample being disproportioned by coralyne into 0.5 molar equivalents of triplex (dA)16·(dT)16·(dT)16 and 0.5 molar equivalents of (dA)16. Thus, the 46°C transition in the (dA)16·(dT)16 sample with coralyne can be assigned to the melting of coralyne-intercalated triplex (dA)16·(dT)16·(dT)16 in the disproportioned sample.
The process of duplex disproportionation by coralyne in the (dA)16·(dT)16 sample during the first sample heating is indicated by a broad transition that is centered at ∼23°C (Fig. 2C). During the second heating of the same sample, this broad transition is absent (Fig. 2C). This indicates that the intercalated triplex and (dA)16 of a coralyne-disproportioned duplex sample do not immediately revert back to the duplex state when the sample is returned to 4°C. This lack of reversion from the disproportioned state is also supported by the fact that the CD spectrum of the coralyne-disproportioned (dA)16·(dT)16 at 4°C after heat cycling (from 4 to 75 and back to 4°C) is radically different from the CD spectrum of the sample prior to heating (Fig. 4A and C). Furthermore, there is an excellent match between the CD spectrum of coralyne-disproportioned (dA)16·(dT)16 sample and a composite CD spectrum generated by the summation of a CD spectrum of coralyne-intercalated triplex (dA)16·(dT)16·(dT)16 and the CD spectrum of (dA)16 in the presence of coralyne (Fig. 4C).
Our previous investigations revealed that poly(dA) adopts a self-structure with A·A base pairs that is completely dependent on coralyne intercalation for stability (17). Here we show that much shorter homo(dA) strands also form the (dA)n self-structure in the presence of coralyne. In Figure 4D, the CD spectra are presented for (dA)16 at 4°C in the presence and absence of coralyne. The addition of coralyne to the (dA)16 sample leads to the appearance of a significant CD band at ∼340 nm that indicates coralyne binding. The CD spectrum between 220 and 270 nm of (dA)16 in the presence of coralyne also differs significantly from (dA)16 in the absence of coralyne, indicating a significant change in the secondary structure of (dA)16 upon coralyne binding. The CD melting profile for (dA)16 with coralyne shows a relatively broad melting transition centered at ∼25°C (Fig. 2D).
Reversion of coralyne-induced (dA)16·(dT)16 disproportionation occurs at 4°C over the course of several hours
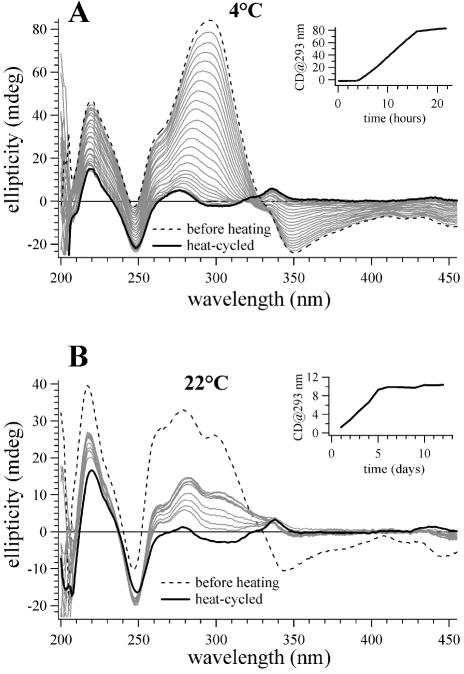
We have found that after heat cycling, the CD spectrum of coralyne-disproportioned (dA)16·(dT)16 changes over the course of hours if the sample is maintained at 4°C. In Figure 5, CD spectra are presented that illustrate this temporal change. For the particular experiment shown, 0.25 molar equivalents of coralyne were added to a (dA)16·(dT)16 sample at 4°C, the sample was then heated to 75°C and cooled back to 4°C. It is clear that over time the disproportioned duplex sample reverts back to the duplex state, as the CD spectrum after 20 h is virtually identical to the spectrum of the sample acquired at 4°C prior to heat cycling (Fig. 5A). CD spectra of the disproportioned sample acquired over the course of reversion at 4°C are well represented as the linear sum of the CD spectrum of the sample before heating (i.e. 100% duplex) and the CD spectrum immediately following heat cycling (i.e. 100% disproportioned). Thus, the reversion of the sample from the disproportioned state can be modeled as a two-state system. A plot of the magnitude of the CD signal at 293 nm as a function of time illustrates that duplex reversion is sigmoidal with time and is complete after ∼15 h (Fig. 5A, inset).
Figure 5.
CD spectra of a (dA)16·(dT)16 sample with coralyne that illustrate the approach of this sample to equilibrium at 4 and 22°C after being heat cycled to 75°C. (A) Spectra of the (dA)16·(dT)16 sample with coralyne at 4°C. The dashed line is the spectrum acquired immediately after the addition of coralyne at 4°C, before heat cycling. The solid black line is the spectrum acquired immediately after the sample was heated to 75°C and cooled back to 4°C. Spectra drawn in gray were acquired at selected time intervals after the sample was heat cycled. After heat cycling, the sample was constantly maintained at 4°C. (Inset) A plot of the CD signal at 293 nm as a function of time after sample heat cycling for the sample maintained at 4°C. (B) Spectra of the (dA)16·(dT)16 sample with coralyne at 22°C. The dashed line is the spectrum acquired immediately after the addition of coralyne at 22°C, before heat cycling. The solid black line is the spectrum acquired immediately after the sample was heated to 75°C and cooled back to 22°C. Spectra drawn in gray were acquired at selected time intervals after the sample was heat cycled. After heat cycling, the sample was constantly maintained at 22°C. (Inset) A plot of the best fit exponential function of the CD signal at 293 nm for the (dA)16·(dT)16 sample with coralyne at 22°C as a function of time after heat cycling. DNA concentration was 55 µM base pair. Coralyne concentration was 0.25 molar equivalents per base pair for both samples.
The fact that coralyne-disproportioned (dA)16·(dT)16 slowly reverts to the duplex state at 4°C indicates that duplex (dA)16·(dT)16 is the thermodynamically favored state at 4°C, with respect to the disproportioned duplex. This explains why a (dA)16·(dT)16 duplex sample does not spontaneously undergo disproportionation at 4°C when coralyne is added. Thus, the duplex at 4°C is not a kinetic barrier to disproportionation, which might be assumed because sample heating is required to initiate disproportionation. In contrast, reversion of a coralyne-disproportioned (dA)16·(dT)16 sample back to the duplex state at 4°C is apparently slow because the disproportioned state is a kinetic barrier to reversion at 4°C.
Three distinct DNA secondary structures coexist in equilibrium at 22°C
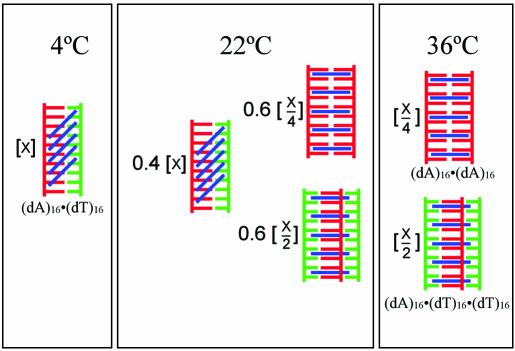
Our observation that the coralyne-disproportioned state of (dA)16·(dT)16 is thermodynamically favored at 30°C, whereas the duplex state is favored at 4°C, immediately suggested that for some range of temperature duplex (dA)16·(dT)16 and coralyne-disproportioned (dA)16·(dT)16 will coexist in equilibrium. To directly investigate this possibility, we studied the equilibrium state of a (dA)16·(dT)16 sample in the presence of coralyne at 22°C (room temperature). For this investigation, 0.25 molar equivalents of coralyne per base pair were added to a duplex (dA)16·(dT)16 sample at 22°C and the CD spectrum was acquired immediately (Fig. 5B). The sample was then heated to 75°C and cooled back to 4°C to ensure complete disproportionation (and consistency with other experiments). The disproportioned sample was then moved to room temperature and CD spectra were collected at 22°C on a regular basis. The CD spectrum of the sample changed with time, as illustrated by a graph of the CD signal at 293 nm, until achieving equilibrium after ∼5 days (Fig. 5B, inset). The CD spectrum of the sample at equilibrium is intermediate between the CD spectrum of the sample at 22°C before heating to disproportionation and the CD spectrum acquired at 22°C immediately after disproportionation. Based upon a least squares best fit of the equilibrium spectrum as a weighted sum of the spectra before and after disproportionation, it appears that the equilibrium state of the (dA)16·(dT)16 sample with coralyne at 22°C is 40% duplex and 60% disproportioned duplex [i.e. triplex and (dA)16 self-structure] (Scheme 2).
Scheme 2. Schematic representation of the equilibrium secondary structure distribution at three temperatures for a sample containing an equal ratio of (dA)16 and (dT)16 in the presence of 0.25 molar equivalents of coralyne per base pair. The possibility of an alternative mode of coralyne binding to the (dA)16·(dT)16 duplex is depicted by the blue diagonal lines.
Previous studies have shown that increasing the temperature of a (dA)n·(dT)n duplex sample with divalent cations or high monovalent cation concentration can cause duplex disproportionation in the absence of intercalation (21–23). However, without intercalation, duplex disproportionation is typically not complete before the sample reaches a temperature at which all secondary structures melt into single strands, and disproportionation can be readily reversed by a decrease in sample temperature (21–23). Our results indicate that coralyne intercalation is working synergistically with temperature to drive duplex disproportionation, for both intercalation and increased temperature (i.e. above ∼30°C) appear to be necessary for our duplex DNA samples to achieve complete disproportionation.
The equilibrium point and kinetics of reversion from the coralyne-disproportioned state at 4°C depend upon DNA strand length
We previously reported that coralyne causes the irreversible disproportionation of duplex poly(dA)·poly(dT) based upon our observation that the spectrum of a coralyne-disproportioned poly(dA)·poly(dT) sample was stable at 4°C for >1 day (17). We also observed that duplex poly(dA)·poly(dT) does not undergo disproportionation for a matter of months if coralyne is added at 4°C and the sample is continually maintained at 4°C. Combined, these observations lead us to conclude that duplex poly(dA)·poly(dT) does not spontaneously disproportion when coralyne is added at 4°C because the duplex structure (with associated coralyne) acts as a kinetic barrier to disproportionation and that heating above 30°C is necessary to overcome this barrier. However, the results presented above with (dA)16·(dT)16 suggest a different assignment of which DNA secondary structures in the presence of coralyne at 4°C are thermodynamically favored and which are kinetic traps.
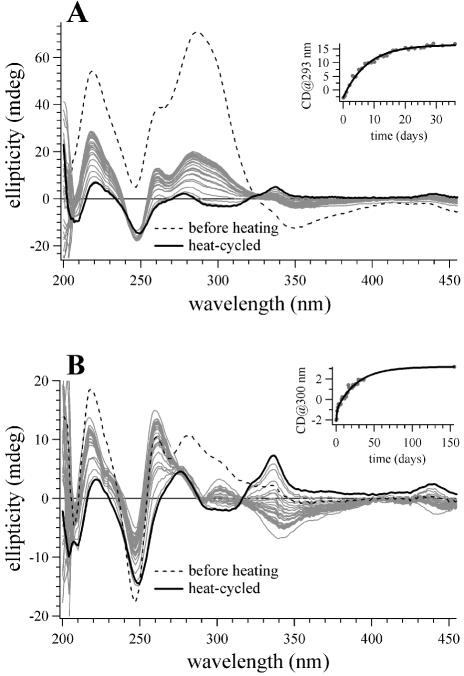
To examine the effect of DNA length on the propensity for a disproportioned sample to revert to the duplex state at 4°C, we repeated the same experiment described above for monitoring (dA)16·(dT)16 reversion, except with the 32mer duplex (dA)32·(dT)32. The CD spectra of coralyne-disproportioned (dA)32·(dT)32 also changes over time at 4°C (Fig. 6A). However, there are two significant differences between 32mer and 16mer duplex reversion. First, coralyne-disproportioned (dA)32·(dT)32 requires several days to reach equilibrium at 4°C, rather than several hours, with an exponential decay time constant of ∼7 days (Fig. 6A, inset). Secondly, the equilibrium state of the 32mer sample at 4°C is a partially disproportioned state, much like that reached by the 16mer sample at 22°C. Thus, doubling oligonucleotide length from 16 to 32 actually shifts the secondary structure equilibrium at 4°C towards the disproportioned state.
Figure 6.
CD spectra of (dA)32·(dT)32 and poly(dA)·poly(dT) samples with coralyne that illustrate the approach of these samples to equilibrium at 4°C after being heat cycled into the disproportioned state. (A) Spectra of the (dA)32·(dT)32 sample with coralyne at 4°C. The dashed line is the spectrum acquired immediately after the addition of coralyne at 4°C, before sample heat cycling. The solid black line is the spectrum acquired immediately after the sample was heated to 75°C and cooled back to 4°C. Spectra drawn in gray were acquired at selected time intervals after the sample was heat cycled. After heat cycling, the sample was constantly maintained at 4°C. (Inset) A plot of the best fit exponential function of the CD signal at 293 nm for the (dA)32·(dT)32 sample with coralyne at 4°C as a function of time after sample heat cycling. (B) Spectra of the poly(dA)·poly(dT) sample with coralyne at 4°C. The dashed line is the spectrum acquired immediately after the addition of coralyne at 4°C, before sample heat cycling. The solid black line is the spectrum acquired immediately after the sample was heated to 95°C and cooled back to 4°C. Spectra drawn in gray were acquired at selected time intervals after the sample was heat cycled. After heat cycling, the sample was constantly maintained at 4°C. (Inset) A plot of the best fit double exponential function of the CD signal at 300 for the poly(dA)· poly(dT) sample with coralyne at 4°C nm as a function of time after heat cycling. DNA concentration was 55 µM base pair. Coralyne concentration was 0.25 molar equivalents per base pair for both samples.
The reversion of a coralyne-disproportioned poly(dA)· poly(dT) sample at 4°C was investigated as well. In an experiment similar to those described above, 0.25 molar equivalents of coralyne were added to a poly(dA)·poly(dT) sample at 4°C. This sample was then heated to 95°C, which is above the melting temperature of the coralyne-intercalated poly(dA)·poly(dT)·poly(dT) triplex (i.e. 87°C), and then cooled back to 4°C. The disproportioned sample was maintained and monitored by CD at 4°C for several months (Fig. 6B). CD spectra indicate that the secondary structures within a coralyne-disproportioned poly(dA)·poly(dT) sample at 4°C do change over time, however, the equilibrium state of this sample is more difficult to interpret than that of the 16mer or the 32mer samples. The approach to equilibrium by the polynucleotide sample is best fitted by a double exponential, with a fast time constant of 1.4 days and a slow time constant of 28 days (Fig. 6B, inset). The equilibrium state that is finally reached by this sample does not appear to be intermediate between that of the same sample before and after heating (Fig. 6B). Thus, changing DNA length from 32 to ∼300 nt [i.e. poly(dA), poly(dT)] can change the secondary structures that are favored by a (dA)n·(dT)n sample in the presence of coralyne at 4°C.
In aqueous solution, coralyne may form a hydration product across the C=N bond that would destroy planarity and potentially inhibit intercalation of DNA. Considering the long incubation times required for coralyne-disproportioned samples to reach equilibrium at 4°C (Figs 5 and 6), it was important to determine if coralyne degradation is at all responsible for reversion from the disproportioned state. To investigate this possibility, after 9 months of storage at 4°C from the time of coralyne addition, CD spectra were acquired for the same samples from which reversion time constants were measured. All three samples (i.e. 16mer, 32mer and polymer duplex samples) exhibited an appreciable reduction in coralyne absorption bands (25–40%) with respect to the original sample spectra, which could be indicative of coralyne degradation. Nevertheless, upon heat cycling to 75 and back to 4°C, all three samples completely returned to the coralyne-disproportioned state. These observations confirm that the reversion time constants reported in this study are principally due to the kinetics of DNA secondary structure rearrangements, rather than coralyne degradation.
Our observation that the secondary structure equilibrium of a (dA)n·(dT)n sample with coralyne at 4°C is tilted towards the duplex state for shorter DNA strand lengths suggests that coralyne binds the 16mer duplex with a greater per base pair free energy than longer duplexes and/or coralyne binds the secondary structures in a disproportioned 16mer sample with a lesser per base pair free energy than in disproportioned samples with longer DNA strands. While either case would be somewhat surprising, Hopkins et al. (22) have shown that the average ΔH for dissociation of an A·T base pair is 3.0 kcal mol–1 greater for poly(dA)·poly(dT) than for (dA)19·(dT)19. Furthermore, the average ΔH for dissociation of the A·T Hoogsteen base pair in a poly(dA)·poly(dT)·poly(dT) triplex is nearly twice that of a (dA)19·(dT)19·(dT)19 triplex (22). These previous studies indicate that the precise structures (either static or dynamic) of the duplexes and the triplexes of the present study likely depend upon DNA strand length. If coralyne binding is modulated by these length-dependent structures, this could be the origin of the length-dependent secondary structure equilibrium at 4°C. We propose that the length dependence of this equilibrium results primarily from a length-dependent binding of coralyne to (dA)n·(dT)n duplexes. Our basis for this proposal is the observation that CD spectra of (dA)n·(dT)n duplex samples containing coralyne change with strand length to a much greater extent than the spectra of coralyne-disproportioned samples at the same temperature (Figs 5 and 6). This could result from the exact mode/geometry of coralyne binding to a (dA)n·(dT)n duplex being a length-dependent phenomenon.
CONCLUSION
In conclusion, we have shown that nucleic acid binding by a small molecule, such as coralyne, is a powerful means to control DNA secondary structure. However, we have also shown that the kinetics and thermodynamics of DNA structure formation in the presence of small molecule intercalators can be complex. Even our rather minimalist system composed of (dA)n·(dT)n duplexes has revealed several aspects of DNA secondary structure formation in the presence of coralyne that depend upon strand length. This length dependence may, in part, result from a length-dependent binding of coralyne to (dA)n·(dT)n duplexes. In any case, if we consider that the three DNA secondary structures of this study [i.e. duplex, triplex, (dA)n self-structure] are likely to have different enthalpies and entropies of coralyne binding, it is then perhaps not too surprising that coralyne binding can produce a complex relationship between temperature and DNA secondary structure. One aspect of DNA–coralyne interactions that we have not explored in the present work is the possible effect of coralyne concentration on DNA secondary structure equilibrium. It is altogether possible that altering intercalator concentration could be a means to control secondary structure equilibrium at a particular temperature.
Acknowledgments
ACKNOWLEDGEMENTS
We thank the reviewers of the manuscript for helpful comments. Support for this research from the NIH (GM62873) and the Research Corporation is gratefully acknowledged.
REFERENCES
- 1.Lerman L.S. (1963) The structure of the DNA-acridine complex. Proc. Natl Acad. Sci. USA, 49, 94–102. [DOI] [PMC free article] [PubMed] [Google Scholar]
- 2.Hurley L.H. (1989) DNA and associated targets for drug design. J. Med. Chem., 32, 2027–2033. [DOI] [PubMed] [Google Scholar]
- 3.Krugh T.R. (1994) Drug-DNA interactions. Curr. Opin. Struct. Biol., 4, 351–364. [Google Scholar]
- 4.Chaires J.B. (1997) Energetics of drug-DNA interactions. Biopolymers, 44, 201–215. [DOI] [PubMed] [Google Scholar]
- 5.Hurley L.H. (2002) DNA and its associated processes as targets for cancer therapy. Nature Rev. Cancer, 2, 188–200. [DOI] [PubMed] [Google Scholar]
- 6.White S., Szewczyk,J.W., Turner,J.M., Baird,E.E. and Dervan,P.B. (1998) Recognition of the four Watson-Crick base pairs in the DNA minor groove by synthetic ligands. Nature, 391, 468–471. [DOI] [PubMed] [Google Scholar]
- 7.Gottesfeld J.M., Neely,L., Trauger,J.W., Baird,E.E. and Dervan,P.B. (1997) Regulation of gene expression by small molecules. Nature, 387, 202–205. [DOI] [PubMed] [Google Scholar]
- 8.Helene C. (1991) The anti-gene strategy—control of gene-expression by triplex-forming-oligonucleotides. Anticancer Drug Des., 6, 569–584. [PubMed] [Google Scholar]
- 9.Arya D.P., Coffee,R.L., Willis,B. and Abramovitch,A.I. (2001) Aminoglycoside-nucleic acid interactions: remarkable stabilization of DNA and RNA triple helices by neomycin. J. Am. Chem. Soc., 123, 5385–5395. [DOI] [PubMed] [Google Scholar]
- 10.Siddiqui-Jain A., Grand,C.L., Bearss,D.J. and Hurley,L.H. (2000) Direct evidence for a G-quadruplex in a promoter region and its targeting with a small molecule to repress c-MYC transcription. Proc. Natl Acad. Sci. USA, 99, 11593–11598. [DOI] [PMC free article] [PubMed] [Google Scholar]
- 11.Hud N.V. and Anet,F.A.L. (2000) Intercalation-mediated synthesis and replication: a new approach to the origin of life. J. Theor. Biol., 205, 543–562. [DOI] [PubMed] [Google Scholar]
- 12.Lee J.S., Latimer,L.J.P. and Hampel,K.J. (1993) Coralyne binds tightly to both T·A·T-containing and C·G·C+-containing DNA triplexes. Biochemistry, 32, 5591–5597. [DOI] [PubMed] [Google Scholar]
- 13.Wilson W.D., Gough,A.N., Doyle,J.J. and Davidson,M.W. (1976) Coralyne. Intercalation with DNA as a possible mechanism of antileukemic action. J. Med. Chem., 19, 1261–1263. [DOI] [PubMed] [Google Scholar]
- 14.Wilson W.D., Tanious,F.A., Mizan,S., Yao,S.J., Kiselyov,A.S., Zon,G. and Strekowski,L. (1993) DNA triple-helix specific intercalators as antigene enhancers—unfused aromatic cations. Biochemistry, 32, 10614–10621. [DOI] [PubMed] [Google Scholar]
- 15.Latimer L.J.P., Payton,N., Forsyth,G. and Lee,J.S. (1995) The binding of analogs of coralyne and related heterocyclics to DNA triplexes. Biochem. Cell Biol., 73, 11–18. [DOI] [PubMed] [Google Scholar]
- 16.Ren J.S. and Chaires,J.B. (1999) Sequence and structural selectivity of nucleic acid binding ligands. Biochemistry, 38, 16067–16075. [DOI] [PubMed] [Google Scholar]
- 17.Polak M. and Hud,N. (2002) Complete disproportionation of duplex poly(dT)·poly(dA) into triplex poly(dT)·poly(dA)·poly(dT) and poly(dA) by coralyne. Nucleic Acids Res., 30, 983–992. [DOI] [PMC free article] [PubMed] [Google Scholar]
- 18.Sandstrom K., Warmlander,S., Graslund,A. and Leijon,M. (2002) A-tract DNA disfavors triplex formation. J. Mol. Biol., 315, 737–748. [DOI] [PubMed] [Google Scholar]
- 19.Moraru-Allen A.A., Cassidy,S., Alvarez,J.L.A., Fox,K.R., Brown,T. and Lane,A.N. (1997) Coralyne has a preference for intercalation between TA·T triples in intramolecular DNA triple helices. Nucleic Acids Res., 25, 1890–1896. [DOI] [PMC free article] [PubMed] [Google Scholar]
- 20.Mergny J.L., Duval-Valentin,G., Nguyen,C.H., Perrouault,L., Faucon,B., Rougee,M., Montenay-Garestier,T., Bisagni,E. and Helene,C. (1992) Triple helix specific ligands. Science, 256, 1681–1684. [DOI] [PubMed] [Google Scholar]
- 21.Scaria P.V. and Shafer,R.H. (1991) Binding of ethidium-bromide to a DNA triple helix—evidence for intercalation. J. Biol. Chem., 266, 5417–5423. [PubMed] [Google Scholar]
- 22.Hopkins H.P., Hamilton,D.D., Wilson,W.D. and Zon,G. (1993) Duplex and triple-helix formation with dA19 and dT19—thermodynamic parameters from calorimetric, NMR, and circular-dichroism studies. J. Phys. Chem., 97, 6555–6563. [Google Scholar]
- 23.Hopkins H.P., Hamilton,D.D., Wilson,W.D., Campbell,J. and Fumero,J. (1993) Effects of C2H5OH, Na+(aq), N(CH2CH3)4+(aq), and Mg2+(aq) on the thermodynamics of double-helix-to-random-coil transitions of poly(dA)-poly(dT) and poly(dAdT). J. Chem. Thermodyn., 25, 111–126. [Google Scholar]


