Abstract
Given the wealth of new RNA structures and the growing list of RNA functions in biology, it is of great interest to understand the repertoire of RNA folding motifs. The ability to identify new and known motifs within novel RNA structures, to compare tertiary structures with one another and to quantify the characteristics of a given RNA motif are major goals in the field of RNA research; however, there are few systematic ways to address these issues. Using a novel approach for visualizing and mathematically describing macromolecular structures, we have developed a means to quantitatively describe RNA molecules in order to rapidly analyze, compare and explore their features. This approach builds on the alternative η,θ convention for describing RNA torsion angles and is executed using a new program called PRIMOS. Applying this methodology, we have successfully identified major regions of conformational change in the 50S and 30S ribosomal subunits, we have developed a means to search the database of RNA structures for the prevalence of known motifs and we have classified and identified new motifs. These applications illustrate the powerful capabilities of our new RNA structural convention, and they suggest future adaptations with important implications for bioinformatics and structural genomics.
INTRODUCTION
A major new source of information on RNA structure has been provided by the high resolution crystal structures of ribosomal subunits and their complexes with cofactors (1). Together with new structures of ribozymes and a diversity of RNA–protein complexes, the ribosomal structures have expanded the RNA structural database by an order of magnitude (2). Despite the richness of this new database, its analysis has been hampered by the absence of tools for structural search, comparison and examination.
To create a more tractable format for describing nucleic acid structure, the conformational space of individual nucleotides has been simplified by assigning two virtual bonds that extend from P to C4′ and from C4′ to P of the adjacent nucleotide (3). Rotating around these virtual bonds are two corresponding pseudotorsions, η (C4′i-1–Pi–C4′i–Pi+1) and θ (Pi–C4′i–Pi+1–C4′i+1), which describe conformational features of a given nucleotide, i (Fig. 1). The values of these pseudotorsions can be plotted in a manner analogous to a Ramachandran plot (4,5), and qualitative correlations between the η–θ values and discrete nucleotide conformations have been demonstrated (5). In more recent quantitative work, statistical analysis has established that specific nucleotide conformations are represented by individual regions of an updated η–θ plot that incorporates all entries from a current database of high-resolution RNA structures (L.M.Wadley, C.M.Duarte and A.M.Pyle, manuscript in preparation).
Figure 1.
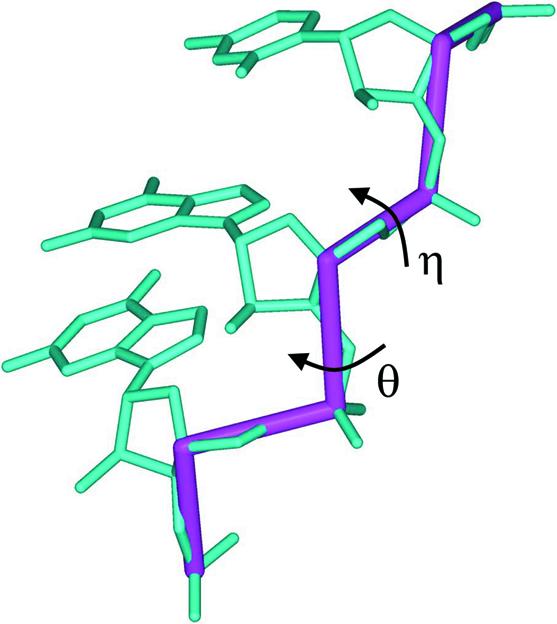
RNA pseudotorsions. RNA trinucleotide (blue) in Type-A conformation with virtual bonds (red) connecting atoms P to C4′ and C4′ to P. Each of these virtual bonds is the central bond of the corresponding pseudotorsions, η (C4′n-1–Pn–C4′n–Pn+1) and θ (Pn–C4′n–Pn+1–C4′n+1).
To evaluate the conformation of entire RNA structures, we have combined our shorthand notation for describing individual nucleotide conformation (η and θ) with information about position along the RNA biopolymer. The basic linearity of an RNA polymer provides a key to organizing conformational information regardless of molecular size or complexity. Linear ordering of η–θ values results in a computationally searchable, sequential description of three-dimensional data, which we call an ‘RNA worm’. By applying a novel conformational analysis program (called PRIMOS), RNA worms can be used to compare two or more different structures on a nucleotide-by-nucleotide basis and to pinpoint structural similarities and differences. For example, PRIMOS can detect nucleotide-level structural differences between different complexes of the same molecule. This is demonstrated by analyzing the structures of 50S and 30S ribosomal complexes bound to a variety of ligands. Additionally, PRIMOS can perform structural motif searches. For example, a search of ribosomal subunits for ‘S-motifs’ not only located the positions of all such motifs but also identified two distinct subtypes of S-motifs that can be distinguished by overall conformation and variance in their η–θ values.
MATERIALS AND METHODS
PRIMOS software
PRIMOS (Probing RNA structures to Identify Motifs and Overall Structural changes) is a software package written in Perl. The program creates RNA worm files from a directory of PDB files. The program can then perform structural comparisons and motif searches. All calculations were performed on a 933 MHz PC. Creating an RNA worm database for the current RNA structural database (453 PDB files, ∼73 000 nucleotides) takes approximately 3 min. A four-nucleotide motif search of the database takes under 1 min. PRIMOS is available online at http://pylelab.org
Database
The database used in the study was compiled from the PDB (2), NDB (6) and RNABASE (7) websites. Two-dimensional graphs were created with Statistica 6.0 (StatSoft) and three-dimensional RNA worm plots were created with POV-Ray 3.0 (POV-Team). Structural visualizations were performed with Swiss-PdbViewer (GlaxoSmithKline) and WebLab (Accelrys).
Analysing and evaluating Δ(η,θ)
Since the pseudotorsions η and θ comprise a two-dimensional description of overall nucleotide morphology, the operator, Δ(η,θ) (equation 1), calculates the difference between the descriptions of two nucleotide morphologies. The difference between nucleotide morphologies increases as a function of Δ(η,θ). We have been able to establish quantitatively that nucleotides with Δ(η,θ) < 25° will generally be similar to each other, while those with Δ(η,θ) > 25° will not be (L.M.Wadley, C.M.Duarte and A.M.Pyle, unpublished results). For motif searches of the database, a search result was identified as a match if
and the Δ(η,θ) for any single nucleotide position within the match was less than 40°.
The actual calculation of Δ(η,θ) is modified if:
X = |ηiA – ηiB| > 180° or X = |θiA – θiB| > 180°
In either or both of these cases, the quantity (360° – X) is substituted into equation 1. This is done to account for the fact that the actual edges of the η–θ plot are contiguous (i.e. 1° and 360° are only 1° away from each other).
RESULTS
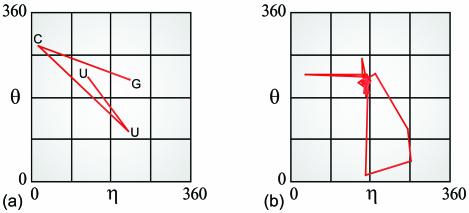
As a first step in analyzing an RNA structure, the AMIGOS programs calculate the η and θ values for each constituent nucleotide and map these coordinates onto a two-dimensional plot (5) (L.M.Wadley, C.M.Duarte and A.M.Pyle, unpublished results). By connecting the points on this plot in order of nucleotide sequence, one can define a unique ‘path’ that is characteristic of the structure. Such a path-annotated plot is a useful visual aid for describing the conformation of a small motif, such as a UUCG tetraloop (Fig. 2a). The same representation, however, quickly becomes unintelligible as the number of nucleotides in the structure increases. This is illustrated by the path-annotated plot of a larger motif, such as group II intron domain 5 (D5, 34 nts; Fig. 2b).
Figure 2.
Path-annotated η–θ plots. (a) The path through sequence space of the η–θ values for a typical UUCG tetraloop (PDB code: 1F7Y) (38); (b) the same type of path for D5 (PDB code: 1KXK) (39).
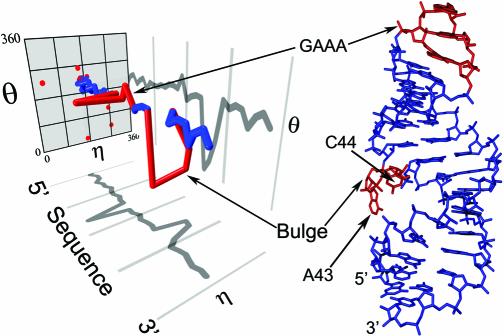
PRIMOS overcomes this problem by incorporating sequence position as a third spatial dimension. This three-dimensional representation of an RNA structure is essentially a series of stacked, two-dimensional η–θ plots, each of which contains a single point that describes an individual nucleotide. By connecting these points along the sequence axis, one obtains an ‘RNA worm’, which is a virtual roadmap for an RNA structure. At a glance, the RNA worm allows one to locate and catalog specific RNA conformational features. For example, since nucleotides from helical structures cluster at the center of an η–θ plot (η ∼ 170°; θ ∼ 200°; the ‘helical region’) (5), their corresponding RNA worms are distinctively straight. Likewise, more unusual types of RNA conformation have correspondingly complex worm representations (see Fig. 3).
Figure 3.
RNA worm of D5. The worm is plotted with projections onto the η-sequence plane and the θ-sequence plane. Also shown is the actual D5 structure. Helices (blue) are distinguishable from the non-helical features (red), bulge and GAAA tetraloop.
The RNA worm for group II intron domain 5 (D5) illustrates this point. D5 contains two helices connected by an asymmetric bulge and capped by a GAAA tetraloop. These features are all distinguishable in the D5 RNA worm (Fig. 3). The portions of the RNA worm that correspond to helices (Fig. 3, blue) travel a fairly straight path through the helical region, whereas non-helical features are readily identifiable by their large deviations from this path (Fig. 3, red). For example, the second base of the GAAA tetraloop worm has an η value close to 0°, which causes a sharp turn in the RNA worm at this position. Similarly, large changes in topology occur in portions of the worm that represent the bulge region, where both A43 and C44 nucleobases are flipped out of the structure.
Using RNA worms for structural comparisons
While the RNA worm is a useful method for describing RNA structure, it is also the foundation of a powerful tool for RNA structure-based comparisons and searches. Since an RNA worm quantitatively describes a specific RNA structure, one can compare subtle structural differences between molecules by directly comparing their worm representations. Computationally, this is done by taking two RNA worms of the same length and calculating the difference in η–θ values, Δ(η,θ), for each nucleotide with the following formula:
where i is nucleotide sequence position, and A and B are the two structures being compared (see Materials and Methods). One use of this approach, called Δ(η,θ) analysis, is to compare two different complexes of the same molecule. Even ribosomal complexes, the largest unique structures in the Protein Data Bank, can be compared nucleotide-by-nucleotide in a matter of seconds using PRIMOS.
PRIMOS comparisons of ribosomal complexes
High-resolution crystal structures of the 30S ribosomal subunit from Thermus thermophilus (T30S) and of the 50S subunit from Haloarcula marismortui (H50S) have been solved in several different complexes (1). These include unliganded forms of each subunit and complexes that are bound by a variety of translation cofactors and/or antibiotics. Crystal structures of these ribosomal forms have provided structural snapshots of events that occur during translation. Identifying and characterizing the conformational differences between various forms of the same ribosomal subunit is critical for understanding the structural permutations that lead to substrate and cofactor recognition, catalysis and reaction inhibition.
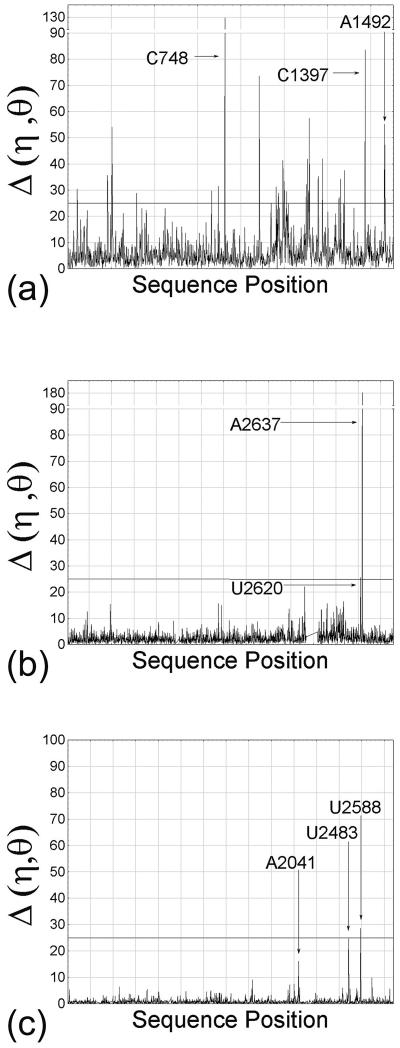
PRIMOS was used to compare several different sets of ribosomal complexes. For example, the unbound 16S portion of the T30S structure (PDB code: 1FJF) (8) was compared to the 16S portion of the T30S complex that is bound to both a tRNA anticodon stem–loop (ASL) and the antibiotic paromomycin (PDB code: 1IBL) (9). Comparison of these two structures revealed a movement of the head relative to the body domain and architectural rearrangements at specific nucleotides (9). PRIMOS shows that, while the vast majority of nucleotides retain the nearly same conformation in both complexes [average Δ(η,θ) = 4.85°], there are over 20 sites of significant conformational differences [Δ(η,θ) > 25°; see Materials and Methods] that are distributed throughout the 30S subunit (Fig. 4a). These structural changes occur both proximal to and far from the actual ligand binding sites. They include conformational rearrangements at both the ligand-bound A-site (centered at A1492) (9) and P-site (centered at C1397) nucleotides, as well as a rearrangement in the platform domain (centered at C748) that is approximately 70 Å away from the closest bound ligand. PRIMOS comparisons of unbound T30S with two other antibiotic complexes of T30S (10) demonstrate a similar distribution of conformational variation (data not shown).
Figure 4.
Ribosomal comparisons identify structural differences. (a) The Δ(η,θ) per nucleotide between T30S bound by an mRNA fragment (PDB code: 1FJF) and the same subunit also bound by paromomycin and a tRNA ASL (PDB code: 1KQS). The line at 25° indicates a threshold above which nucleotides are considered to have different conformations in each complex. Some regions undergoing conformational changes between the complexes are indicated: the A-site (A1492), the P-site (C1397) and a site in the platform domain (C748). (b) The comparison of unbound H50S (PDB code: 1JJ2) and H50S in a pre-translocational intermediate state (PDB code: 1KQS). Indicated regions are at the A-site (U2620) and P-site (A2637). (c) The comparison of D50S bound by clarithromycin (PDB code: 1K00) and bound by chloramphenicol (PDB code: 1K01). Indicated regions interact with clarithromycin (A2041, U2588) or chloramphenicol (U2483).
PRIMOS also reveals interesting conformational differences between complexes of the 50S subunit. For example, the structure of the 23S portion of unbound H50S (PDB code: 1JJ2) (11) was compared to a pre-translocation intermediate of H50S in which a tRNA CCA fragment is bound at the P-site and a CC-puromycin-nascent peptide is bound at the A-site (PDB code: 1KQS) (12). A PRIMOS comparison revealed that the two H50S structures are remarkably identical on a nucleotide-by-nucleotide basis [average Δ(η,θ) = 2.60°], although there are two specific locations that show significant conformational differences (Fig. 4b): one occurs at the ligand bound A-site [centered at U2620 and reported in analysis of the crystal structure (12); Escherichia coli homolog U2585] and the other at the ligand bound P-site (centered at A2637; E.coli A2602). Unlike the 30S subunit, the few conformational changes that were observed occur only at ligand binding sites.
This localized flexibility is underscored by an analysis of four different H50S complexes in the region around A2637. In addition to the two complexes mentioned above, two other forms of the 50S subunit have been solved. One contains ligand bound only at the A-site, while the other is bound only at the P-site (13). When these four H50S structures are overlaid, the nucleotides both 5′ and 3′ of A2637 are essentially superimposable. In contrast, A2637 adopts a distinctly different conformation and orientation in each of the structures (Fig. 5). The apparently dynamic behavior of A2637, which was also noted in the crystallographic analysis (13), may explain its previously cited role in peptide bond formation, translocation (14–18) or termination (A. Mankin, personal communication).
Figure 5.
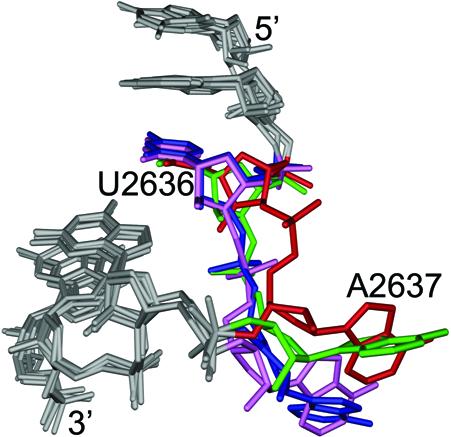
Conformational flexibility at A2637. Overlays of the G2634–U2640 portions of the H50S subunits from four different complexes. Positions C2636 and A2637 of unbound H50S (red), pre-translocation H50S (green), A-site ligand H50S (blue) and P-site ligand H50S (pink) are colored for reference. Despite the conformational heterogeneity at A2637, the 5′ and 3′ ends (gray) of the each of the structures are essentially superimposable.
PRIMOS was also used to calculate the differences between two Deinococcus radiodurans (D50S) complexes that are bound to antibiotics (19). One complex contains clarithromycin (PDB code: 1K00), which is a macrolide that blocks the tunnel for channeling the nascent peptide away from the peptidyl transferase center. The other complex contains chloramphenicol (PDB code: 1K01), which blocks tRNA from the A-site. PRIMOS comparison indicates that the structures are extremely similar [average Δ(η,θ) = 0.92°], despite the fact that the two antibiotics bind to distinct sites that are well-separated. Structural differences between the two complexes are highly localized and specific to the reported antibiotic binding sites [centered at A2041, U2588 for clarithromycin and U2483 for chloramphenicol (19); Fig. 4c]. Similar results were seen for three other D50S complexes that contain bound antibiotics (data not shown). It is important to note that difference electron density maps or nucleotide-by-nucleotide RMSD comparisons can also identify structural differences on the nucleotide level, and this has been important in analysis of the ribosomal structures. An advantage of PRIMOS analysis is the ability not only to identify such differences, but to provide information on their constituent motifs and conformational organization.
In summary, PRIMOS analysis has been applied in the analysis of extremely large ribonucleoprotein complexes, where it has succeeded in identifying important sites of conformational change in both the 30S and 50S ribosomal subunits. The results confirm that 30S subunits undergo a far greater degree of global conformational change than do 50S subunits upon binding of antibiotics and translation cofactors (20). Furthermore, PRIMOS comparisons highlight specific structural changes that occur upon ligand binding. Since the bound complexes reflect ribosomal states at different stages of translation, this type of study can be used to identify the specific conformations that are involved in function of the ribosomal machinery.
An even larger number of ribosomal complexes, from an even greater variety of species, have been structurally analyzed by cryoelectron microscopy. These structures show a much larger range of conformational heterogeneity than observed in the high-resolution atomic structures reported to date (21). When these structures are eventually resolved to high resolution, PRIMOS will provide a valuable tool for identifying and characterizing the conformational differences that distinguish them.
Motif search and discovery
Although high resolution structures of the large and small ribosomal subunits have increased the size of the RNA database by ∼8-fold (11), only three new RNA structural motifs have been identified within these complexes: the hook turn (22), the A-minor motif (23) and the K-turn (11). The K-turn fits the criteria for a structurally homogeneous motif (24). The K-turn was thus selected to test an automated approach for identifying and locating RNA structural motifs in the RNA database using PRIMOS.
The motif search is a two-stage process. In the first step, PRIMOS creates an RNA worm database from a collection of RNA structures. This step is not repeated for subsequent searches unless additional structures are added to the database. For the present study, the entire current database of RNA-containing structures was translated into RNA worm representations. In the second step, the user selects a single RNA worm fragment (the ‘bait’) that represents a motif of interest. PRIMOS then uses the bait worm as a probe and compares it with every possible worm segment of the same size in the database (e.g. a four-nucleotide motif would be compared to nucleotides 1–4, followed by 2–5, 3–6, etc. from each structure) and calculates a score,
where n is the total number of nucleotides in the probe. A search of the database at its current size, using a four-nucleotide motif probe, entails over 60 000 comparisons. Since this involves a relatively simple computation, the search takes less than 1 min. To identify and score matches, the results are then sorted by
As a test of the approach, the RNA worm for a K-turn located at nucleotides U1314–A1317 in the H50S structure was used as a probe of the database. Using this approach, PRIMOS correctly identified all nine sites of the K-turn motif in the database (data not shown), in complete correspondence with previous analyses of K-turn prevalence (11).
Identifying and characterizing two different types of S-motifs
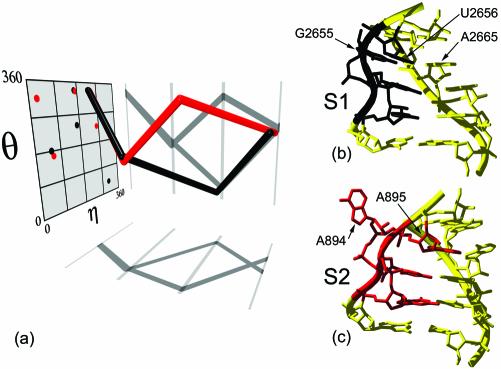
PRIMOS was also used to identify the location of all S-motifs in the 50S H.marismortui and 30S T.thermophilus rRNA structures. The S-motif (also called the loop E or bulged-G motif) is a semi-conserved, asymmetric internal loop that is composed of seven bases on two strands (25). The highest resolution structure of an S-motif (1.5 Å) was obtained for the sarcin–ricin loop of ribosomal RNA (PDB code: 480D) (26) (Fig. 6a and b). In this example, G2655 of the longer strand is bulged out and forms a base triple with the downstream base pair, U2656–A2665. The three bases are coplanar and approximately parallel to each other. Two strand reversals, at A2654 and G2655, form an S-turn on the long strand, while there is only a slight kink in the backbone of the opposite strand.
Figure 6.
Two types of S-motifs. (a) Characteristic RNA worms for analogous portions of S1 (black) and S2 (red) motifs shown as in Figure 3. (b) S1-motif structure with backbone ribbon (PDB code: 480D). Nucleotides for the S1 worm (U2653–U2656) are in black. (c) S2-motif structure (PDB code: 1JJ2). Nucleotides for the S2 worm (G892–A895) are in red.
A four-nucleotide worm that describes positions U2653–U2656 of the sarcin–ricin loop was used as a probe for S-motifs in the H50S and T30S ribosomal subunits (Table 1; Fig. 6a). This search identified nine S-motifs in H50S and T30S (henceforth called S1-motifs). Notably missing from the results was an S-motif, from helix 31A of 50S, that had been predicted based on phylogenetic and chemical probing data (25). The molecular conformation at this location in H50S shared many of the structural features of the S-motif from the sarcin–ricin loop, including an S-turn along one strand (Fig. 6c). However, the base of the bulged nucleotide (A894 of H50S) does not form a characteristic triple with its neighboring base pair. Instead, A894 is involved in a long-range tertiary interaction and is situated perpendicular to the base of A895, its 3′ neighbor. Based on these characteristics, this example represents a distinct subtype of S-motif, which we call the S2-motif.
Table 1. S1 motif search in the 50Sa and 30Sb subunits matchesc.
| Structure | Start nucleotided | Sequence | Δ̄(¯η̄,¯θ̄)¯ |
|---|---|---|---|
| 480De | 2653 | UAGU | 0.00° |
| 50S | 356 | CAGU | 6.49° |
| 50S | 586 | CAGU | 8.60° |
| 30S | 888 | GAGU | 11.92° |
| 50S | 173 | CAGU | 11.93° |
| 50S | 2690 | UAGU | 14.51° |
| 50Sf | 76 | GAGU | 14.71° |
| 50S | 211 | UAGU | 15.01° |
| 30S | 483 | CGGU | 18.61° |
| 50S | 1368 | UAGU | 22.19° |
aPDB code: 1JJ2.
bPDB code: 1FJF.
cFor match criterion, see Materials and Methods.
dNumbering is taken from PDB files.
eRNA worm used for search is from sarcin–ricin loop structure; PDB code: 480D.
fThis example is in the 5S portion of 50S; all others are from the 23S portion.
A four-nucleotide worm that describes positions G892–A895 of H50S was then used to search for other S2-motifs (Table 2). This search identified three additional occurrences of S2-motifs in the H50S subunit, all of which share the conformational characteristics described above and none of which had been identified previously. Remarkably, in the process of searching for S2 examples, PRIMOS did not generate any false-positive or negative results. Like the S2-motif, PRIMOS has successfully characterized other new substructures, such as the ‘hook-turn’, which is found in 50S rRNA (22). The identification of the S2 motif and characterization of the ‘hook turn’ establish that PRIMOS is not only a tool for searching and comparing structures, but a valuable new approach for discovering and classifying RNA architectural motifs.
Table 2. S2 motif search in the 50Sa subunit matchesb.
| Start nucleotidec | Sequence | Δ̄(¯η̄,¯θ̄)¯ |
|---|---|---|
| 892d | GCAA | 0.00° |
| 1983 | CUUG | 10.17° |
| 1775 | AAGA | 13.61° |
| 1163 | GUGA | 20.12° |
aPDB code: 1JJ2.
bFor match criterion, see Materials and Methods.
cBased on numbering from the PDB file.
dRNA worm used for search is G892–A895 from 1JJ2.
DISCUSSION
By translating a three-dimensional RNA structure into an RNA worm, one obtains a simple, analytically tractable description of an RNA molecule. PRIMOS and the RNA worm convention are particularly useful for comparing different conformational states of closely related molecules. The ability to identify nucleotides that undergo conformational changes between functional states can facilitate many different types of investigations and applications, including drug design.
Using more conventional approaches, macromolecular structures are quantitatively compared by performing three-dimensional structural superimpositions and calculating RMSD values for distances between corresponding atoms. This process tends to average differences between substructures over an entire larger macromolecule, often making it difficult to stipulate exactly where, and to what extent, regions of a structure differ. Furthermore, unless entire molecules are superimposed on one another, the conventional approach requires human input for deciding which subsections of the molecule should be superimposed. Given these issues with conventional methodologies, the worms convention, as executed through PRIMOS, represents an important complementary approach for conducting structural comparisons between macromolecules.
PRIMOS is also useful for searching the RNA structural database for known motifs, quantitatively defining their characteristics and for discovering new conformational states. By using PRIMOS to search for motifs, one can create a census of RNA motifs in a given structural database. This allows one to determine: (i) the overall prevalence and location of motifs, (ii) modes of tertiary interaction involving these motifs and their constituent structures, (iii) the sequence conservation for each example, and (iv) the degree of conformational variation at each position in a motif. This radically facilitates analysis of new and existing structures, the modeling of structures that have yet to be solved and the potential design of RNA sequences that adopt desired conformations (27,28).
Given that PRIMOS uses pseudotorsional parameters, it is reasonable to ask whether the standard RNA backbone torsion angles can be arranged sequentially to derive a meaningful description of RNA conformation. The fundamental deficiency in the latter approach is that different combinations of standard backbone torsion angles often describe essentially the same nucleotide conformation. This results from compensatory changes among differing backbone torsions that result in minimal effects on overall polynucleotide morphology (5). Additionally, it has been shown that there is a higher correlation between η–θ parameters and RMSD comparisons of nucleotide structures than between the standard torsions and RMSD comparisons (29). That PRIMOS can discriminate motifs such as S2 suggests that the worms convention can detect conformational differences with high sensitivity, which is an important finding given that it is based on a reduced representation for backbone torsional configuration.
It is interesting to compare the approach described here with related efforts to analyze protein structure. The earliest such work elaborated on the conventions that were originally introduced by Ramachandran et al. (30), in which structural motifs such as α-helices and β-sheets were described by characteristic combinations of φ and ψ backbone torsion angles. In subsequent efforts, the protein backbone torsion angles were used to sort loop motifs into specific structural classes (31–33). Known protein structural motifs, such as helices, sheets and loops, can now be identified in protein structures through application of the PROMOTIF suite of programs (34). Most directly comparable to PRIMOS (but using criteria other than torsion angles), the SS3D-P2 program can determine elements in a protein structure that match characteristics of a structural search probe (35). Despite these parallels, there is no available program for protein structural analysis that is the designed exactly like PRIMOS.
It is valuable to consider how PRIMOS might be extended and adapted. A modified PRIMOS might address the fact that, while sequence information is included in the output of a PRIMOS structural search, it is not currently a useable search key. By incorporating sequence and/or other parameters into the program structure, one could create an even more unified approach to structure analysis and prediction, resulting in powerful tools for bridging the gaps between sequence, structure and functional mechanism. Furthermore, there may be instances where the input of additional structural information (such as the disposition of the base relative to the backbone) is required for the complete definition of certain motifs. For example, one could include some of the more common metrics for describing RNA structure. These descriptors tend to focus on the relationship between bases, and they include the standard base pairing parameters, such as propeller, slide and shift (36), as well as the classification of base pairs into discrete quantitative categories (37). Furthermore, one could incorporate information on known tertiary interaction partners. Although these modifications are interesting and would be straightforward to incorporate, the simplest manifestation of PRIMOS and the RNA worm provides a valuable new approach and a powerful screen of the RNA database.
Acknowledgments
ACKNOWLEDGEMENTS
The authors would like to thank Peter Moore, Julie Su, Roland Sigel and Philip Pang for helpful discussions and critical review of the manuscript. We would also like to credit Carl Correll for the initial observation of two S-turn subtypes and James Ogle for suggesting which T30S complexes would be most interesting to compare. A.M.P. is an Investigator of the Howard Hughes Medical Institute, which we acknowledge for financial support, together with the National Institutes of Health (GM RO150313).
REFERENCES
- 1.Ramakrishnan V. (2002) Ribosome structure and the mechanism of translation. Cell, 108, 557–572. [DOI] [PubMed] [Google Scholar]
- 2.Berman H.M., Westbrook,J., Feng,Z., Gilliland,G., Bhat,T.N., Weissig,H., Shindyalov,I.N. and Bourne,P.E. (2000) The Protein Data Bank. Nucleic Acids Res., 28, 235–242. [DOI] [PMC free article] [PubMed] [Google Scholar]
- 3.Olson W.K. (1976). The spatial configuration of ordered polynucleotide chains. I. Helix formation and base stacking. Biopolymers, 15, 859–878. [DOI] [PubMed] [Google Scholar]
- 4.Malathi R. and Yathindra,N. (1982) Secondary and tertiary structural foldings in tRNA. A diagonal plot analysis using the blocked nucleotide scheme. Biochem. J., 205, 457–460. [DOI] [PMC free article] [PubMed] [Google Scholar]
- 5.Duarte C. and Pyle,A.M. (1998) Stepping through an RNA structure: a novel approach to conformational analysis. J. Mol. Biol., 284, 1465–1478. [DOI] [PubMed] [Google Scholar]
- 6.Berman H.M., Olson,W.K., Beveridge,D.L., Westbrook,J., Gelbin,A., Demeny,T., Hsieh,S.H., Srinivasan,A.R. and Schneider,B. (1992) The nucleic acid database: a comprehensive relational database of three-dimensional structures of nucleic acids. Biophys. J., 63, 751–759. [DOI] [PMC free article] [PubMed] [Google Scholar]
- 7.Murthy V.L., Srinivasan,R., Draper,D.E. and Rose,G.D. (1999) A complete conformational map for RNA. J. Mol. Biol., 291, 313–327. [DOI] [PubMed] [Google Scholar]
- 8.Wimberly B.T., Brodersen,D.E., Clemons,W.M.,Jr, Morgan-Warren,R.J., Carter,A.P., Vonrhein,C., Hartsch,T. and Ramakrishnan,V. (2000) Structure of the 30S ribosomal subunit. Nature, 407, 327–339. [DOI] [PubMed] [Google Scholar]
- 9.Ogle J.M., Brodersen,D.E., Clemons,W.M.,Jr, Tarry,M.J., Carter,A.P. and Ramakrishnan,V. (2001) Recognition of cognate transfer RNA by the 30S ribosomal subunit [see comments]. Science, 292, 897–902. [DOI] [PubMed] [Google Scholar]
- 10.Brodersen D.E., Clemons,W.M.,Jr, Carter,A.P., Morgan-Warren,R.J., Wimberly,B.T. and Ramakrishnan,V. (2000) The structural basis for the action of the antibiotics tetracycline, pactamycin and hygromycin B on the 30S ribosomal subunit. Cell, 103, 1143–1154. [DOI] [PubMed] [Google Scholar]
- 11.Klein D.J., Schmeing,T.M., Moore,P.B. and Steitz,T.A. (2001) The Kink-turn: a new RNA secondary structure motif. EMBO J., 20, 4214–4221. [DOI] [PMC free article] [PubMed] [Google Scholar]
- 12.Schmeing T.M., Seila,A.C., Hansen,J.L., Freeborn,B., Soukup,J.K., Scaringe,S.A., Strobel,S.A., Moore,P.B. and Steitz,T.A. (2002) A pre-translocational intermediate in protein synthesis observed in crystals of enzymatically active 50S subunits. Nat. Struct. Biol., 9, 225–230. [DOI] [PubMed] [Google Scholar]
- 13.Nissen P., Hansen,J., Ban,N., Moore,P.B. and Steitz,T.A. (2000) The structural basis of ribosome activity in peptide bond synthesis. Science, 289, 920–930. [DOI] [PubMed] [Google Scholar]
- 14.Moazed D. and Noller,H.F. (1989) Intermediate states in the movement of transfer RNA in the ribosome. Nature, 342, 142–148. [DOI] [PubMed] [Google Scholar]
- 15.Moazed D. and Noller,H.F. (1989) Interaction of tRNA with 23S rRNA in the ribosomal A, P and E sites. Cell, 57, 585–597. [DOI] [PubMed] [Google Scholar]
- 16.Green R. and Noller,H.F. (1999) Reconstitution of functional 50S ribosomes from in vitro transcripts of Bacillus stearothermophilus 23S rRNA. Biochemistry, 38, 1772–1779. [DOI] [PubMed] [Google Scholar]
- 17.Kirillov S.V., Porse,B.T. and Garrett,R.A. (1999) Peptidyl transferase antibiotics perturb the relative positioning of the 3′-terminal adenosine of P/P′-site-bound tRNA and 23S rRNA in the ribosome. RNA, 5, 1003–1013. [DOI] [PMC free article] [PubMed] [Google Scholar]
- 18.Porse B.T., Kirillov,S.V., Awayez,M.J., Ottenheijm,H.C. and Garrett,R.A. (1999) Direct crosslinking of the antitumor antibiotic sparsomycin and its derivatives, to A2602 in the peptidyl transferase center of 23S-like rRNA within ribosome-tRNA complexes. Proc. Natl Acad. Sci. USA, 96, 9003–9008. [DOI] [PMC free article] [PubMed] [Google Scholar]
- 19.Schlunzen F., Zarivach,R., Harms,J., Bashan,A., Tocilj,A., Albrecht,R., Yonath,A. and Franceschi,F. (2001) Structural basis for the interaction of antibiotics with the peptidyl transferase centre in eubacteria. Nature, 413, 814–821. [DOI] [PubMed] [Google Scholar]
- 20.Ban N., Nissen,P., Hansen,J., Moore,P.B. and Steitz,T.A. (2000) The complete atomic structure of the large ribosomal subunit at 2.4 Å resolution [see comments]. Science, 289, 905–920. [DOI] [PubMed] [Google Scholar]
- 21.Frank J. (2001) Ribosomal dynamics explored by cryo-electron microscopy. Methods, 25, 309–315. [DOI] [PubMed] [Google Scholar]
- 22.Szep S., Wang,J. and Moore,P.B. (2003) The crystal structure of a 26-nucleotide RNA containing a hook-turn. RNA, 9, 44–51. [DOI] [PMC free article] [PubMed] [Google Scholar]
- 23.Nissen P., Ippolito,J.A., Ban,N., Moore,P.B. and Steitz,T.A. (2001) RNA tertiary interactions in the large ribosomal subunit: the A-minor motif. Proc. Natl Acad. Sci. USA, 98, 4899–4903. [DOI] [PMC free article] [PubMed] [Google Scholar]
- 24.Leontis N.B. and Westhof,E. (1998) The 5S rRNA loop E: chemical probing and phylogenetic data versus crystal structure. RNA, 4, 1134–1153. [DOI] [PMC free article] [PubMed] [Google Scholar]
- 25.Leontis N.B. and Westhof,E. (1998) A common motif organizes the structure of multi-helix loops in 16 S and 23 S ribosomal RNAs. J. Mol. Biol., 283, 571–583. [DOI] [PubMed] [Google Scholar]
- 26.Correll C.C., Wool,I.G. and Munishkin,A. (1999) The two faces of the Escherichia coli 23 S rRNA sarcin/ricin domain: the structure at 1.11 Å resolution. J. Mol. Biol., 292, 275–287. [DOI] [PubMed] [Google Scholar]
- 27.Massire C. and Westhof,E. (1998) MANIP: an interactive tool for modelling RNA. J. Mol. Graph. Model., 16, 197–205. [DOI] [PubMed] [Google Scholar]
- 28.Jaeger L., Westhof,E. and Leontis,N.B. (2001) TectoRNA: modular assembly units for the construction of RNA nano-objects. Nucleic Acids Res., 29, 455–463. [DOI] [PMC free article] [PubMed] [Google Scholar]
- 29.Reijmers T.H., Wehrens,R. and Buydens,L.M. (2001) The influence of different structure representations on the clustering of an RNA nucleotides data set. J. Chem. Inf. Comput. Sci., 41, 1388–1394. [DOI] [PubMed] [Google Scholar]
- 30.Ramachandran G.N., Ramakrishnan,C. and Sasisekharan,V. (1963) Stereochemistry of polypeptide chain configurations. J. Mol. Biol., 7, 95–99. [DOI] [PubMed] [Google Scholar]
- 31.Venkatachalam C.M. (1968) Stereochemical criteria for polypeptides and proteins. V. Conformation of a system of three linked peptide units. Biopolymers, 6, 1425–1436. [DOI] [PubMed] [Google Scholar]
- 32.Oliva B., Bates,P.A., Querol,E., Aviles,F.X. and Sternberg,M.J. (1997) An automated classification of the structure of protein loops. J. Mol. Biol., 266, 814–830. [DOI] [PubMed] [Google Scholar]
- 33.Wintjens R.T., Rooman,M.J. and Wodak,S.J. (1996) Automatic classification and analysis of alpha alpha-turn motifs in proteins. J. Mol. Biol., 255, 235–253. [DOI] [PubMed] [Google Scholar]
- 34.Hutchinson E.G. and Thornton,J.M. (1996) PROMOTIF—a program to identify and analyze structural motifs in proteins. Protein Sci., 5, 212–220. [DOI] [PMC free article] [PubMed] [Google Scholar]
- 35.Kato H. and Takahashi,Y. (1997) SS3D-P2: a three dimensional substructure search program for protein motifs based on secondary structure elements. Comput. Appl. Biosci., 13, 593–600. [DOI] [PubMed] [Google Scholar]
- 36.Olson W.K., Bansal,M., Burley,S.K., Dickerson,R.E., Gerstein,M., Harvey,S.C., Heinemann,U., Lu,X.J., Neidle,S., Shakked,Z., Sklenar,H., Suzuki,M., Tung,C.S., Westhof,E., Wolberger,C. and Berman,H.M. (2001) A standard reference frame for the description of nucleic acid base-pair geometry. J. Mol. Biol., 313, 229–237. [DOI] [PubMed] [Google Scholar]
- 37.Leontis N.B. and Westhof,E. (2001) Geometric nomenclature and classification of RNA base pairs. RNA, 7, 499–512. [DOI] [PMC free article] [PubMed] [Google Scholar]
- 38.Ennifar E., Nikulin,A., Tishchenko,S., Serganov,A., Nevskaya,N., Garber,M., Ehresmann,B., Ehresmann,C., Nikonov,S. and Dumas,P. (2000) The crystal structure of UUCG tetraloop. J. Mol. Biol., 304, 35–42. [DOI] [PubMed] [Google Scholar]
- 39.Zhang L. and Doudna,J.A. (2002) Structural insights into group II intron catalysis and branch-site selection. Science, 295, 2084–2088. [DOI] [PubMed] [Google Scholar]


