

Abstract
The DCDHF class of single-molecule fluorophores contains an amine donor and a dicyanomethylenedihydrofuran acceptor linked by a conjugated unit (benzene, naphthalene, styrene). Molecules in this class have a number of useful properties in addition to those usually required for single-molecule studies (such as high fluorescence quantum yield and photostability), including second-order optical nonlinearity, large ground state dipole moment, and sensitivity to local environment. Moreover, most DCDHF molecules have amphiphilic structures, with a polar dicyanomethylenedihydrofuran head group and nonpolar hydrocarbon tails on the amine or furan ring, and can be used as fluorescent lipid analogs for live cell imaging. Here we demonstrate that individual molecules of several different DCDHF lipid analogs can be observed diffusing in the plasma membrane of Chinese hamster ovary (CHO) cells. The photophysical and diffusive behaviors of the DCDHF lipid analogs in membranes are described and are found to be competitive with the well-known lipid probe Tritc-DHPE.
Introduction
The study of lipid organization and dynamics in cellular membranes is a field of active research (1-4). In many cases, fluorescent lipid analogs, which mimic the amphiphilic structure of naturally occurring lipids through a polar fluorescent headgroup linked to long hydrocarbon tails, are used to study lipid organization in cellular and model lipid membranes (5). For example, fluorescent lipid analogs such as DiI or Texas Red dipalmitoyl-phosphatidylethanolamine have been shown to preferentially partition into different lipid phases in bilayers, allowing relatively stable lipid domains with diameters larger than the diffraction limit (∼300 nm) to be distinguished(6, 7). A second strategy is to use environmentally sensitive fluorophores such as laurdan, prodan, dansyl, NBD and the recently reported di-4-ANEPPHQ. These molecules have also been used to label lipid membranes through preferential partitioning into different lipid phases, and offer emission spectra, fluorescence lifetimes or fluorescence quantum yields that vary based on the polarity or the viscosity of the environment(8-10). Experiments using environmentally sensitive fluorophores have focused on high concentration imaging, where the membrane is homogeneously labeled and information on a large population of fluorophores is obtained.
With the advent of single-molecule spectroscopy (11, 12) and its extension to cellular studies (13, 14), individual lipids and membrane-associated proteins have been followed to characterize the nanoscale local structure within the plasma membrane. In many of these studies, a fluorophore label such as Cy3 (15) or Cy5 (16, 17) is covalently linked to the protein or lipid of interest. While this allows single copies of these membrane-associated molecules to be visualized, the fluorescence signal from these fluorophores is relatively stable and not typically used to report on changes in the local environment. Moreover, none of the environmentally sensitive analogs described above have been demonstrated to be useful in single-molecule imaging in the cellular environment. For example, laurdan and prodan photobleach easily and require short excitation wavelengths such as 360 nm, making them difficult to detect at the single-molecule level above the autofluorescence of cells without two-photon excitation. (8, 18) Thus, the development of an environmentally sensitive fluorescent lipid analog that can be visualized at the single molecule level would enable researchers to probe the local environment that surrounds each single molecule directly, and possibly permit the detection of unstable, nanometer-scale regions or domains.
A new class of fluorophores that possesses a lipid-like amphiphilic structure and is well-suited for single-molecule studies has been reported(19-21). These molecules, termed DCDHFs, consist of an amine donor and a dicyanomethylenedihydrofuran acceptor linked by a conjugated unit (benzene, naphthalene, styrene, etc.). The DCDHFs have a number of useful properties in addition to those usually required for single-molecule studies (such as high fluorescence quantum yield and photostability), including second-order optical nonlinearity, large ground state dipole moment, and sensitivity to local environment. Structural modifications of the DCDHF fluorophores have tuned the absorption/emission of these molecules from UV to IR wavelengths while retaining their amphiphilic nature. (19, 20) Moreover, the emission wavelength and fluorescence quantum yield of molecules in this class are sensitive to solvent polarity and local rigidity (19, 20). For example, in polymer films, high photostabilities (photobleaching quantum yield from 7.5 × 10⁻⁷ to 14 × 10−7) and high fluorescence quantum yields (0.39-0.95) have been reported, while the fluorescence quantum yields for the same DCDHFs in solution are significantly lower (20). Thus, the DCDHF molecules are a promising new class of environmentally sensitive fluorescent lipid analogs for single-molecule cellular imaging.
In this study, we utilize the seven specific DCDHF lipid analogs shown in Figure 1 as reporters of mobility in the plasma membrane of Chinese hamster ovary (CHO) cells, and describe single-molecule diffusion measurements by recording time-dependent positional trajectories. Single molecules of the DCDHF-N-12 derivative provide total numbers of photons and signal-to-noise on a par with the conventional lipid analog Tritc-DHPE. Future work will be directed toward measuring potential spectral shifts and/or changes in the lifetime or fluorescence quantum yield of the DCDHFs in the cell membrane.
Figure 1.
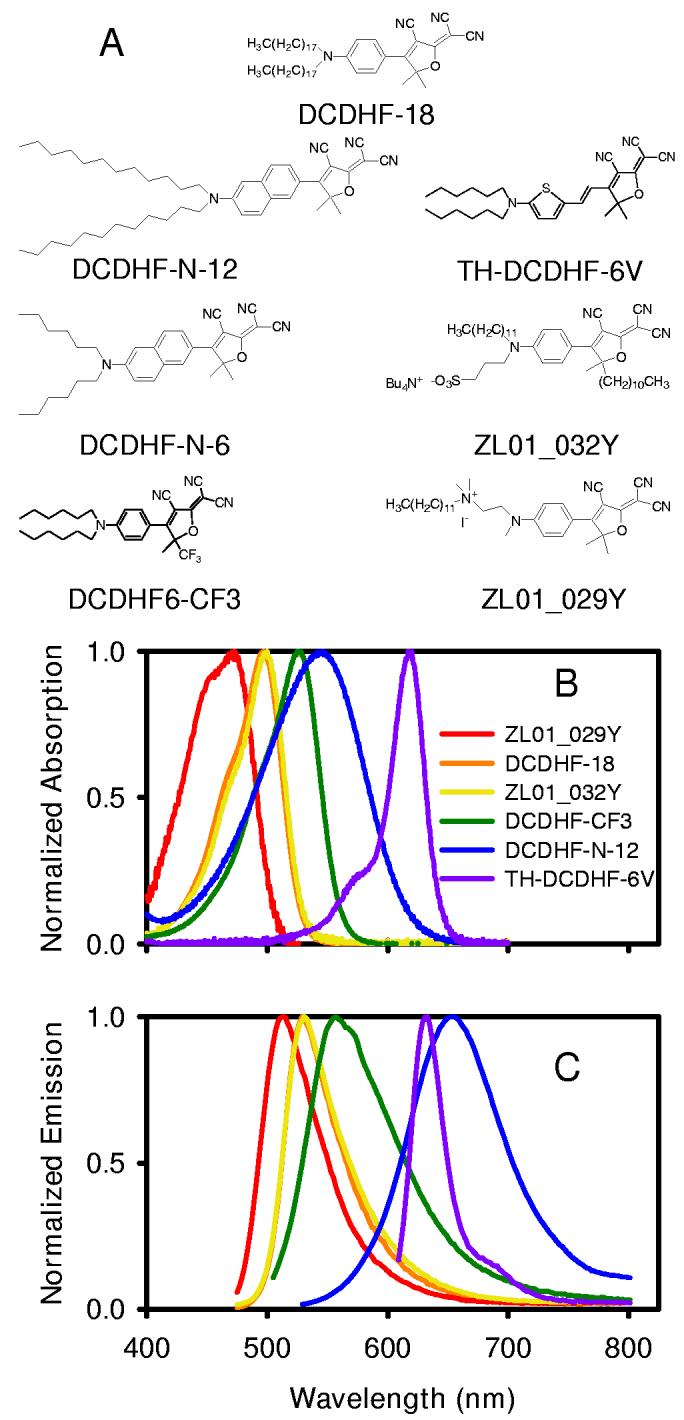
DCDHF derivatives (A) Structures of DCDHF derivatives used in this study and their names. (B) Normalized absorption spectra for the DCDHF derivatives shown in A. (C) Normalized emission spectra for the DCDHF derivatives shown in A. The excitation wavelengths used to obtain the emission spectra are 460 nm for ZL01_029Y DCDHF-18, and ZL01_032Y, 488 nm for DCDHF-CF3, 514 nm for DCDHF-N-12, and 594 nm for TH-DCDHF-6V. All spectra were taken in ethanol. DCDHF-N-6 and DCDHF-N-12 have identical spectra, so only one is shown. The fluorescence spectrum of DCDHF-CF3 exhibits a small shoulder, which we attribute to poor solubility in ethanol.
Materials and Methods
Cell Culture
Chinese hamster ovary (CHO) cells were grown in RPMI 1640 phenol red-free media (Gibco BRL, Grand Island, NY) supplemented with 10% fetal calf serum (FCS, HyClone, Logan, UT), 10 mM HEPES (4-(2-hydroxyethyl)-1-piperazineethanesulfonic acid), 1 mM sodium pyruvate, 20 μM 2-mercaptoethanol (2-hydroxy-1-ethanethiol), and 0.1 mM nonessential amino acids, 0.5 mg/ml geneticin (Gibco BRL), pH 7.4, and 5% carbon dioxide at 37°C. A more detailed description of the cell culture is provided in a previous report (16).
For imaging, cells were cultured on a chambered coverglass (Nalgene Nunc International, Naperville, IL) coated with fibronectin (Calbiochem-Novabiochem Corp., San Diego, CA) in supplemented RPMI 1640 phenol red-free medium. FCS was excluded from the media during imaging in order to lower the background fluorescence signal. Data taken with and without FCS in the imaging media were identical (22).
Labeling with DCDHF derivatives and Tritc-DHPE
N-(6-tetramethylrhodaminethiocarbamoyl)-1,2-dihexadecanoyl-sn-glycero-3-phosphoethanolamine (Tritc-DHPE) (Molecular Probes, Eugene, OR) was stored in chloroform (1 mg/ml, stock). Immediately before use, 1-5 μL of Tritc-DHPE stock solution was dried into a film and then reconstituted in 20 – 100 μL of ethanol. CHO cells were incubated with a final concentration of 100 nM-1 μM of Tritc-DHPE for 10-20 min at 37°C in supplemented RPMI 1640 media with FCS. The maximum concentration of ethanol during incubation was 1% v/v. Cholesterol-depleted cells were labeled after treatment with sphingomyelinase and β-cyclodextrin (see below), but for all other conditions cells were labeled prior to the treatment.
The syntheses of DCDHF-N-6, DCDHF-N-12, ZL01_032Y, and ZL01_029Y are described in the supporting material (for structures, see Figure 1). The syntheses of DCDHF-CF3 and TH-DCDHF-6V have been reported elsewhere (23). DCDHF-18 is prepared in a manner analogous to the parent molecule DCDHF-6 (20).
Cells were labeled with the DCDHF molecules using either the protocol described for Tritc-DHPE or by first incorporating the fluorophores in a lipid vesicle, and incubating the vesicles with the cells. Exchange of lipids between the vesicles and the plasma membrane results in delivery of single-molecule concentrations of DCDHF to the plasma membrane (17, 24). Lipid vesicles were prepared by lyophilizing 200-300 μL of egg phosphatidylcholine (20 mg/ml in chloroform stock; Avanti Polar Lipids Inc., Alabaster, AL) and a low concentration of a DCDHF derivative (1-10 mol % DCDHF) for ∼10 hr, and then reconstituting the film in 300 μL Dulbeccos phosphate buffer solution (PBS) at pH 7.4. The mixture was passed 20-30 times through an extruder with a 100 nm pore filter (Avestin Inc., Ottawa, Ontario, Canada). Cells were incubated with a 2% v/v solution of vesicles in PBS for 10 min at room temperature. Cells were then washed with PBS followed by supplemented RPMI 1640.
Sphingomyelin degradation and cholesterol depletion
Cells were incubated with sphingomyelinase (Sigma, St.Louis, MO; 0.03 U/10,000 cells) in supplemented RPMI without FCS for 10 min at 37°C. The cells were then rinsed using supplemented RPMI with FCS, and the cells were incubated with 10 mM β-cyclodextrin (Sigma), or 2 × 10⁻⁶ moles β-cyclodextrin (β-CD) per 10,000 cells, in supplemented RPMI with FCS at 37°C for 10 min. The total cell cholesterol concentration after treatment of the CHO cells for 10 min with sphingomyelinase followed by 10 min β-CD was 40 ± 2% of the total normal cell cholesterol (22). The sphingomyelinase treatment decreased the total cell sphingomyelin concentration by at least 50% (22). The sphingomyelinase and β-CD were not present in the media during imaging.
Single-molecule fluorescence imaging
The fluorescence imaging of the cells was performed with wide-field epi-illumination in an area of 8-by-8 μm, using an inverted microscope (Eclipse TE300, Nikon, Burlingame, CA). Laser illumination at 633 nm (106-1, Spectra-Physics, Mountain View, CA), 532 nm (GS32-20, Intelite Laser, Genoa, NV), or 514 nm (Innova 200 Argon Ion, Coherent, Santa Clara, CA) provided an intensity of ∼2 kW/cm2 at the sample plane. The epifluorescence was collected with a 100x magnification, 1.4 NA, oil-immersion objective (PlanApo, Nikon) and infinity-corrected objective adaptor (Nikon). A 645 nm dichroic beamsplitter and 640 nm ALPHA-Epsilon long-pass filter (Omega Optical Inc., Brattleboro, VT), a 545 nm dichroic beamsplitter and 540 nm long pass filter (Omega Optical Inc.), or a 525 nm dichroic beamsplitter and a 530 nm long pass filter (Omega Optical Inc.) were used to filter the emission. The emission was collected using an on-chip-electron-multiplying frame-transfer EMCCD-camera (Cascade 512B, Roper Scientific, Trenton, NJ) at frame rates from 33 - 100 Hz. The temperature of the sample was controlled using a homemade heating stage in combination with an objective heating collar (Bioptechs, Butler, PA). Details of this experimental apparatus have been described elsewhere. (25) The temperature of the air above the sample was maintained at 37.1 ± 0.50°C. The temperature of the solution within each well was measured after equilibration for 1 hour and found to be 36.4 ± 1.1°C.
Careful calibration of the EMCCD camera (as defined by measured multiplication gain and conversion gain at the time of the experiments) was used to convert from analog-to-digital converter (ADC) units to numbers of detected photons. We note that since the EMCCD has on-chip multiplicative gain, if only one photoelectron is generated per pixel, the distribution of ADC units in the final image would be exponential. Careful analysis(26) shows that the distribution for small numbers of photoelectrons shifts away from the exponential form as soon as more than one photon is detected, with an excess width that approaches the excess noise factor F ∼ 1.0-1.4 (value provided by the manufacturer). Here we detect at least 3 photoelectrons per pixel per frame.
Data Analysis
Single-molecule positional trajectories were mapped by visually estimating the center of the fluorescent spot in each frame within a resolution of ∼39.5 nm (dimension of one pixel). This spatial resolution was sufficient in the present experiment since the average displacement of the molecules from frame to frame was ∼100-300 nm (<r2> = 4Dt, where <r2> = mean squared radial displacement for time lag t, D = 0.2 – 1.0 μm2/s, t = 15.4 ms).
The mean squared displacements from an individual single-molecule trajectory were used to estimate the diffusion coefficient according to D = 〈r2〉/4t, with t = 30.8 ms. In this method, each single-molecule trajectory was used to calculate a value for D, and the distribution of estimated diffusion coefficients for the individual trajectories was constructed to test for heterogeneity from molecule to molecule. The number of displacements was made uniform for all trajectories by clipping the trajectories such that the first 10 steps from each trajectory were included in the analysis, and in general 5 displacements were used to calculate the individual diffusion coefficients for each trajectory (time lag = 30.8 ms, track length = 154 ms). The expected distribution of observed diffusion coefficients arising from finite trajectory length for a homogeneous population of diffusers was calculated and plotted on the histograms using the arithmetic mean of the observed values from the individual trajectories as the assumed true value of D (16, 27).
Results and Discussion
DCDHF derivatives
Seven selected DCDHF derivatives with an amphiphilic lipid-like structure provided by the polar dicyanomethylenedihydrofuran head group and the nonpolar hydrocarbon tails on the amine or furan ring (Figure 1 A) were found to enter and label the plasma membrane easily. In these structures, the hydrocarbon tail length varied from 6 to 12 carbons; ZL01_029Y had one C12 chain instead of two hydrocarbon tails. Five of the DCDHF derivatives are neutral, while ZL01_29Y has a positive charge on the quaternary amine, and ZL01_032Y has a negative charge on the sulfonic acid group.
Absorption and emission spectra in ethanol for all DCDHFs used in this study are shown in Figure 1B and 1C, respectively, and demonstrate the wide range of absorption and emission wavelengths that can be accessed through modifying the molecular structure. Photophysical properties of these DCDHF derivatives are summarized in Table 1. Additional photophysical properties of DCDHF-18, DCDHF-CF3 and TH-DCDHF-6V have been reported elsewhere (19, 20) (the optical properties of DCDHF-18 are essentially identical to the dihexyl derivative, DCDHF-6). The thiophene derivative TH-DCDHF-6V has the longest wavelength absorption with small Stokes shift, while the naphthalene derivative DCDHF-N-12 is next in absorption with a much larger Stokes shift. (The closely related molecule, DCDHF-N-6, has the same absorption and emission spectra as DCDHF-N-12). For all DCDHFs in Figure 1, the molecules exhibit sensitivity to their environment as judged by an increase in fluorescence quantum yield in a polymer host or a frozen solvent compared to solution (Table 1 and data not shown). Full details of the photophysical behavior of the naphthalene derivatives, including solvent shifts, viscosity dependence, and excited state lifetimes are under study.
Table 1.
DCDHF photophysics. Selected photophysical properties of DCDHF derivatives in various environments are summarized. Maximum absorbance and emission wavelengths and extinction coefficients are reported for the DCDHFs dissolved in ethanol. Fluorescence quantum yields (ΦF) are reported in ethanol, toluene, and a spin-cast film of poly(methylmethacrylate) (PMMA) (20). Note the dramatic increase in the quantum yields of DCDHFs in the locally rigid PMMA environment (19). DCDHF-N-6 and DCDHF-N-12 exhibit identical photophysical characteristics. ZL01_029Y does not dissolve sufficiently in toluene to obtain a reliable quantum yield.
| fluorophore | λabs(nm) ethanol | λem(nm) ethanol | εmax(M−1cm−1) ethanol | ΦFethanol | ΦFtoluene[PMMA] |
|---|---|---|---|---|---|
| DCDHF-CF3 | 525 | 557 | 86,000 | 0.0023 | 0.17[0.71] |
| TH-DCDHF-6V | 617 | 633 | 84,000 | 0.018 | 0.02 |
| DCDHF-N-6 DCDHF-N-12 | 543 | 657 | 38,000 | 0.017 | 0.85[0.98] |
| ZL01_029Y | 473 | 513 | 60,000 | 0.017 | – |
| ZL01_032Y | 500 | 531 | 76,000 | 0.016 | 0.51 |
| DCDHF-18 | 497 | 529 | 79,000 | 0.0066 | 0.044[0.92] |
DCDHF single-molecule photophysics in the plasma membrane
At higher labeling concentrations (>1 molecule per square micron), the DCDHF molecules label intracellular structures as well as the plasma membrane (Figure 2A, example shown is DCDHF-18). At single-molecule concentrations, the DCDHF fluorescence is localized to the plasma membrane as seen in upper surface (Figure 2B, molecule shown is TH-DCDHF-6V) and cross-section images (Figure 2C, molecule used is DCDHF-N-12) of the cell. No obvious spatial heterogeneity was observed in the labeling patterns of the molecules in the plasma membrane as judged by eye.
Figure 2.

Representative images of DCDHF molecules in the plasma membrane. (A) Cross-sectional image of DCDHF-18 at a higher concentration in the CHO cell. Cells were incubated with egg PC vesicles containing ∼10 mole % DCDHF-18. At these higher concentrations, DCDHF molecules labeled both the plasma membrane and internal cellular structures. (B) TH-DCDHF-6V at a single-molecule concentration in the plasma membrane of the upper cell surface. Cells were incubated with egg PC vesicles containing ∼3 mole % TH-DCDHF-6V. (C) Representative cross-sectional image of the CHO cell labeled with the egg PC vesicles containing ∼3 mole % DCDHF-N-12. DCDHF derivatives are preferentially localized to the plasma membrane at lower labeling concentrations. Scale bars represent 2 μm.
The DCDHF derivatives shown in Figure 1 are also easily visible in the plasma membrane at single-molecule concentrations, and the fluorescence images of individual molecules are indicated by arrows in Figure 2 B and C. These fluorescent spots exhibited blinking or digital photobleaching, indicative of single-molecule behavior. Fluorescence images of single molecules of DCDHF-N-6, ZL01_032Y, and ZL01_029Y are also easily visible.
A representative fluorescence time trace for DCDHF-N-12 in the plasma membrane is shown in Figure 3B, where single-step photobleaching is evident at 0.2 s. Integrating many single-molecule time traces allows construction of a histogram of the number of detected photons before photobleaching (Figure 3 C). This experiment was also repeated for the well-known membrane label, Tritc-DHPE. The mean number of detected photons from a single molecule of DCDHF-N-12 in the plasma membrane was 3700 ± 600 and the mean number of detected photons for Tritc-DHPE was 3800 ± 800 photons (Figure 3 C), where the reported error is the standard error of the mean.
Figure 3.

Comparison of DCDHF-N-12 with a rhodamine derivative Scale bar represents 2 μm. (A) Representative image of individual ZL01_029Y in the apical plasma membrane. ZL01_029Y was excited with 514 nm and imaged with an integration time of 15.4 ms per frame. (B) The integrated fluorescence intensity from a single molecule of DCDHF-N-12 as a function of time. (C) Histogram of the total number of detected photons for DCDHF-N-12 (22 molecules) as compared to Tritc-DHPE (19 molecules). (D) Histogram of signal-to-noise ratios for DCDHF-N-12 (22 molecules) as compared to Tritc-DHPE (19 molecules).
Another parameter characterizing a single-molecule emitter is the observed signal-to-noise ratio, which reports the fluctuations in observed signal from measurement to measurement in a particular detection bandwidth. With an ideal emitter, the SNR would show only Poisson fluctuations, while an unstable emitter with excessive blinking should show additional fluctuations above the Poisson value. To perform this measurement, the signal was calculated by first subtracting the offset and background counts, and then integrating over the fluorescent spot (10 × 10 pixel area). The noise was calculated from the standard deviation of the signal counts over successive 15.4 ms frames. An ensemble-averaged signal-to-noise ratio (SNR) of 4.5 ± 1.7 observed for DCDHF-N-12 in the plasma membrane was similar to the SNR of 4.5 ± 1.9 observed for Tritc-DHPE (Figure 3 D). On average, Tritc-DHPE was observed for 12.2 ± 10.4 frames, and DCDHF-N-12 was observed for 13.8 ±8.4 frames (15.4 ms per frame). The comparable nature of the SNR values results from similar brightness of the two probes, without an excessive degree of fluctuation above the expected Poisson behavior. The expected value of SNR given the number of photons detected per frame (∼16 photons per frame) is ∼4.
The fluorescence quantum yields, ΦF, have been reported in solution and in polymer films for some DCDHF derivatives (19-21). The ΦF for DCDHF-6 (19) and DCDHF-N-6 (Table 1) have been observed to vary with solvent polarity and to increase with increasing viscosity. The ΦF value for DCDHF-N-12 was not directly measured in the cell membrane, but was estimated from the average number of total detected photons per frame using Tritc-DHPE as a reference since the absorption spectra of the two dyes are quite similar. The absorption cross section of Tritc in water was assumed to be 1.6 × 10⁻¹⁶ cm2 and the ΦF value in water was assumed to be 0.15 (28). An absorption cross section of 6.3 × 10⁻¹⁷ cm2 for DCDHF-N-6 in ethanol was used to approximate the absorption cross section for DCDHF-N-12 in the membrane. Given these assumptions, the ΦF value for DCDHF-N-12 in the membrane was estimated to be ∼0.30. The observed ΦF for DCDHF-N-6 is 0.0035 in ethanol and 0.65 in toluene. Effects such as a highly specific orientation of insertion in the membrane or variation in the photophysical parameters due to solvent effects could affect the ΦF values and were not taken into account in this estimate. We speculate that the fluorescence quantum yield for the DCDHF molecules is enhanced over the values in ethanol solution due to higher local viscosity and lower polarity of the plasma membrane.
DCDHF derivatives exhibit lateral diffusion in the plasma membrane
Single DCDHF molecules diffused laterally in the plane of the CHO cell membrane in a fashion reminiscent of other lipid analogs. Distributions of diffusion coefficients obtained from single molecules of various DCDHF derivatives are shown in Figure 4. The mean diffusion coefficients for these distributions range from ∼0.5 – 2.0 μ2/s and are consistent with the diffusion coefficients reported for other fluorescent lipid analogs in the plasma membrane (15, 17, 29). The solid lines represent the expected distribution of measurements for a homogeneous population of diffusers with a diffusion coefficient given by the arithmetic mean of the observed diffusion coefficients from the individual trajectories. The observed distributions of diffusion coefficients are generally broader than expected for a homogeneous population, which could be due to partitioning into different lipid environments or aggregation of the probe with itself or other membrane molecules, although only single emitters with single-step photobleaching were tracked. The deviation from the fit, and thus the degree of heterogeneity, was smallest for the DCDHF-N-6 probe at 22°C. Strong heterogeneity in the diffusion of Tritc-DHPE was analyzed in a separate study, and a large fraction of the population with low diffusion coefficient was found to arise from molecules preferentially on the outer leaflet of the membrane. (25)
Figure 4.
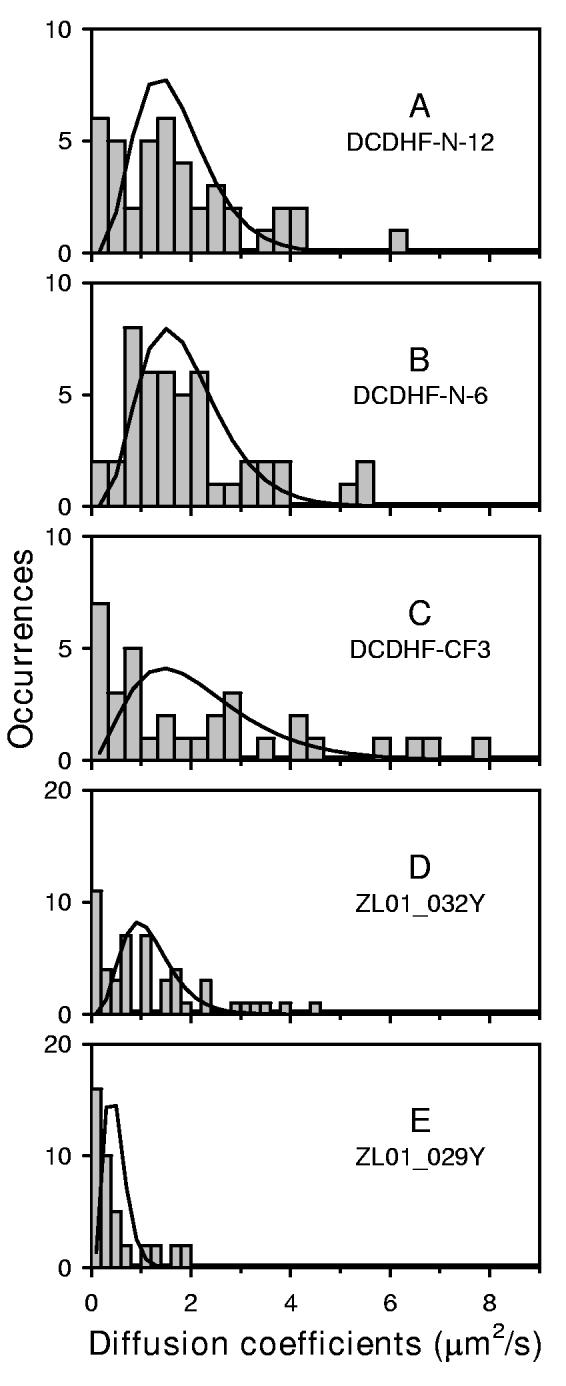
Distribution of diffusion coefficients for DCDHF derivatives The diffusion of these DCDHF molecules was observed at room temperature (22°C) with an integration time of 15.4 ms per frame, with the exception of DCDHF-CF3 which was imaged with an integration time of 10.7 ms per frame. DCDHF-N-12, DCDHF-N-6, and DCDHF-CF3 were pumped at 532 nm. ZL01_032Y and ZL01_029Y were excited at 514 nm. The trajectories were clipped to be 10 steps long (11 frames) for all derivatives except DCDHF-CF3 where 6 steps were used. The mean diffusion coefficient (obtained from each distribution of observed diffusion coefficients) used to calculate the expected homogeneous distribution (solid line) is given. (A) DCDHF-N-12 had a Dmean = 1.3 μm2/s from 41 trajectories. (B) DCDHF-N-6 had a Dmean = 1.5 μm2/s from 46 trajectories. (C) DCDHF-CF3 had a Dmean = 1.7 μm2/s from 33 trajectories. (D) Zl01_032Y had a Dmean = 0.9 μm2/s from 49 trajectories. (E) ZL01_029Y had a Dmean = 0.4 μm2/s from 41 trajectories.
It is interesting to note that the average diffusion coefficient for the neutral DCDHF molecules was ∼1.5 μm2/s, while the average diffusion coefficient for the positively charged derivative ZL01_029Y was significantly smaller, ∼0.5 μm2/s. The positively charged derivative had the smallest mean diffusion coefficient, although its membrane linker consisted of only one hydrocarbon chain rather than two. The diffusion coefficient for ZL01_029Y was similar to that of Tritc-DHPE, and both are positively charged. This result suggests that electrostatic effects may affect diffusion of the DCDHFs in the plasma membrane, not an unexpected possibility, since a charged diffuser can drag a compensating cloud along with itself. DCDHF derivatives with varying charge, but with a common core structure, can be developed so that electrostatic effects in lipid membranes may be investigated in more detail with these molecules in the future.
DCDHF-N-12 was imaged in the plasma membrane both at 22°C and at physiological temperature, 37°C (Figure 5 A and C). As expected, (25) the average diffusion coefficient increased to 2.5 μm2/s when imaged at 37°C, and the distribution of diffusion coefficients was broader than expected for a single population of diffusers.
Figure 5.

Effect of temperature and cholesterol/sphingomyelin depletion. Histograms of diffusion coefficients for DCDHF-N-12 taken at 22°C and 37°C are shown in A and C. Histograms of diffusion coefficients for DCDHF-CF3 and DCDHF-N-12 taken before and after a dual treatment of 10 min sphingomyelinase followed by 10 min β-cyclodextrin are shown in B and D. The expected homogeneous distributions are not shown for space considerations. (A) DCDHF-N-12 at normal cholesterol concentration and 22°C. Details are given in the caption for Figure 4. (B) The distribution of diffusion coefficients for DCDHF-CF3 taken before (gray bars, details in Fig. 4) and after dual treatment (black bars). The mean diffusion coefficient for DCDHF-CF3 after the dual treatment was 1.2 μm2/s when imaged at 22°C. 17 tracks, clipped to be 7 frames long, were used in the analysis. The integration time was 10.7 ms per frame. (C) DCDHF-N-12 at normal cholesterol concentration imaged at 37°C. An integration time of 15.4 ms per frame was used. (D) The distribution of diffusion coefficients for DCDHF-N-12 taken before (gray bars, details in Fig. 4) and after dual treatment (black bars). The mean diffusion coefficient for DCDHF-N-12 after the dual treatment was 1.6 μm2/s when imaged at 22°C. The 39 tracks used in the analysis were clipped to be 11 frames long. The integration time was 15.4 ms per frame.
The effect of cholesterol depletion on diffusion coefficients
When sphingomyelin is degraded (by incubation of the cells with sphingomyelinase) and cholesterol is removed from the plasma membrane (by incubation of the cells with the cholesterol sequesterant β-CD), the diffusion of certain membrane-associated MHC II proteins such as GPI-linked I-Ek and transmembrane I-Ek has been observed to decrease dramatically(22). Furthermore, nonspecifically labeled transmembrane proteins also slow down upon cholesterol extraction (22). (22) The decrease in diffusion coefficients has been attributed to the presence of a sphingomyelin degradation product called ceramide and other high melting temperature lipids that are freed from complexes with cholesterol by cholesterol depletion (22). The ceramide and high-melting-temperature lipids are believed to form a solid-like phase at room temperature presenting obstacles to diffusion. (22, 25)
Interestingly, sphingomyelin degradation and cholesterol depletion had no significant effect on the distribution of diffusion coefficients for both DCDHF-CF3 and DCDHF-N-12 (Figure 5B and D). The precise details of the position of DCDHF insertion in the plasma membrane before and after treatment are necessary for an interpretation of this result. Nevertheless, the lack of change in the diffusion coefficients suggests that there is a region of the membrane that is unaffected by cholesterol depletion, and that this environment is labeled by certain DCDHF derivatives. Whether this result is true for the charged derivatives is a subject of future research.
Conclusion
In this work we demonstrate that several members of a new class of single-molecule emitters can serve as useful lipid analogs in the plasma membrane of Chinese hamster ovary (CHO) cells, with sufficient brightness and stability to allow tracking of single-molecule diffusion. The fluorescence signal-to-noise ratio, total detected photons, and observation time for DCDHF-N-12 are competitive with that for the commercially available Tritc-DHPE, while the DCDHF derivative has the potential for reporting on the local environment. Although the DCDHF molecules should change brightness depending upon the polarity and/or rigidity of the local environment, the derivatives studied did not show this thus far. This is not surprising, since these molecules were not optimized for the largest possible environmental sensitivity, and it is well-known that small brightness differences can be hard to observe. In future work, potential spectral shifts and/or changes in the fluorescence lifetime of individual DCDHFs should be considered as reporter signals to learn about lipid and/or domain organization in the complex cell membrane. There is a difference in the diffusion coefficients for DCDHF derivatives that correlates with charge based on our current observations. Future work will be directed toward understanding the origin of the different diffusion coefficients using new charged DCDHF derivatives and toward determining the orientation of DCDHF insertion in the lipid membrane.
Acknowledgements
We thank H. M. McConnell for use of cell culture facilities and helpful discussions, and M. Vrljic for helpful discussions and critical reading of the manuscript. This work was supported in part by the Department of Energy Grant No. DE FG02-04ER63777 (WEM) and by the National Institutes of Health Grant No. 5P20-HG003638-02 (WEM and RJT).
Footnotes
Supplementary Information Available. The contents of our Supporting Information include the following: (1) synthetic procedures.
References
- 1.Brown DA, London E. Ann. Rev. Cell & Dev. Bio. 1998;14:111–136. doi: 10.1146/annurev.cellbio.14.1.111. [DOI] [PubMed] [Google Scholar]
- 2.Anderson RGW, Jacobson K. Science. 2002;296:1821–1825. doi: 10.1126/science.1068886. [DOI] [PubMed] [Google Scholar]
- 3.Edidin M. Annu. Rev. Biophys. Biomol. Struct. 2003;32:257–283. doi: 10.1146/annurev.biophys.32.110601.142439. [DOI] [PubMed] [Google Scholar]
- 4.Lagerholm BC, Weinreb GE, Jacobson K, Thompson NL. Annual Review of Physical Chemistry. 2005;56:309–336. doi: 10.1146/annurev.physchem.56.092503.141211. [DOI] [PubMed] [Google Scholar]
- 5.Schmidt T, Schutz GJ, Baumgartner W, Gruber HJ, Schindler H. J. Phys. Chem. 1995;99:17662–17668. [Google Scholar]
- 6.Feigenson GW, Buboltz JT. Biophys. J. 2001;80:2775–2788. doi: 10.1016/S0006-3495(01)76245-5. [DOI] [PMC free article] [PubMed] [Google Scholar]
- 7.Veatch SL, Keller SL. Phys. Rev. Lett. 2002;89:2681011–2681014. doi: 10.1103/PhysRevLett.89.268101. [DOI] [PubMed] [Google Scholar]
- 8.Parasassi T, Krasnowska EK, Bagatolli L, Gratton E. Journal of Fluorescence. 1998;8:365–373. [Google Scholar]
- 9.Maier O, Oberle V, Hoekstra D. Chemistry and Physics of Lipids. 2002;116:3–18. doi: 10.1016/s0009-3084(02)00017-8. [DOI] [PubMed] [Google Scholar]
- 10.Jin L, Millard AC, Wuskell JP, Clark HA, Loew LM. Biophys. J. 2005;89:L04–6. doi: 10.1529/biophysj.105.064816. [DOI] [PMC free article] [PubMed] [Google Scholar]
- 11.Moerner WE, Kador L. Phys. Rev. Lett. 1989;62:2535–38. doi: 10.1103/PhysRevLett.62.2535. [DOI] [PubMed] [Google Scholar]
- 12.Orrit M, Bernard J. Phys. Rev. Lett. 1990;65:2716–19. doi: 10.1103/PhysRevLett.65.2716. [DOI] [PubMed] [Google Scholar]
- 13.Harms GS, Cognet L, Lommerse PHM, Blab GA, Schmidt T. Biophys. J. 2001;80:2396–2408. doi: 10.1016/S0006-3495(01)76209-1. [DOI] [PMC free article] [PubMed] [Google Scholar]
- 14.Moerner WE. Trends Analyt. Chem. 2003;22:544–548. [Google Scholar]
- 15.Fujiwara T, Ritchie K, Murakoshi H, Jacobson K, Kusumi A. J. Cell Biol. 2002;157:1071–1081. doi: 10.1083/jcb.200202050. [DOI] [PMC free article] [PubMed] [Google Scholar]
- 16.Vrljic M, Nishimura SY, Brasselet S, Moerner WE, McConnell HM. Biophys. J. 2002;83:2681–2692. doi: 10.1016/S0006-3495(02)75277-6. [DOI] [PMC free article] [PubMed] [Google Scholar]
- 17.Schütz GJ, Kada G, Pastushenko VP, Schindler H. EMBO J. 2000;19:892–901. doi: 10.1093/emboj/19.5.892. [DOI] [PMC free article] [PubMed] [Google Scholar]
- 18.Bagatolli LA, Gratton E. Biophys. J. 2000;78:290–305. doi: 10.1016/S0006-3495(00)76592-1. [DOI] [PMC free article] [PubMed] [Google Scholar]
- 19.Willets KA, Callis PR, Moerner WE. J. Phys. Chem. B. 2004;108:10465–10473. [Google Scholar]
- 20.Willets KA, Ostroverkhova O, He M, Twieg RJ, Moerner WE. J. Amer. Chem. Soc. 2003;125:1174–1175. doi: 10.1021/ja029100q. [DOI] [PubMed] [Google Scholar]
- 21.Willets KA, Nishimura SY, Schuck PJ, Twieg RJ, Moerner WE. Accounts Chem. Res. 2005;38:549–556. doi: 10.1021/ar0401294. [DOI] [PubMed] [Google Scholar]
- 22.Vrljic M, Nishimura SY, Moerner WE, McConnell HM. Biophys. J. 2005;88:334–347. doi: 10.1529/biophysj.104.045989. [DOI] [PMC free article] [PubMed] [Google Scholar]
- 23.He M, Twieg R, Ostroverkhova O, Gubler U, Wright D, Moerner WE. Proc. SPIE. 2002;4802:9–20. [Google Scholar]
- 24.Struck D, Pagano R. J. Biol. Chem. 1980;255:5404–5410. [PubMed] [Google Scholar]
- 25.Nishimura SY, Vrljic M, Klein LO, McConnell HM, Moerner WE. Biophys J. 2006;90:927–938. doi: 10.1529/biophysj.105.070524. [DOI] [PMC free article] [PubMed] [Google Scholar]
- 26.Hynecek J, Nishiwaki T. IEEE Trans. Electr. Dev. 2003;50:239–245. [Google Scholar]
- 27.Qian H, Sheetz MP, Elson EL. Biophys. J. 1991;60:910–921. doi: 10.1016/S0006-3495(91)82125-7. [DOI] [PMC free article] [PubMed] [Google Scholar]
- 28.Soper SA, Nutter HL, Keller RA, Davis LM, Shera EB. Photochem. Photobiol. 1993;57:972–977. [Google Scholar]
- 29.Bacia K, Scherfeld D, Kahya N, Schwille P. Biophys. J. 2004;87:1034–1043. doi: 10.1529/biophysj.104.040519. [DOI] [PMC free article] [PubMed] [Google Scholar]