

Abstract
For most cancer cell types, the acquisition of metastatic ability leads to clinically incurable disease. The identification of molecules whose expression is specifically correlated with the metastatic spread of cancer would facilitate the design of therapeutic interventions to inhibit this lethal process. In order to facilitate metastasis gene discovery we have previously characterized a pair of monoclonal cell lines from the human breast carcinoma cell line MDA-MB-435 that have different metastatic phenotypes in immune-compromised mice. In this study, serum-free conditioned media was collected from the cultured monoclonal cell lines and a mass mapping technique was applied in order to profile a component of each cell line proteome. We utilized chromatofocusing in the first dimension to obtain a high resolution separation based on protein pI, and nonporous silica reverse-phase high performance liquid chromatography was used for the second dimension. Selected proteins were identified on the basis of electrospray ionization time of flight mass spectrometry (ESI-TOF MS) intact protein mapping and matrix-assisted laser desorption/ionization time of flight mass spectrometry (MALDI-TOF MS) peptide mass fingerprinting. Using this approach we were able to map over 400 proteins and plot them as a 2-D map of pI versus accurate Mr. This was performed over a pI range of 4.0–6.2, and a mass range of 6–80 kDa. ESI-TOF MS data and further analysis using MALDI-TOF MS confirmed and identified 27 differentially expressed proteins. Proteins associated with the metastatic phenotype included osteopontin and extracellular matrix protein 1, whereas the matrix metalloproteinase-1 and annexin 1 proteins were associated with the non-metastatic phenotype. These findings demonstrate that the mass mapping technique is a powerful tool for the detection and identification of proteins in complex biological samples and which are specifically associated with a cellular phenotype.
Keywords: Biomarkers , Breast tumor metastasis mass mapping
Abbreviations: CF, chromato-focusing; NPS, nonporous silica
1 Introduction
Breast cancer is a major cause of mortality among women worldwide [1]. While curative measures are possible if the cancer is detected early and remains localized, many patients will succumb to advanced disease as the primary tumor metastasizes to secondary organs. Significant progress continues to be made in detecting and treating breast primary cancer but the ability to predict the meta-static behavior of a patient’s tumor and to eradicate or control recurrent disseminated malignancy remain major clinical challenges in oncology.
The multistep nature of metastasis poses difficulties in both design and interpretation of experiments to unveil the mechanisms causing the process. Studies on excised fixed human tissues are complicated by the variance of genetic background between individuals and by the cellular heterogeneity of a complex tissue mass. In order to facilitate the identification of genes involved in the meta-static phenotype we have previously developed a well defined experimental system in which the role of candidate metastasis genes can be screened and tested. Through in vivo selection of monoclonal cultures of the MDA-MB-435 breast tumor cell line we were able to characterize a pair of subclones (M4A4 and NM2C5) which differ in their ability to complete the metastatic process [2, 3]. When orthotopically inoculated into athymic mice, both cell lines form primary tumors, but only M4A4 is capable of metastasis to the lungs and lymph nodes [2, 3]. These cell lines constitute a stable and accessible model for the identification of genes involved in the process of tumor metastasis.
We have performed initial characterization of the paired cell lines, including cytogenetic analyses and evaluation of the expression of a number of gene products previously implicated in cellular transformation and metastasis [2, 4, 5]. Recent technological advances facilitate high-throughput analyses to identify patterns of gene expression involved in complex biological processes. The advent of cDNA or oligonucleotide microarrays enables the expression profile of many genes to be simultaneously determined [6, 7]. Creation of a transcriptional profile will often yield important gene expression information, but it is the protein complement that ultimately determines cellular phenotype. Sequential changes in cellular mechanisms during transformation from a normal to a malignant phenotype occur not only at the level of transcription, but also involve protein structural changes such as sequence variation or post-translational modifications. Thus, it is important to identify changes in global protein expression in order to identify protein biomarkers involved in cancer-related processes.
The traditional method of mapping the protein content of complex biological material is 2-D SDS-PAGE [8, 9]. This method separates proteins according to isoelectric point (pI) in the first dimension and electrophoretic mobility in the second dimension. The method is sensitive and provides an estimation of molecular mass (Mr). However, there are reproducibility and quantitation problems with this method, due largely to variation in electrophoresis run conditions, and 2-D gel analyses can be labor-intensive and expensive. They also have the drawback of embedding the proteins of interest in a polyacrylamide gel, which necessitates awkward recovery and purification steps if subsequent analytical methods are to be applied downstream. In order to overcome these difficulties we have developed a 2-D liquid phase protein separation method that greatly facilitates the mapping of the protein content of human cells [10, 11]. The method is based upon pI separation in the first dimension and non-porous RP-HPLC in the second dimension. The eluant of the HPLC can be directly introduced into electrospray-time of flight mass spectroscopy (ESI-TOF MS) for analysis of the intact protein Mr [12]. The Mr together with the pI can unambiguously identify complex proteins. In addition, interlysate comparisons can be made quantitative by the use of internal standards to normalize for changes in ESI intensity.
In the present work, we demonstrate the capability of a 2-D liquid separation method for comparative protein mapping of isogenic breast tumor cell line clones. Liquid separation/mass mapping was applied to the extracellular component of the proteome of the NM2C5 and M4A4 metastasis model cell lines. Secreted and cell surface proteins are of substantial interest in disease processes. Profiling proteins expressed in these compartments could provide a better understanding of the manner in which tumor cells regulate and respond to the tissue microenvironment. These fractions are also rich in therapeutic targets. Using this approach we were able to map over 400 of the more abundant proteins and display them as a 2-D map of pI versus accurate Mr. This was performed over a pI range of 4.0–6.2, and a mass range of 6–80 kDa. Candidate differentially expressed proteins were subsequently collected in the liquid phase and identified by ESI-TOF MS and MALDI-TOF MS mass mapping. Comparison of the Mr value of intact protein with database information revealed that many of the proteins in these cell lines displayed substantial PTMs. The proteomic profiling of the isogenic metastasis model allowed us to detect and identify several metastasis-associated proteins that we had not found previously using genomic screening approaches.
2 Materials and methods
2.1 Cell culture
Human mammary tumor cell lines M4A4 and NM2C5 were derived from breast tumor cell line MDA-MB-435 as described previously [2]. Cell lines were maintained as subconfluent monolayer cultures in RPMI 1640 medium (Gibco-BRL, New York, NY, USA) supplemented with 10% fetal calf serum at 37°C under 5% v/v CO2/95% v/v air. The medium was exchanged every third day, and passaging was routinely performed as cultures reached ~75% confluency.
2.2 Sample preparation
M4A4 and NM2C5 cell lines were grown in 10% v/v fetal calf serum at 37°C until ~75% confluent. Cells were then washed extensively with serum-free medium to remove serum and accumulated secreted products. Conditioned media were prepared by incubating cell cultures in serum-free RPMI 1640 media for 24 h. Media was removed from cultures, a cocktail of protease inhibitors (EDTA-free, cat# 1873580; Roche, Alameda, CA, USA) was added, and cells and insoluble debris removed by centrifugation. Conditioned media was then concentrated approximately 200 × using Biomax-5k NMRL Ultrafree Centrifugal Filters (Millipore, Bedford, MA, USA), and stored at −80°C. All procedures were performed at 4°C. Serum-free conditioned medium was thawed and 2 mL of buffer A containing chaotropes, detergents, reducing reagents, and protease inhibitors were immediately added. Buffer A consisted of 7 m urea, 2 m thiourea, 100 mm DTT, 2% w/v n-octyl glucopyranoside (OG), 0.5% w/v Biolyte 3–10 (Bio-Rad, Hercules, CA, USA), 10% w/v glycerol, and 1 mm PMSF. The protein sample was exchanged from the lysis buffer to the equilibration buffer required for the chromatofocusing experiment using a PD-10 G-25 column (Amersham Biosciences, Piscataway, NJ, USA). Protein concentration in the buffer-exchanged sample was determined using the Bradford protein assay (Bio-Rad, Hercules, CA, USA).
2.3 Chemicals
Urea, thiourea, DTT, n-octyl glucopyranoside, glycerol, iminodiacetic acid, bis-Tris propane, and PMSF were purchased from Sigma (St. Louis, MO, USA). The reagents were used without purification. Polybuffer 74 was obtained from Amersham Biosciences. The Millipore RG system was used for water purification. Acetonitrile was HPLC-grade (Sigma), TFA was supplied as 1 mL sealed ampules (Sigma) and formic acid was ACS grade (Sigma).
2.4 Chromatography and MS
2.4.1 Chromatofocusing
A Beckman Gold model 127s binary HPLC pump with a high-pressure mixer (Fullerton, CA, USA) was used for the chromatofocusing (CF) separation. CF was performed using an HPCF-1D column (250 × 2.1 mm) (Eprogen, Darien, IL, USA). Two buffers, the equilibration/start buffer (SB) and elution buffer (EB), were used to generate an internal linear pH gradient on the column. The upper limit of the pH gradient was determined by the SB (25 mm bis-Tris propane, 6 m urea, pH 7.4), and the lower limit was determined by the EB (1:9 v/v Polybuffer 74, 6 m urea, pH 4.0). Saturated iminodiacetic acid was used to adjust the pH of all chromatofocusing buffers. A column was first equilibrated with the SB until the column pH was the same as the SB. The pH of the column was monitored on-line by a post-detector pH flow cell (Lazer Research Laboratories, Los Angeles, CA, USA). The buffer-exchanged protein sample was loaded on to the column by multiple injection. The mobile phase was switched to the EB to initiate the pH gradient. The flow-rate was set at 0.2 mL/min for the separation. A CF fraction was collected for each 0.2 pH unit eluted from the column. A salt eluting buffer (2 m NaCl, 25 mm bis-Tris propane, pH 7.4) was used to remove all proteins from the column. Samples were stored at −80°C for further analysis.
2.4.2 NPS RP-HPLC with fraction collection
Nonporous Silica (NPS) RP-HPLC was performed on an ODSIII-E (4.6 × 33 mm) column packed with 1.5 μm C18 nonporous silica beads (Eprogen, Inc.) using a Beckman System Gold (Fullerton, CA, USA). The separation was performed using 0.1% TFA in water (solvent A) and in ace-tonitrile (solvent B). 50–100 μg of proteins from each CF fraction was loaded on to the NPS RP-HPLC column for optimum separation. The column was placed in a column heater (Timberline, Boulder, CO, USA) and maintained at 65°C in order to improve the resolution and the speed of separation. The RP-HPLC column was equilibrated with 5% B, and the sample was loaded onto the column. The gradient elution was 5–15% B in 1 min, 15–25% B in 2 min, 25–31% B in 3 min, 31–41% B in 10 min, 41–47% B in 3 min, 47–67% B in 4 min and 67–100% B in 1 min. The separation was run at a flow-rate of 0.5 mL/min. The Beckman model 166 detector was set at 214 nm for detection of proteins. The proteins eluting from the column were collected using an automated fraction collector, controlled by an in-house designed DOS-based software program. Collected fractions were subjected to proteolytic digestion for MALDI-TOF MS analysis.
2.4.3 LC/ESI TOFMS
CF fractions from the first dimension chromatofocusing were loaded on to NPS RP-HPLC coupled with ESI-TOF MS for intact Mr analysis. The separation was performed under the same conditions as described in the Section 2.4.2. The flow-rate was kept at 0.5 mL/min and the same gradient profiles were used. However, solvent A was 0.1% TFA and 0.3% formic acid (FA) in water, and solvent B was 0.1% TFA and 0.3% FA in acetonitrile. A postcolumn splitter was used so that 50% of the eluant from HPLC was delivered to the source of the ESI-TOF MS (LCT system; Micromass, Manchester, UK). The LCT system was equipped with a reflectron, a 0.5 m flight tube and a dual microchannel plate detector. The LCT parameters were set as follows: capillary voltage 3250 V, extraction cone 3 V, sample cone 35 V, reflectron lens voltage 750 V, desolvation temperature 350°C, source temperature 150°C, desolvation gas flow 600 L/h and maximum nebulizer gas flow. One MS spectrum was acquired per second. Prior to each experiment, the instrument was externally calibrated by direct infusion of NaI-CsI solution using a syringe pump. To enable inter-experimental normalization, 1 μg of insulin (Sigma) was added as an internal standard to the protein sample prior to each run. Data analysis was performed using MassLynx V. 3.5 (Micromass). The MaxEnt 1 deconvolution algorithm was used to perform the deconvolution of the multiple-charged-ion umbrella of the ESI-TOF MS spectrum into a MaxEnt spectrum on a real-mass scale. The MaxEnt peaks were converted to the intensity bars where peak height was proportional to its peak area. For each separation, deconvoluted molecular weights were pooled into a single mass spectrum. They were converted to a single text file and imported into a single mass mapping program DeltaVue. Multiple separations could be combined to produce a virtual 1-D mass map, to aid in comparisons of protein levels between different samples. Prior to starting the MaxEnt data analysis, the spectrum was calibrated with a lock mass of the 1912.197 m/z peak of bovine insulin to improve the mass accuracy.
2.4.4 Tryptic digestion
A SpeedVac concentrator operating at 60°C was used to partially remove the solvents from NPS RP-HPLC fractions until the total volume of the sample was approximately 20 μL. A solution consisting of 8 m urea, 20 mm CaCl2, 0.1% w/v OG, and 200 mM NH4HCO3 was added to neutralize the remaining TFA and to denature proteins in the sample. The sample was incubated at 37°C for 30 min. Then 0.5 μg of sequencing grade modified trypsin (Promega, Madison, WI, USA) and 30 μL of 0.1% w/v OG was added. The digestion was placed at 37°C for 18 h on an agitator device set at high speed. The digestion was terminated by adding 1 μL TFA to the digest.
2.4.5 MALDI sample preparation
In preparation for MALDI analysis, 2 μm C18 ZipTips (Millipore) were used to desalt the sample prior to spotting to the MALDI plate. The peptides were eluted off the Zip-Tips and concentrated in 5 μL 60% acetonitrile with 0.1% TFA. A saturated CHCA in 50% acetonitrile and 1% TFA was diluted to a 1:4 ratio (v/v) in 50% acetonitrile and 1% TFA. Angiotensin I, ACTH (1–17), and ACTH (18–39) were added to the 1:4 diluted matrix solution. The resulting matrix-standard solution was vortexed. A 1 μL aliquot of the peptide sample was spotted on to a Micromass 96-spot plate followed by 1 μL of matrix-standard on top of the spot. We found this layering technique was very efficient for the ionization of proteins. The target was allowed to air-dry before MALDI-TOF analysis.
2.4.6 MALDI-TOF MS
A Micromass TOFSPEC 2E in the delayed-extraction reflectron mode was used to perform MALDI-MS analysis on peptides from tryptic digests of protein fraction collected from NPS RP-HPLC. A nitrogen laser (337 nm) was used as the ionization source. The operating voltage was 20 kV with 18 kV extraction voltage. The pulse voltage was set at 2650 V, the delayed time was 520 ns, and the reflectron was set at a 1:3 ratio to the source voltage. The peptide masses were measured over the range 500–4000 m/z. The final MALDI spectrum was the summed average of 70–150 spectra collected at 4 Hz. Internal standards were used to calibrate the instrument with a mass accuracy within 25 ppm. The spectra were internally calibrated and processed to obtain experimental masses. The monoisotopic peptide masses were selected using the MassLynx Transform Function (Micromass) and submitted to the MS-Fit search engine (http://prospector.ucsf.edu/ucsfhtml4.0/msfit.htm) to search the Swiss-Prot database for protein identification. The search was performed using the following parameters: (a) species: human; (b) allowing one missed cleavage; (c) possible modifications: peptide N-terminal Gln to pyroGlu, oxidation of M, protein N-terminal acetylated and phosphorylation of S, T and Y; (d) peptide mass tolerance: 100 ppm; (e) Mr ranged from 1000 to 100 000 and (f) pI range of protein 3–10. The following criteria were used for a confident search result: (a) MOWSE score was at least 103; (b) five minimum matched peptides; (c) ranged within the top four; (d) percent coverage was at least 20%. An additional stringent criterion was applied such that the molecular mass from database search was matched with experimental liquid chromotography time-of-flight (LCT) mass within 500 Da. The discrepancy of less than 500 Da relative to the database was allowed due to the extensive PTM of proteins in mammalian cells.
2.4.7 MALDI-MS/MS
MALDI-MS/MS analysis was performed on an Applied Biosystems 4700 Proteomics Analyzer (Applied Biosystems, Foster City, CA, USA) in cases where there were ambiguities in protein identification by MALDI-MS analysis such as low MOWSE score and large discrepancy of LCT Mr relative to the database Mr. The sample was spotted onto a plate in the same manner as MALDI analysis. A 0.5 μL aliquot of the peptide sample was spotted on to an Applied Biosystems 192-spot plate followed by 0.5 μL of matrix-standard on top of the spot. A 337 nm Nd:YAG laser was used as an ionization source. MALDI parent ions were fragmented by collision in the atmosphere of TOF collision cell. The collision energy was set at 1 kV. Ions with a mass window of ± 4 Da were selected in the TOF/TOF timed ion selector. The parent ions and daughter ions were analyzed in a reflector in MS/MS mode. The MS/MS spectra was acquired and processed using the instrument control software called 4700 Explorer (Applied Biosystems). The parent ion and daughter ion masses were submitted to NCBInr database using the Mascot ions search (http://www.matrixscience.com/cgi/index.pl?page=/home.html) for mass matching and verification of protein identity. The search was performed allowing one missed cleavage and possible modifications as described in Section 2.4.6. The parent mass tolerance was 100 ppm and the daughter mass tolerance was set to 0.5 Da. The identification of protein based on MS/MS analysis of one peptide was considered sufficient if the Mascot score was above significant level. The MS/MS analysis on multiple peptides was performed to increase confidence in protein identification.
2.5 Software
The 2-D liquid separations were displayed using Proteo-Vue and DeltaVue software, jointly developed by the University of Michigan and Eprogen. These software are commercially available from Eprogen. ProteoVue software converts the UV peak intensity in the chromatograms from second-dimension NPS RP-HPLC separation of each pI fraction to a “band and lane” format. The software produces a highly detailed map of pI versus hydrophobicity of protein contents in a given sample. DeltaVue has been developed to display the differences in protein levels between two samples. The software quantitatively displays one protein map in shades of red and the second protein map in shades of green. The differences between the two protein maps are obtained by point-by-point subtraction or by area difference and displayed in the third map. The software provides a means to view and quantitate protein levels.
3 Results and discussion
3.1 2-D liquid separation
A 2-D liquid separation mass mapping method has been developed in our laboratory for the analytical profiling of proteins in complex biological material. This method was applied to proteins secreted from the M4A4 and NM2C5 isogenic breast tumor cell line clones in order to identify proteins which are differentially expressed with respect to metastatic phenotype. The analytical approach fractionated extracellular proteins based upon pI in the first dimension by chromatofocusing (CF), and each fraction was subsequently separated based upon polarity of the protein in the second dimension by NPS RP-HPLC. The protein eluants from RP-HPLC were directed online to ESI TOF MS to obtain an accurate and reproducible protein intact molecular weight. Purified proteins fractionated by means of the 2-D liquid separation were collected and stored for further analysis by peptide mapping using MALDI-TOF MS. The combination of these methods enabled high accuracy protein profile comparisons between the paired tumor cell line samples.
Figure 1 shows the separation profile as detected by UV absorption at 280 nm from CF of serum-free, conditioned culture medium collected from the metastatic M4A4 cell line. The loading amount was 2.5 mg of buffer-exchanged sample. Most proteins were eluted at the mid pI range of pH 4.0–6.0. The separation was achieved within 1 h when the pI fraction was collected at 0.2 pH intervals. The pI fractions were further separated in a second dimension in order to create a 2-D protein content map. Each fraction was separated by NPS RP-HPLC (detected by UV absorbance at 214 nm) and resulting chromatograms were converted to ASCII format and plotted vertically using a 256-step gray scale. Figure 2 shows an example of a 2-D map generated using a rapid HPLC gradient of 20 min for each fraction. The horizontal and vertical dimensions of the 2-D protein content map are plotted in terms of pI and protein hydrophobicity respectively. Each band represents a protein peak eluted from the RP-HPLC separation with gray scale intensity representing the relative intensity of each protein peak. The image offers the same advantages of differential expression profiling provided by a 2-D gel analysis but is obtained in digitized form [12]. The CF step in this experiment assayed 17 pI fractions ranging from 4.0–7.4. The most acidic and basic fractions were not mapped since there were only a limited number of proteins detected. The molecular mass range of the protein in this map was estimated to be from 5–80 kDa, based on ESI-TOF measurements. Approximately 400 protein bands were detected in all 17 fractions, with the majority of proteins evident at a pI lower than 6.6. A typical NPS RP-HPLC separation is shown in Fig. 3 where an estimated 40 peaks were resolved using a fast gradient. Purified eluted proteins were collected and stored for subsequent identification by peptide mass mapping (PMM) as desired. The proteins identified by subsequent PMF, MM or MS/MS after NPS RP-HPLC of CF fraction 24 are displayed above the appropriate peaks in Fig. 3.
Figure 1.

Chromatogram of M4A4 cell line extracellular protein fraction first dimension separation by chromato-focusing. Buffer-exchanged conditioned medium was separated according to pH gradient (superimposed on the chromatogram).
Figure 2.
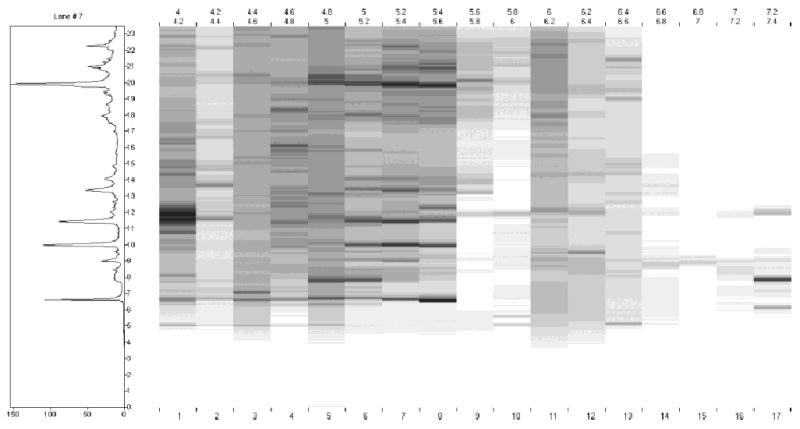
A 2-D protein content map of extracellular proteins from the metastatic M4A4 breast tumor cell line. The x-axis is fraction pH, and the y-axis is protein hydrophobicity (LC retention time). The NPS RP-HPLC chromatogram of fraction 7 (pH 5.2–5.4) is shown to the left.
Figure 3.
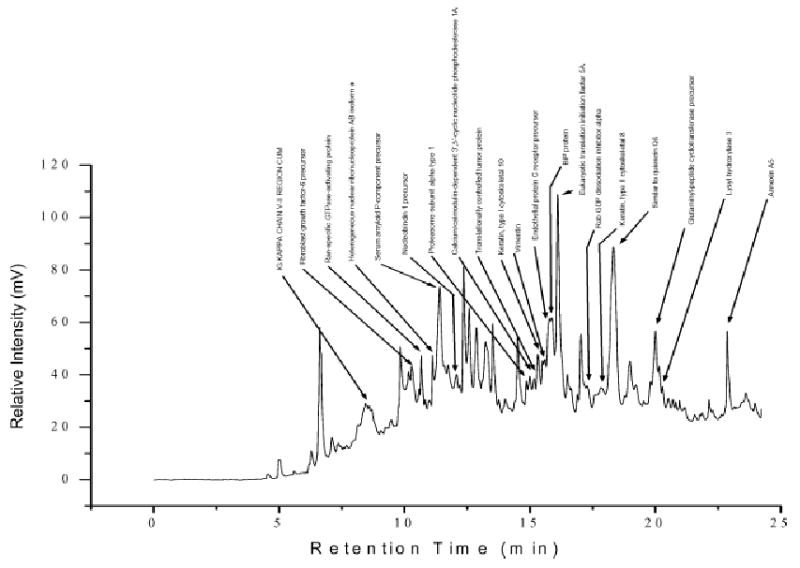
NPS RP-HPLC separation of M4A4 extracellular protein fraction 24 (pI 4.6–4.8). The identities of proteins obtained by mass mapping are listed above the corresponding chromatographic peaks.
3.2 Mass spectrometry
A major advantage of the liquid separation of proteins is the ability to directly interface with downstream analytical steps. In this case the liquid eluant was further analyzed using an ESI-TOF MS system in order to obtain Mr values for the proteins in each fraction. The TOF signature at which proteins are eluted from this system results in an umbrella spectrum of proteins. This spectrum is deconvoluted using MaxEnt software [12] to determine a single mass for each protein within 150 ppm. These analyses resulted in the derivation of 2-D protein profile maps with the Mr values plotted for each pI range and for each tumor cell line secreted protein sample. Differential mass maps were then generated for each pI fraction using the mass maps obtained from each of the two cell line samples for comparison.
Figure 4 shows a differential mass map for one pI fraction (pI 5.6) with the Mr values plotted in band format. Approximately 30 highly expressed protein bands were observed in this particular fraction with values ranging between 6 to 70 kDa. The band format differential mass map is only a representation that highlights potentially differentially expressed proteins. The actual resolution, relative quantitation and mass accuracy of specific protein bands were recovered from the original data. Confirmation of the identity of a number of candidate differentially expressed proteins was achieved by tryptic digestion and analysis by MALDI-TOF MS peptide mapping. The combination of available data (pI, intact protein Mr values, hydrophobicity from RP-HPLC, and peptide mapping) enabled us to confidently identify 88 unique proteins. Using a relative abundance threshold of > two-fold in either direction, 27 of the 88 candidate proteins were confirmed as being differentially expressed with regard to metastatic phenotype. Information on those 27 differentially expressed proteins is shown in Table 1. Examples included cases of proteins being called present/absent (±), where absent indicates a level below the detection limit of 50 pg (~100 fmol) of a 40 kDa protein [12], a sensitivity comparable to silver staining methods.
Figure 4.
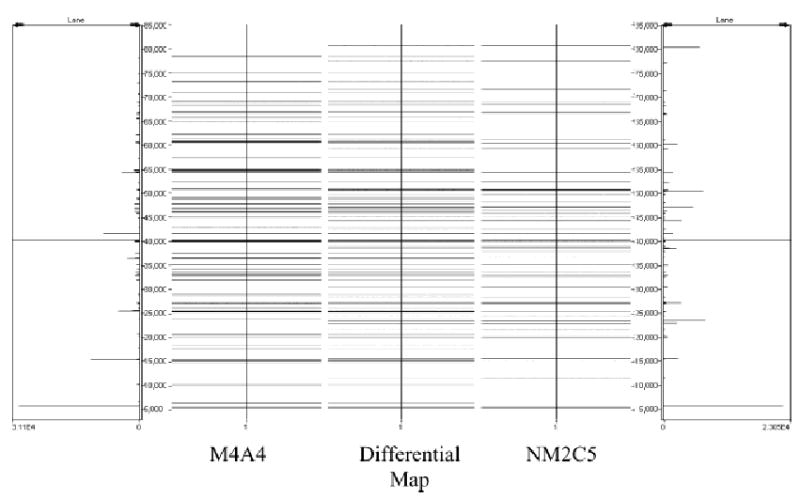
Two-dimensional mass maps of Mr versus pI comparing the M4A4 cell line to the NM2C5 cell line for CF fraction 8 in Fig. 2. The differential display map was created by point-by-point subtraction, i.e. the difference in area of the deconvoluted masses.
Table 1.
Proteins identified as differentially expressed (>TWO-fold change) in M4A4 and NM2C5 cell lines
| CF fraction (pI) | Protein identitiy | Accession no. | Theor. Mr/pI | Experimental Mr M4A4b) | Experimental Mr NM2C5b) | Protein fold-change Met/Non-Metc) | Identification methodd) | MALDI MOWSE score | Sequence coverage % |
|---|---|---|---|---|---|---|---|---|---|
| 4.2 | Calumenin precursor | O43852 | 37107/4.5 | 37396 | 37411 | 4.0 | PMF, MM | 2.68E + 08 | 70 |
| 4.2 | Neurosecretory protein VGF precursor | O15240 | 67287/4.8 | 67851 | nd | M+ | PMF, MM, | 3.8E + 08 | 35 |
| 4.2 | SPARC precursor (Osteonectin) | P09486 | 34632/4.7 | 34254 | nd | M+ | PMF, MM | 23060 | 23 |
| 4.2 | 34/67 kDa laminin receptor | P08865 | 32854/4.8 | 32768 | 32775 | 4.5 | PMF, MM | 10410 | 23 |
| 4.2 | Protein kinase C inhibitor protein-1 | P35214 | 28303/4.8 | 28217 | nd | M+ | PMF, MM | 1040 | 42 |
| 4.4 | Osteopontin precursor | P10451 | 35423/4.4 | 35389 | nd | M+ | PMF, MM | 23100 | 48 |
| 4.6 | calcium binding protein Cab45 precursor | 7706573 | 39583/5.0 | 39202 | nd | M+ | MM, MS/MS | n/a | n/a |
| 4.8 | IG KAPPA CHAIN V-II REGION CUM | P01614 | 12676/5.3 | 12767 | 12767 | 2.3 | PMF, MM | 236200 | 44 |
| 4.8 | Serum amyloid P-component precursor | P02743 | 25387/6.1 | 25536 | 25533 | 2.6 | PMF, MM | 2188 | 42 |
| 4.8 | Nucleobindin 1 precursor (CALNUC) | Q02818 | 53822/5.1 | 52103 | nd | M+ | PMF, MM, MS/MS | 61390000 | 30 |
| 4.8 | Translationally controlled tumor protein | P13693 | 19596/4.8 | 19598 | 19597 | 2.0 | PMF, MM | 92530 | 45 |
| 4.8 | Rab GDP dissociation inhibitor alpha | P31150 | 50583/5 | 50494 | 50492 | 2.2 | PMF, MM | 2794 | 30 |
| 4.8 | Keratin, type II cytoskeletal 8 | P05787 | 53675/5.5 | 53671 | 53682 | 8.2 | PMF, MM | 1320 | 24 |
| 4.8 | Similar to quiescin Q6 | 17389278a) | 67573.6 | 67322 | 67315 | 2.2 | MM, MS/MS | n/a | n/a |
| 5 | Serine/threonine protein phosphatase | O14830 | 86432/6.6 | 86476 | 86487 | 2.5 | PMF, MM | 19600 | 26 |
| 5.4 | Serine hydroxymethyltransferase, cytosolic | P34896 | 53083/7.6 | 53605 | nd | M+ | PMF, MM | 167000 | 22 |
| 5.4 | Heat shock cognate 71 kDa protein | P11142 | 70899/5.4 | 70867 | 70817 | 4.0 | PMF, MM | 61840 | 15 |
| 5.4 | Polymeric-immunoglobulin receptor precursor | P01833 | 83314/5.6 | 83437 | 83442 | 2.5 | PMF, MM | 21880 | 22 |
| 5.6 | 2-phosphopyruvate-hydratase alpha-enolase | 693933a) | 47079/7.0 | nd | 47077 | NM+ | PMF, MM, MS/MS | 8.8E + 09 | 39 |
| 5.6 | Dihydropyrimidinase related protein-2 | Q16555 | 62294/6 | 62201 | nd | M+ | PMF, MM, | 40270000 | 44 |
| 5.6 | Proteasome activator complex subunit 2 | Q9UL46 | 27362/5.4 | 27275 | nd | M+ | PMF, MM, MS/MS | 6008 | 21 |
| 5.8 | Galactoside 2-alpha-L-fucosyltransferase 1 | P19526 | 41252/6.9 | nd | 41103 | NM+ | PMF, MM | 1312 | 23 |
| 5.8 | Matrix metalloproteinase-1 | P03956 | 54007/6.5 | nd | 54239 | NM+ | PMF, MM, MS/MS | 3677 | 22 |
| 5.8 | Alpha enolase | P06733 | 47169/7 | nd | 47077 | NM+ | PMF, MM, MS/MS | 4.87E + 08 | 29 |
| 5.8 | Aldose reductase | P15121 | 35854/6.5 | nd | 35762 | NM+ | PMF, MM | 7700 | 40 |
| 5.8 | Annexin 1 (Lipocortin) | P04083 | 38715/6.6 | nd | 38626 | NM+ | PMF, MM, MS/MS | 1427 | 28 |
| 6.2 | Extracellular matrix protein 1 precursor | Q16610 | 60705/6.2 | 60602 | 60584 | 5.7 | PMF, MM, MS/MS | 8.72E + 08 | 27 |
Accession number in NCBInr database
nd, not detected
NM+, detected only in nonmetastatic sample; M+, detected only in metastatic sample
PMF, peptide mass fingerprinting (MALDI-TOF MS); MM, mass mapping (LC-MS); MS/MS, tandem mass spectrometry
The mass mapping method also provides the ability to identify differential protein expression patterns that are not based solely on abundance. The combination of peptide mapping with the highly accurate intact protein Mr data enables the elucidation of peptide-specific alterations. For example, Table 2 depicts data obtained from the mass mapping of the ECM1 protein. The combination of MS/MS ion spectra information with data obtained from tryptic digest peptide sequencing suggested that distinct ECM1 sequences and specific PTMs were detectable in M4A4 and NM2C5 cell lines. Further analyses would be required to determine the exact nature of any differential ECM1 modifications in this model, but such information may reveal important differences in pre- and post-translational processing. Differences in intramolecular peptide sequence could indicate the presence of specific protein isoforms that result from alternative splicing or RNA editing, and distinct patterns of PTM might reveal the activity of particular signaling pathways, or identify different functional states of the protein. The mass mapping technique can provide comparative information on multiple aspects of protein expression in complex biological samples.
Table 2.
MALDI-TOF MS peptide mass fingerprinting of extracellular matrix protein 1 precursor tryptic digests. Several distinct peptide sequences and specific PTMs were detected in the metastatic tumor cell line M4A4 or its non-metastatic, isogenic counterpart NM2C5
| Amino acid | Peptide | M4A4 | NM2C5 | |||||
|---|---|---|---|---|---|---|---|---|
| Start | End | Mass | Sequence | Modifications | Experimental mass | Delta ppm | Experimental mass | Delta ppm |
| 32 | 53 | 2459.2472 | (R) QLRPEHFQEVGYAAPPSPPLSR (S) | PyroGlu | 2459.2400 | −2.9 | 2459.1782 | −28 |
| 32 | 53 | 2476.2737 | (R) QLRPEHFQEVGYAAPPSPPLSR (S) | 2476.2283 | −18 | 2476.2097 | −26 | |
| 91 | 100 | 1079.6465 | (K) LLPAQLPAEK (E) | 1079.5575 | −82 | nd | ||
| 101 | 115 | 1601.8903 | (K) EVGPPLPQEAVPLQK (E) | 1601.8212 | −43 | 1601.8369 | −33 | |
| 186 | 205 | 2352.1525 | (R) QHVVYGPWNLPQSSYSHLTR (Q) | PyroGlu | 2352.135 | −7.5 | 2352.1194 | −14 |
| 186 | 205 | 2369.1791 | (R) QHVVYGPWNLPQSSYSHLTR (Q) | 2369.1323 | −20 | 2369.1367 | −18 | |
| 206 | 219 | 1609.7862 | (R) QGETLNFLEIGYSR (C) | PyroGlu | nd | 1609.8018 | 9.7 | |
| 206 | 219 | 1626.8128 | (R) QGETLNFLEIGYSR (C) | 1626.8291 | 10 | 1626.7686 | −27 | |
| 230 | 243 | 1744.7804 | (R) LECAKLVWEEAMSR (F) | 1PO4 | 1744.8835 | 59 | nd | |
| 267 | 282 | 1979.9074 | (R) FSCFQEEAPQPHYQLR (A) | 1979.9741 | 34 | 1979.9119 | 2.3 | |
| 324 | 333 | 1124.6064 | (R) NLPATDPLQR (E) | 1124.5753 | −28 | nd | ||
| 334 | 343 | 1197.7207 | (R) ELLALIQLER (E) | 1197.7059 | −12 | 1197.6912 | −25 | |
| 399 | 407 | 1151.5598 | (R) RAPYPNYDR (D) | 1151.5562 | −3.1 | nd | ||
| 400 | 416 | 2022.0296 | (R) APYPNYDRDILTIDISR (V) | 2022.0082 | −11 | 2021.9833 | −23 | |
| 408 | 416 | 1045.5893 | (R) DILTIDISR (V) | 1045.556 | −32 | nd | ||
Delta ppm, difference between experimental mass of the peptide and the database estimate
PyroGlu, N-terminal Gln to PyroGlu
1PO4, amino acid phosphorylation at first N-terminal phosphorylation site
nd, not detected
3.3 Protein identification
3.3.1 Proteins associated with the metastatic phenotype
Examples of proteins associated with the metastatic phenotype in this study included the secreted proteins osteopontin, osteonectin and extracellular matrix protein 1. Osteopontin (OPN) is a secreted glycosylated phosphoprotein found in all body fluids and in the proteinaceous matrix of mineralized tissues. It can function both as a cell attachment protein and as a cytokine, delivering signals to cells via a number of receptors including integrins and CD44. Elevated levels of OPN in both tumor tissue and blood have been identified in patients with breast cancer and high levels have been reported to be associated with poor prognosis [13]. Recent microarray gene expression studies have implicated OPN in the progression of multiple tumor types [14] and high relative OPN expression has also been associated with increased malignancy and metastasis in experimental models of breast cancer [15]. Potential mechanisms of OPN-mediated malignancy include induction of gene expression, modulation of the activity of proteases, and signaling through growth factor receptors which are important in tumor motility, invasion, and metastasis [16–18]. This study confirmed our previous findings regarding the differential expression of osteopontin in the MDA-MB-435 breast metastasis model [2] and this protein is currently under functional investigation for a role in the metastatic phenotype of M4A4 cells.
Osteonectin (also known as SPARC or BM40), another protein involved in bone matrix formation, was also found only in M4A4 samples. Osteonectin is a calcium-binding matricellular glycoprotein that binds to a range of extra-cellular matrix (ECM) components such as thrombospondin-1 and fibrillar collagens [19]. In adults, osteonectin is expressed during processes requiring extracellular matrix (ECM) turnover such as wound healing and tumor progression. The presence of high levels of tissue osteonectin has been associated with reduced collagen type IV deposition, an event that might favor leukocyte infiltration of tumor parenchyma [20], and recent studies have demonstrated that reduction of osteonectin can reduce the tumorigenic and metastatic potential of a melanoma cell line [21].
The mass mapping technique identified the extracellular matrix protein 1 (ECM1 or EM1) as being present at a significantly higher level in the metastatic M4A4 cell line relative to NM2C5. ECM1 is a secreted glycoprotein reportedly involved in bone formation [22], in endothelial cell proliferation, and in the promotion of angiogenesis [23], but its function is best studied in basement membrane physiology. ECM1 has been shown to interact specifically with perlecan, a major heparan sulfate proteoglycan of basement membranes [24] and loss of ECM1 function in humans is responsible for lipoid proteinosis, a rare, autosomal recessive skin disorder which involves widespread hyaline deposition and the disruption/reduplication of basement membranes [25]. Analysis of expression of ECM1 in a panel of human tumors found that it was closely correlated with some types of tumors, including breast carcinoma [23], gastric cancer and colorectal cancer. Furthermore, ECM1 expression correlated with the metastatic potential of tumors in one study. Primary breast cancers that had formed metastases were 76% positive while those that had not metastasized were only 33% positive for expression [26].
3.3.2 Proteins associated with the nonmetastatic phenotype
Proteins specifically associated with the nonmetastatic phenotype (NM2C5) in this study included annexin 1 (lipocortin) and matrix metalloproteinase 1 (MMP1). Annexin 1 belongs to a family of Ca(2+)-dependent phospholipid binding proteins. It has a phospholipase A2 inhibitory activity and is an endogenous anti-inflammatory mediator that operates to counteract the process of leukocyte extravasation [27]. When blood-borne neutrophils adhere to the vessel endothelium, annexin 1 is exported from the neutrophil cytoplasm to the cell surface through a mechanism that is still unclear. However, its preferential localization in certain cytoplasmic granules suggests that a process of controlled exocytosis may be responsible for its translocation to the plasma membrane [27]. This protein has also been implicated in the regulation of phagocytosis, cell signaling and proliferation [28]. Little is known about annexin 1 expression in human cancer, but a previous study reported that annexin I was upregulated in a highly metastatic lung carcinoma cell line compared to its expression in a less metastatic counterpart [29]. Conversely, in this report we found annexin 1 to be expressed more highly in the nonmetastatic counterpart of the isogenic model. As it is the coordinated expression of functional groups or subsets of proteins that influence cellular phenotype, there will be cases where individual proteins are expressed differently in alternative models or specimens dependant upon context. Indeed, this highlights the need for proteome-wide screening approaches.
Proteins of the matrix metalloproteinase (MMP) family are involved in the remodeling of the extracellular matrix in normal physiological processes, such as embryonic development, reproduction, and tissue remodeling. MMPs can also mediate basement membrane and tissue remodeling during tumor progression, thereby contributing to the formation of a microenvironment that promotes tumor growth and possibly dissemination [30]. MMP1 is a secreted enzyme with substrate specificity for the interstitial collagens types I, II, and III. There is a reported link between MMP1 expression and cancer risk; polymorphisms in the MMP1 promoter exist at a higher frequency in cancer patients than in the healthy population. The enhanced transcription of the MMP1 gene in cancer patients with these polymorphisms are also more likely to develop invasive tumors [30, 31].
It is worth noting that we previously identified OPN and annexin I as being differentially expressed in the breast metastasis model using genomic approaches; both PCR-based and oligonucleotide microarray analyses showed OPN and annexin I gene transcripts to be differentially expressed at the transcriptional level relative to the isogenic counterpart cell line. Those RNA analyses prompted verification of differential expression at the protein level by Western blotting [2, 7]. However, while transcripts for both ECM1 and MMP1 were detected in those analyses, neither was identified as differentially expressed (<two-fold difference). Thus, the differential expression of these proteins was missed using genomic analyses alone.
3.3.3 Other proteins
The majority of the proteins identified in this study were secreted or extracellular cell-surface molecules. It is conceivable that appreciable levels of cell-surface proteins are released into the media through enzymatic cleavage or shearing events. However, there were proteins detected in the secreted protein fraction that are not conventionally considered extracellular or even membrane-associated. For example, the cytoskeletal protein cytokeratin 8, and the heat shock cognate protein 71 (HSP71) are usually described as functioning in the cytosol. Cytosolic proteins may reach the extracellular space through nonspecific mechanisms of membrane turnover such as exocytosis, through leakage during secretory vesicle membrane fusion, and through natural cell death and lysis in culture. Furthermore, recent advances in proteome analysis are beginning to reveal the presence of many proteins in unexpected cellular compartments, including the heat shock protein family [32] of which HSP71 is a member. HSPs are relatively highly abundant proteins whose function is to act as molecular chaperones that facilitate proper protein folding [33]. Shin et al. [32] have shown that HSPs are relatively abundant not only in the cytoplasm, but also in the endoplasmic reticulum (ER) and on the surface of a variety of cell types. Furthermore, the functionality of HSPs at the cell surface has begun to be elucidated. It has been shown that signaling complexes comprising HSPs chemokine receptors, and growth differentiation factors are formed during immune system recognition mechanisms [34]. Thus, it has been demonstrated that HSPs can operate at the cell surface to stimulate receptor-mediated functions. A number of other proteins, including basic fibroblast growth factor, galectin-3, and thioredoxin, [35–37], appear to be secreted in a non-classic manner, independent of the ER-Golgi pathway. Galectin-3 is apparently secreted from the cytosol by membrane blebbing, a pathway which appears capable of the post-translational export of fully folded proteins [38]. Thus, the compartmentalization of specific proteins is yet to be fully understood.
4 Concluding remarks
It is important to develop rapid, accurate and reproducible protein mapping techniques for the study of tumor cell protein content since many of the changes that occur in tumor cell transformation may be manifested only in the proteome. The liquid separation mass mapping method has the potential to search for protein markers important in disease progression when applied to appropriate models or human source materials. The method provides a means of separating and mapping hundreds of proteins in the liquid phase which can be displayed in a 2-D image and where each protein can be tagged according to an exact Mr, pI and hydrophobicity. The ability to obtain an accurate Mr value is an essential piece of information to confirm the identity of proteins. Peptide mass fingerprinting may result in several matches against a database, but the accurate Mr value obtained from LC-MS analysis serves as confirmatory information which greatly aids the correct identification of proteins. The accurate Mr value is also a key issue in providing a means to search for PTMs. This improved accuracy will greatly facilitate the establishment of mass mapping databases for online query. Through comparison of such maps we will be able to identify subtle changes in human cell protein profiles that will, in turn, reveal trends in protein expression changes that correlate with disease status.
The profiling of the breast metastasis model in this study provides a starting point for metastasis-associated protein biomarker discovery. Protein biomarkers are particularly valuable for the development of early detection and therapeutic cancer treatment modalities. Whilst cell lines in culture are not fully representative of tumor cells in vivo, unlike clinical tumors, they are available in unlimited amounts for study and are homogeneous in cell lineage. The unique advantage of the MDA-MB-435 metastasis model is the ability to profile cells of opposing metastatic phenotype that originate from a common genetic background. The validation of biomarkers identified from the continued profiling of these cell lines will require extensive studies on human tissues. However, as well as providing a source for the identification of metastasis-associated proteins, once validated, the expression of specific candidate proteins can be manipulated in the appropriate metastatic or nonmetastatic cell line permitting functional testing in vivo for a role in the metastatic phenotype.
Footnotes
This work was supported in part by the National Cancer Institute under grant R21CA83808 and the National Institutes of Health under RO1 GM49500 (DML), the Rebecca and John Moores UCSD Cancer Center (VU), and a Sidney Kimmel Scholar Award (SG). We also acknowledge the National Science Foundation under grant DBI 99874 for funding of the MALDI-TOF MS instrument used in this work. Support was also generously provided by Eprogen Inc. We would like to express appreciation to Dr. Phillip Andrews for the use of the MALDI-TOF MS/MS.
References
- 1.SEER, Cancer Incidence Public-Use Database, 1997, Bethesda, MD, pp. CD-ROM.
- 2.Urquidi V, Sloan D, Kawai K, Agarwal D, et al. Clin Cancer Res. 2002;8:61–74. [PubMed] [Google Scholar]
- 3.Goodison S, Kawai K, Hihara J, Jiang P, et al. Clin Cancer Res. 2003;9:3808–3814. [PubMed] [Google Scholar]
- 4.Agarwal D, Goodison S, Nicholson B, Tarin D, et al. Differentiation. 2003;71:114–125. doi: 10.1046/j.1432-0436.2003.710202.x. [DOI] [PubMed] [Google Scholar]
- 5.Goodison S, Viars C, Grazzini M, Urquidi V. BMC Genomics. 2003;4:39–45. doi: 10.1186/1471-2164-4-39. [DOI] [PMC free article] [PubMed] [Google Scholar]
- 6.Zapala MA, Lockhart DJ, Pankratz DG, Garcia AI, et al. Genome Biol. 2002;3 doi: 10.1186/gb-2002-3-6-software0001. SOFTWARE0001 ePub. [DOI] [PMC free article] [PubMed] [Google Scholar]
- 7.Sloan D, Nicholson B, Urquidi V, Goodison S. Am J Pathol. 2004;164:315–323. doi: 10.1016/S0002-9440(10)63121-5. [DOI] [PMC free article] [PubMed] [Google Scholar]
- 8.O’Farrell PH. J Biol Chem. 1975;250:4007–4021. [PMC free article] [PubMed] [Google Scholar]
- 9.Görg A, Obermaier C, Boguth G, Harder A, et al. Electrophoresis. 2000;21:1037–1053. doi: 10.1002/(SICI)1522-2683(20000401)21:6<1037::AID-ELPS1037>3.0.CO;2-V. [DOI] [PubMed] [Google Scholar]
- 10.Wang H, Kachman MT, Schwartz DR, Cho KR, et al. Electrophoresis. 2002;23:3168–3181. doi: 10.1002/1522-2683(200209)23:18<3168::AID-ELPS3168>3.0.CO;2-A. [DOI] [PubMed] [Google Scholar]
- 11.Wall DB, Kachman MT, Gong S, Hinderer R, et al. Anal Chem. 2000;72:1099–1111. doi: 10.1021/ac991332t. [DOI] [PubMed] [Google Scholar]
- 12.Lubman DM, Kachman MT, Wang H, Gong S, et al. J Chromatogr, B Anal Technol Biomed Life Sci. 2002;782:183–196. doi: 10.1016/s1570-0232(02)00551-2. [DOI] [PubMed] [Google Scholar]
- 13.Furger KA, Menon RK, Tuckl AB, Bramwelll VH, et al. Curr Mol Med. 2001;1:621–632. doi: 10.2174/1566524013363339. [DOI] [PubMed] [Google Scholar]
- 14.Furger KA, Allan AL, Wilson SM, Hota C, et al. Mol Cancer Res. 2003;1:810–819. [PubMed] [Google Scholar]
- 15.El-Tanani M, Barraclough R, Wilkinson MC, Rudland PS. Cancer Res. 2001;61:5619–5629. doi: 10.1100/tsw.2002.238. [DOI] [PubMed] [Google Scholar]
- 16.Tuck AB, Elliott BE, Hota C, Tremblay E, et al. J Cell Biochem. 2000;78:465–475. doi: 10.1002/1097-4644(20000901)78:3<465::aid-jcb11>3.0.co;2-c. [DOI] [PubMed] [Google Scholar]
- 17.Tuck AB, Hota C, Wilson SM, Chambers AF, et al. Oncogene. 2003;22:1198–1205. doi: 10.1038/sj.onc.1206209. [DOI] [PubMed] [Google Scholar]
- 18.Tuck AB, Arsenault DM, O’Malley FP, Hota C, et al. Oncogene. 1999;18:4237–4246. doi: 10.1038/sj.onc.1202799. [DOI] [PubMed] [Google Scholar]
- 19.Sage EH. Nat Med. 1997;3:144–146. doi: 10.1038/nm0297-144. [DOI] [PubMed] [Google Scholar]
- 20.Sangaletti S, Stoppacciaro A, Guiducc IC, Torrisi MR, et al. J Exp Med. 2003;198:1475–1485. doi: 10.1084/jem.20030202. [DOI] [PMC free article] [PubMed] [Google Scholar]
- 21.Ledda MF, Adris S, Bravo AI, Kairiyama C, et al. Nat Med. 1997;3:171–176. doi: 10.1038/nm0297-171. [DOI] [PubMed] [Google Scholar]
- 22.Deckers MM, Smits P, Karperien M, Ni J, Tylzanowski P, et al. Bone. 2001;28:14–20. doi: 10.1016/s8756-3282(00)00428-2. [DOI] [PubMed] [Google Scholar]
- 23.Han Z, Ni J, Smits P, Underhill CB, et al. FASEB J. 2001;15:988–994. doi: 10.1096/fj.99-0934com. [DOI] [PubMed] [Google Scholar]
- 24.Mongiat M, Fu J, Oldershaw R, Greenhalgh R, et al. J Biol Chem. 2003;278:17491–17499. doi: 10.1074/jbc.M210529200. [DOI] [PubMed] [Google Scholar]
- 25.Hamada T, McLean WH, Ramsay M, Ashton GH, et al. Hum Mol Genet. 2002;11:833–840. doi: 10.1093/hmg/11.7.833. [DOI] [PubMed] [Google Scholar]
- 26.Wang L, Yu J, Ni J, Xu XM, et al. Cancer Lett. 2003;200:57–67. doi: 10.1016/s0304-3835(03)00350-1. [DOI] [PubMed] [Google Scholar]
- 27.Perretti M, Gavins FN. News Physiol Sci. 2003;18:60–64. doi: 10.1152/nips.01424.2002. [DOI] [PubMed] [Google Scholar]
- 28.Roviezzo F, Getting SJ, Paul-Clark MJ, Yona S, et al. J Physiol Pharmacol. 2002;53:541–553. [PubMed] [Google Scholar]
- 29.Jiang D, Ying W, Lu Y, Wan J, et al. Proteomics. 2003;3:724–737. doi: 10.1002/pmic.200300411. [DOI] [PubMed] [Google Scholar]
- 30.Egeblad M, Werb Z. Nat Rev Cancer. 2002;2:161–174. doi: 10.1038/nrc745. [DOI] [PubMed] [Google Scholar]
- 31.Zhu Y, Spitz MR, Lei L, Mills GB, et al. Cancer Res. 2001;61:7825–7829. [PubMed] [Google Scholar]
- 32.Shin BK, Wang H, Yim AM, Le Naour F, et al. J Biol Chem. 2003;278:7607–7616. doi: 10.1074/jbc.M210455200. [DOI] [PubMed] [Google Scholar]
- 33.Hantschel M, Pfister K, Jordan A, Scholz R, et al. Cell Stress Chaperones. 2000;5:438–442. doi: 10.1379/1466-1268(2000)005<0438:hpmeop>2.0.co;2. [DOI] [PMC free article] [PubMed] [Google Scholar]
- 34.Triantafilou M, Triantafilou K. Trends Immunol. 2002;23:301–304. doi: 10.1016/s1471-4906(02)02233-0. [DOI] [PubMed] [Google Scholar]
- 35.Mehul B, Hughes RC. J Cell Sci. 1997;110:1169–1178. doi: 10.1242/jcs.110.10.1169. [DOI] [PubMed] [Google Scholar]
- 36.Mignatti P, Morimoto T, Rifkin DB. J Cell Physiol. 1992;151:81–93. doi: 10.1002/jcp.1041510113. [DOI] [PubMed] [Google Scholar]
- 37.Rubartelli A, Bajetto A, Allavena G, Wollman E, et al. J Biol Chem. 1992;267:24161–24164. [PubMed] [Google Scholar]
- 38.Hughes RC. Biochim Biophys Acta. 1999;1473:172–185. doi: 10.1016/s0304-4165(99)00177-4. [DOI] [PubMed] [Google Scholar]