Abstract
Gastrulation is a fundamental process in early development that results in the formation of three primary germ layers. During avian gastrulation, presumptive mesodermal cells in the dorsal epiblast ingress through a furrow called the primitive streak (PS), and subsequently move away from the PS and form adult tissues. The biophysical mechanisms driving mesodermal cell movements during gastrulation in amniotes, notably warm-blooded embryos, are not understood. Until now, a major challenge has been distinguishing local individual cell-autonomous (active) displacements from convective displacements caused by large-scale (bulk) morphogenetic tissue movements. To address this problem, we used multiscale, time-lapse microscopy and a particle image velocimetry method for computing tissue displacement fields. Immunolabeled fibronectin was used as an in situ marker for quantifying tissue displacements. By imaging fluorescently labeled mesodermal cells and surrounding extracellular matrix simultaneously, we were able to separate directly the active and passive components of cell displacement during gastrulation. Our results reveal the following: (i) Convective tissue motion contributes significantly to total cell displacement and must be subtracted to measure true cell-autonomous displacement; (ii) Cell-autonomous displacement decreases gradually after egression from the PS; and (iii) There is an increasing cranial-to-caudal (head-to-tail) cell-autonomous motility gradient, with caudal cells actively moving away from the PS faster than cranial cells. These studies show that, in some regions of the embryo, total mesodermal cell displacements are mostly due to convective tissue movements; thus, the data have profound implications for understanding cell guidance mechanisms and tissue morphogenesis in warm-blooded embryos.
Keywords: tissue dynamics, fibronectin, multi-scale, particle image velocimetry, time-lapse imaging
The extent to which bulk tissue movements convect cells and determine their eventual “position-fate” has received relatively little attention, although it is widely, if not explicitly, recognized that embryonic morphogenesis involves large-scale (macroscopic) tissue deformations (1–4), in addition to local cellular rearrangements. Indeed, current developmental biology dogma is that active (cell-autonomous) migration shapes the embryo. Therefore, to understand all of the mechanisms that regulate morphogenetic pattern formation, cell displacements, and cell fate, it is essential to quantify or “map” local cell-autonomous dynamics, in terms of speed and directionality of individual cells, as well as the global or bulk tissue movements driven or experienced by cell collectives (e.g., epithelia and cohesive mesenchymal arrays).
Gastrulation is a fundamental morphogenetic process that results in the formation of three primary germ layers. In warm-blooded embryos, presumptive mesodermal cells located in the dorsal epiblast layer move into a midline furrow (ingression) to form a continually renewing tissue structure known as the primitive streak (PS). Subsequently, the cells move away from the streak (egression) to form axial tissue rudiments. Gastrulation is a multiscale problem, involving motions and deformations that are correlated at both tissue- and cell-level length and time scales. One of the most challenging problems in studying the dynamics of cell displacements during gastrulation is separating local (individual) cell-autonomous motility from large-scale (convective) tissue-level morphogenetic displacements (5, 6), which added together account for total mesodermal cell displacement (operational definitions for these terms are given in Materials and Methods).
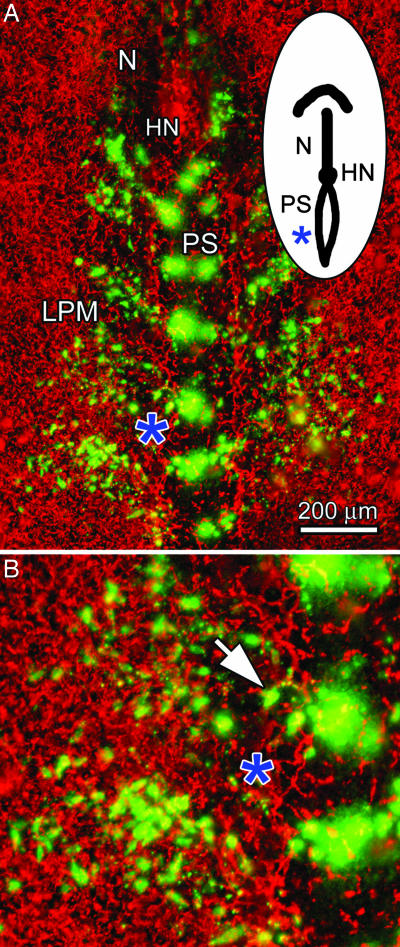
To address this problem, we conducted tissue position-fate mapping based on particle image velocimetry (PIV), a well established computational tool for measuring velocity fields in continuous media (5, 7). The analysis was made possible by the advent of a unique wide-field, time-lapse microscopy setup for imaging the entire avian embryo with cellular resolution (8). This integrative bioengineering approach enables automatic calculation of tissue displacement fields in the embryo. To do so, immunofluorescent extracellular matrix (ECM) constituents are used as passive in situ markers for quantifying convective tissue displacements. Here, we separate directly local cell-autonomous displacements from bulk morphogenetic processes. We accomplish this by tracking individual fluorescent mesodermal cells against the background (reference frame) of the surrounding ECM (Fig. 1). These data profoundly alter our understanding of gastrulation, in particular, and more generally, emphasize the need for quantitative multiscale analyses and biophysical modeling of tissue morphogenesis.
Fig. 1.
A gastrulation-stage (HH6) embryo after 4 h of incubation. (A) Dye-labeled mesodermal cells (green) and fluorescently conjugated B3D6-labeled FN (red) are shown. (B) Magnified view of the embryo shown in A (asterisk denotes identical position in both panels); the arrow points to a cell emerging from one of the dye injection sites in the primitive streak (PS). SI Movie 2 shows a composite (cells+FN) time-lapse sequence of an embryo labeled in this way. N, notochord; LPM, lateral plate mesoderm; HN, Hensen's node.
Results
Computational Tissue Position-Fate Mapping.
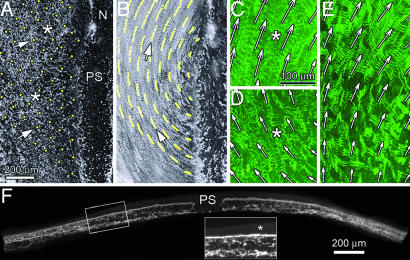
Fibronectin (FN) was used as a passive in situ marker for quantifying morphogenesis-driven mesodermal tissue deformations. To construct tissue position-fate maps, we performed PIV on the monoclonal antibody-labeled FN image sequences for each embryo. As explained in Materials and Methods, PIV provided a time-varying incremental tissue displacement field (Fig. 2C–E). Embryos were seeded with virtual material particles (Fig. 2A), and the trajectories of these particles were then automatically determined by evaluating the incremental displacement field and updating particle positions at each time point (Fig. 2B).
Fig. 2.
A PIV-determined tissue position-fate map for one side of a stage 5 embryo. (A) The embryo is “seeded” with virtual material particles (yellow dots). (B) Shown here are the trajectories of the particles over the first 10 time points (≈50 min). The arrows in A denote two specific particles and their trajectories (B). (C and D) Magnified regions of the embryo that have been projected over three time points to indicate the bulk motion. (E) A region of the same embryo near Hensen's node at a later time (5 h). Overlaid arrows represent the (normalized) displacement field, and the spacing of arrows (64 pixels) corresponds to the width of a refined subwindow. Note especially the bulk movement of extended fibrils, which in some cases exceeds 100 μm. Scale bars for C–E are the same. SI Movie 1 shows the full time-lapse sequence. (F) A transverse cross-section of an embryo labeled with microinjected FN label. The presence of label is detected throughout the thickness of the mesoderm tissue. The PS and ectodermal layer (asterisk in Inset) show only faint levels of background fluorescence. Scale bar in F is for the main image.
Here, we present the results for a single embryo (n > 10 total) that was observed to be typical of the general pattern of tissue motion (Fig. 2 A–E). The representative embryo was imaged beginning at approximately Hamburger–Hamilton (HH) stage 5 for 6 h, during which time the first four somites formed. A complete time-lapse movie of the embryo with the overlaid virtual particles is provided as supporting information (SI) Movie 1. Together, these data illustrate several important kinematic phenomena. First, it is evident that tissue displacements, in general, are large relative to the size of single cells, even when compared with the overall dimensions of the embryo. Second, tissue displacements grow increasingly larger in an anterolateral direction from any starting position along the length of the PS (future vertebral axis). Third, although the axial (y-axis) component of tissue motion is almost exclusively directed toward the cranial end of the embryo, the mediolateral (x-axis) component of motion near the PS is directed primarily outward; but then turns back toward the PS at positions more distant from the midline. This change in direction indicates a significant amount of tissue rotation. It is important to note the highly organized pattern of motion of the virtual particles. In general, closely neighboring particle trajectories do not intersect or deviate substantially. The overall displacement field for the virtual particles is smoothly varying and continuous, indicating the continuity of the FN network, and hence, the mesoderm itself (Fig. 2B). Furthermore, although FN is located throughout the thickness of the embryo at these stages (Fig. 2F), we did not observe significant differences in FN displacements locally (Fig. 2 C–E), signifying that FN-containing ECM moves as a single (composite) biomaterial during these stages. Finally, we can conclude that our 2D analysis does not introduce artifacts that could be due to differences in FN motion along the dorsal–ventral axis (e.g., tissue shear).
Total Versus Cell-Autonomous Mesodermal Cell Speed.
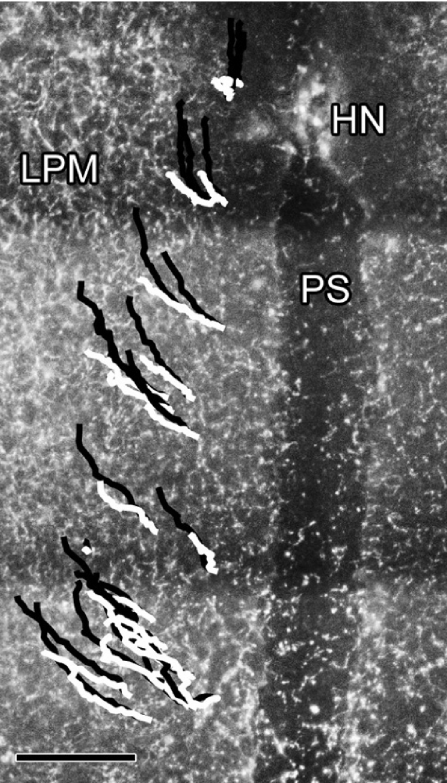
HH stage 4 or 5 embryos were labeled by microinjecting fluorescently conjugated FN-mAb and lipophilic dyes (DiI or variants) to tag mesodermal cells. To minimize the potentially harmful effects of prolonged light exposure, specimens were imaged for single 2-h intervals during an experiment, beginning at t = 0, 2, or 4 h after the start of incubation. Image capture rates varied from 12–20 frames per hour (fph, 3- to 5-min intervals). Image sets were processed and the apparent (total) displacements of labeled cells were manually determined (Fig. 3). PIV analysis was performed on FN-labeled image sequences to obtain an incremental tissue displacement field. The PIV-derived tissue displacement data were then subtracted from the total cell displacements, thereby producing corrected local cell-autonomous displacements (Fig. 3).
Fig. 3.
Shown are total (black) and cell-autonomous (white) cell trajectories over a 2-h time period on one side of an embryo. The trajectories are overlaid on an immunofluorescent FN image frame captured at t = 0. HN, Hensen's node; LPM, lateral plate mesoderm; PS, primitive streak. (Scale bar, 150 μm.) SI Movies 3 and 4 are high-resolution time-lapse sequences showing cells (green) migrating on the background of FN label (red).
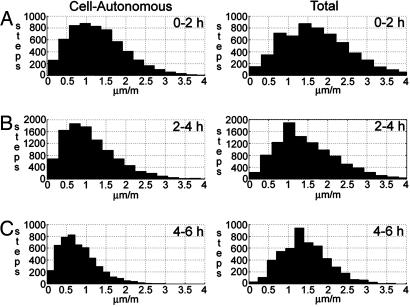
We first compared the distributions of cell-autonomous and total cell speed, defined here to be the magnitude of the incremental velocity vector, s = |Δv|, for each of the time periods studied (Fig. 4). A step (data point) was defined as the speed at which a particular cell moved from its position in one frame to some new position in the next frame. Both the mean cell-autonomous speed (s0–2hca = 1.30 > s2–4hca = 1.11 > s4–6hca = 0.82) and total speed (s0–2ht = 1.74 > s2–4ht = 1.49 > s4–6ht = 1.42) decrease significantly over time. Whereas the mean cell-autonomous speed decreases at a consistent rate, the mean total speed decreases more sharply in the initial time period. Note that the total cell speed overestimates the cell-autonomous speed by 25%, 34%, and 73%, respectively, for the three time intervals studied. Each comparison, time versus time and total versus cell-autonomous speed, was found to be significantly different (P < 0.05).
Fig. 4.
Distributions for cell-autonomous (Left) and total (Right) cell speed, after leaving the PS, for each of three time periods (0–2 h in A, 2–4 h in B, and 4–6 h in C). A step (data point) represents the movement of a single cell between two consecutive frames of a time-lapse sequence. Note that speed, the magnitude of the velocity vector, is always a positive measurement.
We also calculated a time-averaged rate of change of speed or acceleration, ṡ, defined as the slope of the (linear) least-squares fit to the speed data as a function of time for each cell (ṡ < 0 for cells slowing down over time, and ṡ > 0 for cells that move faster with time). The mean values for ṡca (μm/min/h ± SD) during each time interval were found to be negative: −0.23 ± 0.76 (t = 0–2 h); −0.25 ± 0.39 (t = 2–4 h); −0.16 ± 0.22 (t = 4–6 h). A sharp decrease in the standard deviation for each group is indicative of a uniform global decrease in cell-autonomous motility.
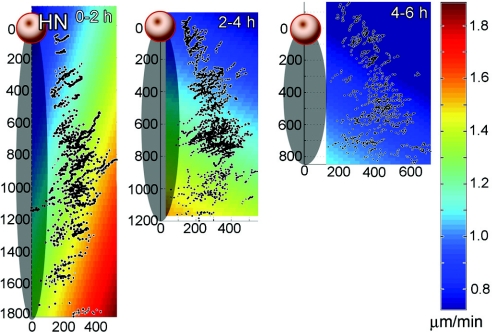
To understand further the dependence of mesodermal cell motility on time and position after exiting the PS, we created spatial “maps” for visualizing these data (Fig. 5). First, we determined the x,y-coordinates for the anterior-most extent of anatomical position along the PS, called O (approximately the location of Hensen's node). This anatomical landmark was defined to be the origin of a new coordinate system. Cell coordinates x were transformed to this new coordinate system by simple vector subtraction, x̄ = x − O, where x̄ are the transformed cell coordinates. Therefore, in the transformed coordinate system, O = (0, 0), and all cells maintain their position vectors with respect to O. Defining this relative nodal-centric coordinate system enabled data from different embryos, and both left and right sides of each embryo, to be pooled.
Fig. 5.
Spatial cell-autonomous speed maps for each of the 2-h time intervals studied. Each dot represents the position of a cell at a single time point for each speed measurement. A coordinate transformation was performed to make cell coordinates relative to Hensen's node (HN) for each embryo, and data from the left and right sides of embryos were combined. For reference, a schematic drawing of the node and PS is shown to the left of each map. Although no specific measurements were made, the observed shortening and widening of the PS over time is illustrated. Each map uses the same scale bar (right).
To create the maps shown in Fig. 5, a linear least-squares function was fit to the cell-autonomous speed data sca for all of the labeled cells tracked during each 2-h interval; thus, giving the best approximation for the mean cell-autonomous speed data as a function of nodal-centric embryo position. These maps clearly show an overall decrease in speed everywhere in the embryo over the three time periods studied, confirming the histogram data. Additionally, there is an increasing cranial to caudal (y-axis) gradient of cell speed. Cells that emanate from more caudal (posterior) positions in the PS move faster than cells closer to the node (more anterior).
Directionality of Mesodermal Cell-Autonomous Motility.
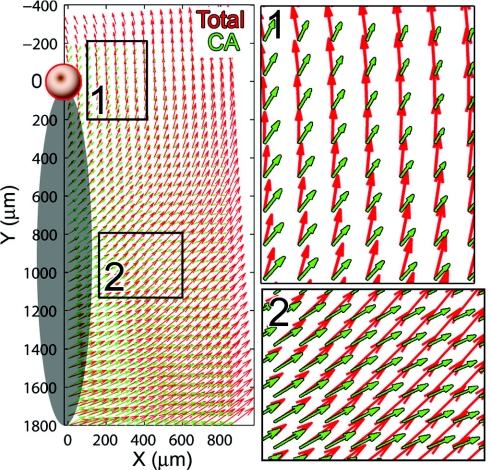
To examine the directional component of cell motility, we assume there exists some (continuous and smoothly varying) mean velocity field v̄ that determines the trajectories of cells egressing from the PS, and further assume that v̄ does not change significantly during the total time period. It is also assumed that the trajectories prescribed by v̄ do not overlap (i.e., cell paths do not cross each other). Given these assumptions, the position of a cell at any time is dictated by v̄ alone, and time can be ignored. Similarly, v̄ can be calculated by using the incremental velocity data Δv as a function of position alone. Therefore, we combined the data for all three cell-tracking periods, and fitted linear least-squares spline functions to the x and y components of the total and cell-autonomous velocity vectors, respectively, Δvt and Δvca. These functions were then used to construct the mean velocity field map, which can be thought of as an “ensemble” average (Fig. 6). In this map, cell speed is proportional to the (relative) lengths of the vectors (arrows), and the orientation of the vectors represents the direction that cells are moving at a particular location. Note the differences in both magnitude and direction as a function of position relative to the node and PS, as well as between the total and cell-autonomous velocity fields.
Fig. 6.
An ensemble spatial cell velocity map illustrates the dependence of cell-autonomous (CA, green) and total (red) cell speed and directionality on position relative to Hensen's node. Insets show magnified views of the velocity field: near Hensen's node (1) and lateral to the PS (2). For reference, a schematic of the PS is drawn along the y axis. Note that vector length is proportional to cell-autonomous speed, so longer arrows indicate areas of greater cell speed.
Discussion
Our data show that morphogenetic tissue motion plays a significant role in determining overall mesodermal cell (and tissue) patterning or position-fate during avian gastrulation. First, it cannot be assumed a priori that directed cell displacements occur in a static environment. Indeed, to a first approximation, mesenchymal cells not moving relative to the surrounding ECM are not moving at all. Second, mesodermal cells slow down as they move away from the PS, suggesting that there is a gradual transition from a motile state to the formation of a cohesive mesenchymal sheet. Third, there is a gradient in cell-autonomous motility along the embryonic axis (head-to-tail), with caudal cells moving faster than cells near Hensen's node. Fourth, the axial component of cell-autonomous motility at every position is directed toward the cranial (anterior) end of the embryo, whereas the mediolateral component of motility is directed outward from the PS at all locations.
Dynamic (time-lapse) imaging alone is not sufficient to distinguish between convective and local cell-autonomous mesodermal displacements (SI Movies 2–4) because the cells appear to be highly active (e.g., protrusive) even in the absence of directed (persistent) motility. In other words, apparent motility is not due to active cellular displacement alone. That fundamental statement may seem axiomatic, but it is apparent from the literature that, until now, individual cell-autonomous displacements versus bulk tissue movements have not been systematically distinguished; furthermore, large-scale ECM dynamics have not been considered as an indication of the extent of global tissue motion. Thus, to derive meaningful cell-autonomous motility data in intact organisms, convective tissue displacements must be subtracted, just as subcellular particle dynamics are considered relative to cell displacements in vitro (9).
We are not the only group that has recognized this problem or the need for a solution. For example, Sepich et al. (6) tracked the motion of gastrulating mesodermal cells in zebrafish, as well as cells in the ectoderm, and assumed that some (arbitrary) percentage of shared motion between different layers represented passive cell convection. Their approach to separating active cell displacements from the “background” motion of tissue morphogenesis is inherently limited because the analysis had no fixed frame of reference (“ground”) for relating the total cell motion.
Our time-lapse data demonstrate that ECM molecules serve as ideal in situ markers for measuring tissue dynamics, and as a natural frame of reference for measuring “true” cell-autonomous displacements, because the ECM motion is both continuous and passive. We determined that similar large-scale movements of different ECM molecules are due to the continuum nature of the tissue in our recent study comparing FN and fibrillin-2 dynamics in slightly older embryos (10). Here, we have verified that, for earlier gastrulation-stage embryos, the FN-derived displacement field is both smoothly varying and continuous (Fig. 2 B–E and SI Movie 1), and that the FN-label is essentially confined to the mesodermal layer through which cells are migrating (Fig. 2F). We emphasize that, although FN was used as a representative marker for measuring tissue displacements in our study, there is no reason to believe it is unique in this regard (10).
Others have realized the importance of investigating the relationship between ECM patterning and cell displacements during morphogenesis. For example, Davidson et al. (11) performed 3D confocal reconstructions in early frog embryos at progressively older stages to demonstrate the regulated assembly and remodeling of FN fibrils at tissue boundaries, including the somitic mesoderm–endoderm boundary. The authors speculate that FN fibrils in these locations have multiple functions, including integrating cell traction into physical forces that drive tissue movements.
Our computational approach enables “true” local cell-autonomous speed and directionality to be unambiguously identified and quantified in a warm-blooded embryo. Our data show that the velocity contribution of large-scale (morphogenetic) tissue movements to the total spatiotemporal trajectories (paths) of cells actually increases with greater distance from the PS, thus causing striking overestimation of cell-autonomous speed (Fig. 4) and errors in determining the directionality of active (individual) cell-autonomous displacements (Fig. 6). We determined that, during avian gastrulation, the cell-autonomous speed begins to decrease as soon as cells leave the PS. Furthermore, the evidence supports the idea that cells slow down en masse, resulting in a gradual leftward shift of the histogram over time (Fig. 4). In other words, there is no change in the distribution from unimodal to bimodal; a shift that would be expected if a specific cell population stopped suddenly while the remaining cells continued moving at a constant rate. In addition, our data show that cells egressing from the PS in the caudal embryo have greater cell-autonomous speed than cells leaving the streak at more cranial levels. These data have important implications, because at some developmental stage, mesenchymal cells begin to form more cohesive tissues, and the relative movements between individual cells decreases (i.e., cells maintain their neighboring positions). Exactly how, when, and where embryonic cells make this transition is unknown. Thus, accurate measurement of cell-autonomous speed is necessary to understand how tissue building occurs in the embryo.
An important ramification of our data is that large-scale tissue rearrangements must be taken into account when analyzing cell-autonomous motility in the presence of chemical gradients. Several morphogenetic processes are driven by continuous (gastrulation, vasculogenesis) or periodic (segmentation) (12, 13) cranial-to-caudal waves that are thought to be primarily regulated by specific morphogen or chemotactic gradients. The question arises: what is the nature of a gradient that is, itself, in motion? With the rapid progress of computational time-lapse microscopy techniques, it may be possible to understand how such gradients are affected by ECM displacements during embryogenesis.
Empirical data such as those described here are important for constructing realistic models of cell movements during gastrulation. Current models of gastrulation in amniotes virtually ignore large-scale (tissue-level) ECM dynamics, and to our knowledge, none explain how mesodermal cell migration alone produces the tissue deformations we have shown. Any valid model of gastrulation in warm-blooded embryos, whether invoking chemotaxis, haptotaxis, mechanotaxis, or other mechanisms, must be able to account for both the individual cell-autonomous movements and bulk tissue motion data. To understand all of the forces that drive morphogenesis and shape the embryo, we will need mathematical or computational models that integrate these phenomena at multiple length and time scales, from the cellular to the tissue level. We propose that, during morphogenesis, particularly gastrulation, the prevailing tissue biomechanical properties play a key role in the eventual positioning and spatiotemporal arrangement of large-scale cellular ensembles. Moreover, we suggest that, in addition to the quantitative image analysis techniques presented here, direct mechanical tissue testing will be needed for both construction and verification of these models.
It is our belief that quantitative data are essential for understanding changes in tissue composition during morphogenesis. Our work shows that morphogenetic processes across widely varying length scales must be considered in relation to each other, and not in isolation, because tissue properties depend on spatial as well as temporal variation. For example, in some regions of the embryo, cells adhere to each other and the ECM scaffold very tightly, whereas in other regions, cells appear to move freely relative to other cells and their surrounding matrix. Although we have focused primarily on early embryonic morphogenesis, our method for quantifying (local) individual cell movements with respect to ongoing tissue movements should be readily adaptable for general use, and will be an important tool for studying a wide variety of developmental processes, including neural crest cell migration, somitogenesis, and limb bud formation.
Materials and Methods
Quail Embryo Preparation.
Quail embryos (Coturnix coturnix japonica, Ozark Egg Co., Stover, MO) were incubated for ≈24 h at 37°C in a humidified chamber to reach HH stages 4–5 (14). Embryos were then dissected from the egg, mounted on filter paper rings, and placed ventral side up on 35-mm agar plates for subsequent microinjection (15). During a time-lapse experiment, embryos were cultured ventral side up on a semisolid mixture of agar/albumen (egg whites), modified after the method of New (16, 17), and incubated in a custom-built temperature- and humidity-controlled chamber mounted on a microscope stage (8).
Fluorescent Labeling of Mesodermal Cells and FN.
A monoclonal antibody to avian FN, B3D6 (18, 19) (Developmental Studies Hybridoma Bank, University of Iowa, Iowa City), was directly conjugated with Alexa-488 or Alexa-555 (Molecular Probes, Eugene, OR), and microinjected into the lateral plate mesoderm ≈1 h before the start of a time-lapse experiment. This allows for diffusion and binding to antigen (Fig. 1 and SI Movie 1).
Vybrant DiI, or its variants DiO and DiD (Molecular Probes), which are lipophilic cell-labeling dyes with maximum emission wavelengths of λmax = 565, 501, and 665 nm, respectively, were prepared as 5 μM solutions with PBS immediately before the beginning of an experiment. Subsequently, the dye was microinjected at multiple positions along each side of the PS. The dye remained localized, and the injection sites became the sources of relatively narrow cell “streams” (Fig. 1 and SI Movie 2). All microinjections were performed as described (16). Confocal microscopy was used to confirm that dye-labeled cells were located in the same tissue layer as labeled FN (data not shown). Our findings were similar to those reported in ref. 20. To examine the dorsal–ventral distribution of FN, we microinjected embryos with FN-mAb and then prepared thick plastic sections (≈30 μm) transverse to the midline of the embryo (Fig. 2F).
Digital Wide-Field Time-Lapse Microscopy.
The details of our digital time-lapse microscopy system have been fully described (8, 21). Briefly, a computer-controlled wide-field (×10 objective) epifluorescent microscope (Leica DMR) workstation, equipped with motorized stage and cooled digital camera (QImaging Retiga 1300), was used to acquire 12-bit grayscale intensity images (512 × 634 pixels) at multiple x–y locations (tiles) and focal planes (z stacks). Both bright-field and fluorescent images were acquired by using multiple fluorochromes. For one embryo, nfnzni images are captured during a single time-point (frame), where nf is the number of fields (usually 6–10), nz is the number of focal planes (7–13), and ni is the number of illumination modes. In this study, the minimum image acquisition rate used was 12 frames/h (5 min between frames). Image processing, including focal plane “collapsing,” field merging, and registering, was performed to create high-resolution whole-embryo 2D time-lapse sequences for use in cell tracking and PIV. See ref. 8 for details. To correct for gradual drift in embryo position or sudden changes due to repositioning of the stage, images were registered to Hensen's node, which served as a convenient anatomical landmark.
Calculation of Tissue Motion.
PIV was used to determine bulk tissue motion. Complete details of the implementation and validation of the PIV method in early avian embryos have been reported (5). Here, we used mAb-labeled FN as a passive in situ marker for imaging and quantifying tissue deformations. Briefly, the commercially available mathematical programming language MATLAB (Mathworks, Natick, MA) was used to implement the PIV algorithm. Given a pair of sequential images, we desire a maximum-likelihood estimate (MLE) for the incremental displacement field ∂u. To determine ∂u, we used a two-step linear predictor-corrector approach (7, 22). First, a coarse or predictor displacement field ∂u* was found by using normalized cross-correlation operating on equally spaced overlapping square blocks of pixels (subwindows). In the subsequent corrector step, the coarse displacement predictions were used to offset the subwindows by an integer pixel amount, and the cross-correlation procedure was repeated. In this iteration, however, the subwindow size was reduced by a factor of two, and the search radius was reduced to a size on the order of the error made by the predictor approximation, typically r = 4 pixels. A thin-plate spline approximation was used to obtain a smoothly varying and continuous displacement field ∂u, which could then be numerically evaluated at any arbitrary location in each time-lapse frame.
To construct tissue position-fate maps, embryos were “seeded” with virtual tissue particles (material points) at some initial time or reference configuration R0 (Fig. 2A), taken to be the first image of a time-lapse sequence. The spatial trajectories for each virtual particle in R0 were then constructed by evaluating the incremental displacement field ∂u at each successive time-point and updating the particle positions.
Calculation of Cell Velocities.
Let X = X(t) be the absolute or apparent position vector (in x,y-coordinates relative to the upper left-hand corner of each image) for an arbitrary cell at time t. These coordinates were determined manually by clicking the visually estimated center of a cell using the ImageJ (http://rsb.info.nih.gov/ij/) “point” tool, and then recording the results to an external data file. To reduce pixel roundoff errors, images were first magnified (×2) by using TransformJ (23), a quintic spline resizing tool available as an ImageJ plugin (www.imagescience.org/meijering/software/transformj). Cell trajectory data were imported into MATLAB, which was used for all subsequent calculations and analysis.
Incremental cell-autonomous displacement Δuca(t) was determined by the following equation
where Δut(t) = X(t) − X(t − 1) is the total (apparent) incremental displacement, and Δup(X, t) = ∂u(X, t) is the passive (convective) displacement due to bulk tissue motion, which is simply the PIV-determined displacement field evaluated at the current cell position (in absolute coordinates). Incremental cell-autonomous velocity is then given by Δvca = Δuca/Δt, where Δt is the corresponding amount of elapsed time.
Cell tracking was performed on images that were collapsed (“z projected”) to two dimensions. Therefore, no data for the vertical positions of cells were recorded. We did not perform 3D cell tracking for two reasons: First, vertical resolution (z-axis) in our setup is at least an order of magnitude lower than horizontal resolution, due to technical details, such as the relatively large depth of focus of the ×10 objective. Second, at present, our PIV analysis is a strictly 2D technique. Regardless, because lateral cell displacement is so much greater than vertical (dorsal–ventral) displacement, this limitation most likely has no significant effect on the results.
Statistics.
To test for differences between cell speed distributions, a two-sample Kolmogorov–Smirnov test (MATLAB Statistics Toolbox) was performed, with significance defined as P < 0.05.
Nomenclature and Definitions.
For the sake of clarity in the present communication, here we present some specific operational definitions.
Cell-autonomous motility.
Cell-autonomous motility refers exclusively to the active displacement or translocation of individual cells with respect to the local extracellular matrix surroundings, and in no way is used to characterize cell morphological structures often associated with studies of motile behavior (e.g., filopodia, lamellipodia).
Tissue displacement.
Tissue displacement refers primarily to the translocation of virtual material particles or the incremental displacement field as determined by the PIV motion analysis on FN-immunolabeled images.
Total cell displacement.
Total cell displacement refers to the vector sum of individual cell-autonomous displacement and local tissue displacement calculated over an arbitrary time period.
Acknowledgments
We thank Elizabeth Petroske for assistance with confocal microscopy at the University of Kansas Medical Center core facility (www.kumc.edu/cic), which is supported by National Institutes of Health Shared Resource Grant (National Center for Research Resources RR14637-01) and the Kansas Biomedical Research Infrastructure Network; Barbara Fegley in the Electron Microscopy Research laboratory; and the anonymous reviewers for their insightful suggestions, which greatly improved the manuscript. This work was supported by National Institutes of Health Grants R01 HL73700 and P20 RR016475 from the IDeA Networks of Biomedical Research Excellence Program, National Center for Research Resources (to B.J.R.), and R01 HL6855 (to C.D.L.), American Heart Association Heartland Affiliate Postdoctoral Fellowships (to E.A.Z. and C.C.), Hungarian Research Fund OTKA T047055 and American Heart Association Scientist Development Grant 0535245N (to A.C.), and the G. Harold and Leila Y. Mathers Charitable Foundation (B.J.R., C.D.L., and A.C.).
Abbreviations
- PS
primitive streak
- PIV
particle image velocimetry
- ECM
extracellular matrix
- FN
fibronectin
- HH
Hamburger–Hamilton.
Footnotes
The authors declare no conflict of interest.
This article is a PNAS direct submission.
This article contains supporting information online at www.pnas.org/cgi/content/full/0606100103/DC1.
References
- 1.Keller R. Curr Opin Cell Biol. 2005;17:533–541. doi: 10.1016/j.ceb.2005.08.006. [DOI] [PubMed] [Google Scholar]
- 2.Czirók A, Rongish BJ, Little CD. Dev Biol. 2004;268:111–122. doi: 10.1016/j.ydbio.2003.09.040. [DOI] [PubMed] [Google Scholar]
- 3.Keller R, Davidson LA, Shook DR. Differentiation. 2003;71:171–205. doi: 10.1046/j.1432-0436.2003.710301.x. [DOI] [PubMed] [Google Scholar]
- 4.Trinkaus JP. Cells into Organs: The Forces that Shape the Embryo. 2nd Ed. Englewood Cliffs, NJ: Prentice–Hall; 1984. [Google Scholar]
- 5.Zamir EA, Czirók A, Rongish BJ, Little CD. Ann Biomed Eng. 2005;33:854–865. doi: 10.1007/s10439-005-3037-7. [DOI] [PubMed] [Google Scholar]
- 6.Sepich DS, Calmelet C, Kiskowski M, Solnica-Krezel L. Dev Dyn. 2005;234:279–292. doi: 10.1002/dvdy.20507. [DOI] [PubMed] [Google Scholar]
- 7.Raffel M, Willert C, Kompenhans J. Particle Image Velocimetry. Berlin: Springer; 1998. [Google Scholar]
- 8.Czirók A, Rupp PA, Rongish BJ, Little CD. J Microsc. 2002;206:209–217. doi: 10.1046/j.1365-2818.2002.01032.x. [DOI] [PubMed] [Google Scholar]
- 9.Gerlich G, Mattes J, Eils R. Methods. 2003;29:3–13. doi: 10.1016/s1046-2023(02)00287-6. [DOI] [PubMed] [Google Scholar]
- 10.Czirók A, Zamir EA, Filla MB, Little CD, Rongish BJ. Curr Top Dev Biol. 2006;73:233–254. doi: 10.1016/S0070-2153(05)73008-8. [DOI] [PubMed] [Google Scholar]
- 11.Davidson LA, Keller R, DeSimone DW. Dev Dyn. 2004;231:888–895. doi: 10.1002/dvdy.20217. [DOI] [PubMed] [Google Scholar]
- 12.Pourquie O. J Anat. 2001;199:169–175. doi: 10.1046/j.1469-7580.2001.19910169.x. [DOI] [PMC free article] [PubMed] [Google Scholar]
- 13.Gordon R, Bjorklund NK, Nieuwkoop PD. Dialogue on Embryonic Induction and Differentiation Waves. New York: Academic; 1994. pp. 373–420. [DOI] [PubMed] [Google Scholar]
- 14.Hamburger V, Hamilton HL. J Morphol. 1951;88:49–92. [PubMed] [Google Scholar]
- 15.Drake CJ, Davis LA, Little CD. Dev Dyn. 1992;193:83–91. doi: 10.1002/aja.1001930111. [DOI] [PubMed] [Google Scholar]
- 16.Little CD, Drake CJ. Methods Mol Biol. 2000;135:183–189. doi: 10.1385/1-59259-685-1:183. [DOI] [PubMed] [Google Scholar]
- 17.New DAT. J Embryol Exp Morphol. 1955;3:320–331. [Google Scholar]
- 18.Gardner JM, Fambrough DM. J Cell Biol. 1983;96:474–485. doi: 10.1083/jcb.96.2.474. [DOI] [PMC free article] [PubMed] [Google Scholar]
- 19.Wiens DJ. J Theor Biol. 1996;179:33–39. doi: 10.1006/jtbi.1996.0045. [DOI] [PubMed] [Google Scholar]
- 20.Sanders EJ, Hu N, Prasad S. Int J Dev Biol. 1994;38:701–707. [PubMed] [Google Scholar]
- 21.Rupp PA, Rongish BJ, Czirók A, Little CD. BioTechniques. 2003;34:274–278. doi: 10.2144/03342st01. [DOI] [PubMed] [Google Scholar]
- 22.Scarano F. Meas Sci Technol. 2002;13:1–19. [Google Scholar]
- 23.Meijering EH, Wiro JN, Viergever MA. Medical Image Analysis. 2001;5:111–126. doi: 10.1016/s1361-8415(00)00040-2. [DOI] [PubMed] [Google Scholar]


