

Abstract
Seeing a speaker’s facial articulatory gestures powerfully affects speech perception, helping us overcome noisy acoustical environments. One particularly dramatic illustration of visual influences on speech perception is the “McGurk illusion”, where dubbing an auditory phoneme onto video of an incongruent articulatory movement can often lead to illusory auditory percepts. This illusion is so strong that even in the absence of any real change in auditory stimulation, it activates the automatic auditory change-detection system, as indexed by the mismatch negativity (MMN) component of the auditory event-related potential (ERP). We investigated the putative left hemispheric dominance of McGurk-MMN using high-density ERPs in an oddball paradigm. Topographic mapping of the initial McGurk-MMN response showed a highly lateralized left hemisphere distribution, beginning at 175 ms. Subsequently, scalp activity was also observed over bilateral fronto-central scalp with a maximal amplitude at ~290 ms, suggesting later recruitment of right temporal cortices. Strong left hemisphere dominance was again observed during the last phase of the McGurk-MMN waveform (350–400 ms). Source analysis indicated bilateral sources in the temporal lobe just posterior to primary auditory cortex. While a single source in the right superior temporal gyrus (STG) accounted for the right hemisphere activity, two separate sources were required, one in the left transverse gyrus and the other in STG, to account for left hemisphere activity. These findings support the notion that visually driven multisensory illusory phonetic percepts produce an auditory-MMN cortical response and that left hemisphere temporal cortex plays a crucial role in this process.
Keywords: Multisensory integration, McGurk illusion, Mismatch negativity, Topography, Preattentive, Audio-visual speech
1. Introduction
The mismatch negativity (MMN) is a well-known electrophysiological component reflecting preattentive detection of an infrequently presented auditory stimulus (‘deviant’) differing from a frequently occurring stimulus (‘standard’) (Näätänen & Alho, 1995; Ritter, Deacon, Gomes, Javitt, & Vaughan, 1995). Generation of the MMN is believed to reflect the cortical processes involved in comparing current auditory input with a transient memory trace (lasting ~10–20 s) of ongoing regularities in the auditory environment; when there is a perceptible change, there is an MMN response (Näätänen, 2001). As such, the MMN serves as an index of auditory sensory (echoic) memory and constitutes the only available electrophysiological signature of auditory discrimination abilities (Picton, Alain, Otten, Ritter, & Achim, 2000). Changes along several physical dimensions such as duration, intensity, or frequency of sounds can generate the MMN, including changes in spectrally complex stimuli like phonemes (Näätänen et al., 1997). Source analysis of magnetic (Hari et al., 1984; Sams et al., 1985) and electrical scalp-recordings (e.g. Giard, Perrin, Pernier, & Bouchet, 1990; Scherg & Berg, 1991) as well as intracranial recordings in animals (e.g. Csèpe, Karmos, & Molnar, 1987; Javitt, Steinschneider, Schroeder, Vaughan, & Arezzo, 1994) and humans (e.g. Rosburg et al., 2005) have shown that the principal neuronal generators of MMN are located on the supratemporal plane in auditory cortex, although additional regions including frontal and parietal cortices are also likely associated with MMN processing (Marco-Pallares, Grau, & Ruffini, 2005; Molholm, Martinez, Ritter, Javitt, & Foxe, 2005).
Although the MMN is typically elicited by physical changes in the regularity of acoustical signals and attention is not required for its generation, evidence suggests that MMN is associated with purely subjective changes in auditory percepts in the absence of any actual acoustical variation. This was first reported by Sams et al. (1991) using the so-called McGurk illusion, a remarkable multisensory illusion whereby dubbing a phoneme onto an incongruent visual articulatory speech movement can lead to profound illusory auditory perceptions (McGurk & MacDonald, 1976). Depending upon the particular combination of acoustic phoneme and visual speech articulation used to evoke the McGurk illusion, the resultant percept will tend to be a fusion of the mismatched auditory and visual speech inputs (e.g. auditory /ba/ dubbed onto visual /ga/ results in the percept of /da/) or will be dominated by the visual speech input (e.g. auditory /ba/ dubbed onto visual /va/ results in the percept of /va/). Even when initially naïve subjects are fully apprised of the nature of the illusion, the illusion is so dominant that subjects continue to report hearing the illusory speech percept rather than the presented auditory speech sound. Sams and colleagues showed that infrequent deviations in the visual articulation of audio–visual syllables (acoustic /pa/ and visual /ka/) interspersed in a sequence of congruent trials (acoustic /pa/ and visual /pa/) gave rise to magnetic mismatch fields in the supratemporal region (see also Möttönen, Krause, Tiippana, & Sams, 2002 for similar results). This MMN-like response associated with the McGurk effect was also found in scalp-recorded ERPs with maximal amplitude between 200 and 300 ms after auditory onset (Colin et al., 2002; Colin, Radeau, Soquet, & Deltenre, 2004).
The present study aimed to further characterize the McGurk-MMN, using high-density electrical mapping and source-analysis to investigate the underlying cortical sources of this activity. In previous studies, the McGurk-MMN has been investigated by comparing the magnetic or electrical responses evoked by the standard and the deviant audio–visual speech stimuli. Problematically, this comparison will yield not only any potential McGurk-MMN effect, but also any differential responses due to the physically different visual stimuli used to make up the standards and deviants. In the present study we ran additional conditions where only the visual stimuli were presented so that we could (1) subtract out the evoked visual responses from the auditory–visual responses from which the McGurk-MMN was derived; (2) characterize the visual activity to the visual-alone stimuli to assess the extent to which they do contribute to activity in the latency range of the auditory response. Controlling for effects due to physical differences in the visual stimuli, we find clear evidence for a McGurk-MMN. That is, perceived phonemic changes in the absence of actual acoustic changes elicited the MMN (Colin et al., 2002, 2004). In addition, topographic mapping and dipole modeling revealed a dominance of left hemispheric cortical generators during the early and late phases of the McGurk-MMN, consistent with the well-known left hemispheric dominance for the processing of speech.
2. Methods
2.1. Participants
Eleven adult volunteers (ages: 19–33 years; mean: 25.6; five males) participated in the experiment and were naive with regard to the intent of the study. After the study, all subjects were debriefed to ensure that they experienced strong McGurk illusions.1 The participants reported that they had no hearing or neurological deficits. They possessed normal or corrected-to-normal vision and were right-handed (except for one) as assessed by the Edinburgh handedness inventory. All subjects provided written informed consent in accordance with the Declaration of Helsinki, and the Institutional Review Board of the Nathan Kline Research Institute approved all procedures.
2.2. Stimuli and procedure
Stimuli were generated by digitally recording video (frame rate: 25 images/s; audio sample rate: 44.1 KHz in 16 bits) of the natural articulations of a male English speaker’s mouth saying the syllables /ba/ and /va/. Although the visual information for both syllables is different in terms of place of articulation, the duration of mouth movement was similar for both stimuli with respect to the onset of the acoustical signal. There was a small difference of approximately 40 ms between the onsets of the two visual articulatory movements relative to the onset of the respective acoustic signals (i.e. −320 ms for /ba/ versus −360 ms for /va/). Productions began and ended in a neutral closed mouth position. The illusory McGurk audio-visual pair was created by synchronously dubbing the spoken syllable /ba/ onto the video of /va/. This particular combination elicits a particularly strong McGurk illusion in which the auditory perception is dominated by the visual information—that is, observers usually report hearing /va/, which corresponds to the visual portion of the bisensory stimulus (e.g. Jones & Callan, 2003; Rosenblum & Saldana, 1992; Summerfield & McGrath, 1984). The auditory /ba/ stimulus (duration: 370 ms; intensity: 60 dB SPL) was presented binaurally over headphones (Sennheiser-HD600). The visual stimuli were presented to the center of a computer CRT monitor located 100 cm from the subject (Iiyama VisionMaster Pro 502, 1024 × 768 pixels, 75 Hz). Stimuli subtended 10° × 7.5° of visual angle and subjects were instructed to look at the speaking face stimulus and pay attention to the mouth articulation.
McGurk-MMN was generated using an oddball paradigm in two conditions: visual alone (/ba/ as ‘standard’ and /va/ as ‘deviant’) and audio–visual (congruent audio /ba/ and visual /ba/ as ‘standard’ and incongruent audio /ba/ and visual /va/ as ‘deviant’). Hence, in the critical audio–visual condition, the phoneme /ba/ was presented auditorily on every trial but was perceived as /va/ when presented with an incongruent visual articulation. The inter-stimulus interval was 1630 ms and the probability of a deviant trial was 20%. Because the task involved simple fixation on the speaker’s mouth, very short stimulation blocks (approximately 1½ min each) were administrated to minimize fatigue effects. Visual alone and audio–visual blocks (35–40 stimuli/block) were presented in random order and separated by short breaks for a total of approximately 1420 trials per condition. The rationale for using the visual alone condition was twofold. First, we aimed to rule out the possibility that the McGurk-MMN might be attributable to visual mismatch processes (Pazo-Alvarez, Cadaveira, & Amenedo, 2003). Second, this condition controls for any sensory response differences due to differential mouth movements in the standard and the deviant stimuli. For the main analysis, the standard and deviant visual responses were subtracted from the corresponding auditory–visual responses. As such, MMN activity related to the illusory phonemic change was examined by comparing the resulting ‘auditory’ standard and deviant responses. This subtraction procedure, of course, does not mean that the resulting ERP responses are purely auditory as they will also include some integrative processing (e.g. Molholm, Ritter, Javitt, & Foxe, 2004), but it does better control for visual evoked activity in the McGurk-MMN.
2.3. Data acquisition and statistical analysis
Continuous EEG was acquired from 128-scalp electrodes (impedances < 5 kΩ), referenced to the nose, band-pass filtered from 0.05 to 100 Hz, and sampled at 500 Hz (SynAmps amplifiers, NeuroScan Inc.). Trials with blinks and eye movements were automatically rejected off-line on the basis of the electro-occulogram. An artifact criterion of ±75 μV was used at all other scalp sites to reject trials with muscular or other noise transient artifacts. The average number of accepted sweeps for the deviant responses was 240 (±34). A zero-phase-shift Butterworth digital band-pass filter (0.5–50 Hz, 48 dB) was applied for ERP peak analysis. The continuous EEG was divided into epochs (the −500 to 600 ms surrounding the onset of auditory stimulation) and averaged from each subject to compute the ERPs. Epochs were first baseline-corrected on a prestimulus interval of 100 ms before the visual onset in order to subtract the visual condition responses from the audio–visual condition responses. The resulting waveforms were then baseline-corrected over the 100 ms epoch preceding the auditory stimulus onset (−100 to 0 ms). The MMN was obtained by subtracting the standard response from the deviant response.
Two methods were used to ascertain the presence of the MMN. A common approach (e.g. Ritter, Sussman, Molholm, & Foxe, 2002; Sussman, Ritter, & Vaughan, 1998; Tervaniemi, Schröger, & Näätänen, 1997) consists of measuring the mean voltage across a 50 ms window centered at the peak latency of the grand mean MMN (deviant minus standard) and submitting this dependent measure to analysis of variance (ANOVA). This was done for four sites, right and left mastoids, Fz and Oz. The first three sites are from scalp regions well known to show large MMN responses, while a posterior electrode was chosen to assess the efficacy of our subtraction procedure in terms of eliminating differences between the waveforms due to visual differences in stimulation. Repeated measure analysis of variance (ANOVA) involving additional electrodes was then used to test for asymmetry with the following 2 × 5 factors: hemisphere (left, right) and electrode (FC1/FC2, C1/C2, C3/C4, C5/C6, T7/T8). Statistical significance was assessed with an alpha level of 0.05 submitted to Greenhouse–Geisser corrections for violation of the sphericity assumption.
To provide a more general description of the spatio-temporal properties of the McGurk-MMN, a second method was computed based on point-wise paired t-tests between standard and deviant responses for all electrodes at each time point. For each scalp electrode, the first time point where the t-test exceeded the 0.05 p-value criterion for at least 11 consecutive data points (>20 ms at a 500 Hz digitization rate) was labeled as onset of McGurk-MMN response (Guthrie & Buchwald, 1991). The resulting statistical cluster plots are a suitable alternative to Bonferroni correction for multiple comparisons, which would increase the likelihood of type II errors through overcompensation for type I errors (see Murray et al., 2002).
2.4. Topographical mapping and source analysis
Exact electrode locations were assessed for each subject on the day of testing by 3D-digitization of the locations of the scalp electrodes with respect to fiduciary landmarks (i.e. the nasion and pre-auricular notches) using a magnetic digitization device (Polhemus Fastrak™). Electrode placement was highly consistent across subjects due to the use of a custom-designed electrode cap that constrained inter-electrode spacing and placement. 3D-scalp topographic maps representing interpolated potential distributions were derived from the 128-scalp measurements and based on the computation of a common average reference. These interpolated potential maps were displayed on the 3D reconstruction as implemented in the Brain Electrical Source Analysis software (BESA 5.1, MEGIS Software GmbH, Munich, Germany). Scalp current density (SCD) topographic mapping was then computed. This method, based on the second spatial derivative of the recorded potential, eliminates the contribution of the reference electrode and reduces the effects of volume conduction to the surface recorded potential. This allows for better visualization of the approximate locations of intracranial generators that contribute to a given scalp recorded ERP.
Source localization of the intracranial generators was conducted with dipole modeling using BESA. This method assumes that there are a limited and distinct number of active brain regions over the evoked potential epoch, each of which can be approximated by an equivalent dipole. Dipole generators are placed within a four-shell (brain, cerebrospinal fluid, bone and skin) spherical volume conductor model with a radius of 90 mm and scalp and skull thickness of 6 and 7 mm, respectively. The genetic algorithm module of BESA was used to free fit a single dipole to the peak amplitude of the McGurk-MMN. This initial dipole was fixed and additional dipoles were successively free fit to assess if they improved the solution. When not fixed, the positions and orientations of the dipoles are iteratively adjusted to minimize the residual variance between the forward solution and the observed data. Group averaged ERP data were used to maintain the highest possible signal-to-noise ratio as well as to generalize our results across individuals. It should be pointed out that in dipole source analysis, the modeled dipoles represent an oversimplification of the activity in the areas and should be considered as representative of centers of gravity of the observed activity.
3. Results
All 11 subjects included in the analyses reported experiencing a strong McGurk illusion, the majority reporting hearing a clear /va/ with some also reporting hearing occasional derivative fricative phonemes (/fa/ or /tha/). The presence of a clear ERP to the visual-alone condition is evident in Fig. 1 where the waveforms obtained for the standard (/ba/) and deviant (/va/) in the visual-alone condition show ongoing visual activity before and after time point zero (corresponding to the onset of the auditory stimulus in the audio–visual condition), not only over occipital areas but also over parietal and central regions. This demonstrates the importance of subtracting out the visual response from the audio–visual response to accurately assess the McGurk-MMN. Further, as can be seen in Fig. 1, there was no suggestion of a visual MMN for the visual alone condition, as evidenced in the subtraction waveform (gray trace).2 The ERPs elicited by the deviant stimuli (red waveforms) are never more negative than the ERPs elicited by the standard visual stimuli for more than a few data points (blue waveforms). However, application of the t-test method of Guthrie and Buchwald (1991) revealed several significant clusters (p < 0.05) over fronto-central scalp during the epoch of the auditory MMN (230–320 ms), with the response to the standard (“ba”) clearly diverging from that of the deviant due to an additional sharp negative deflection.
Fig. 1.
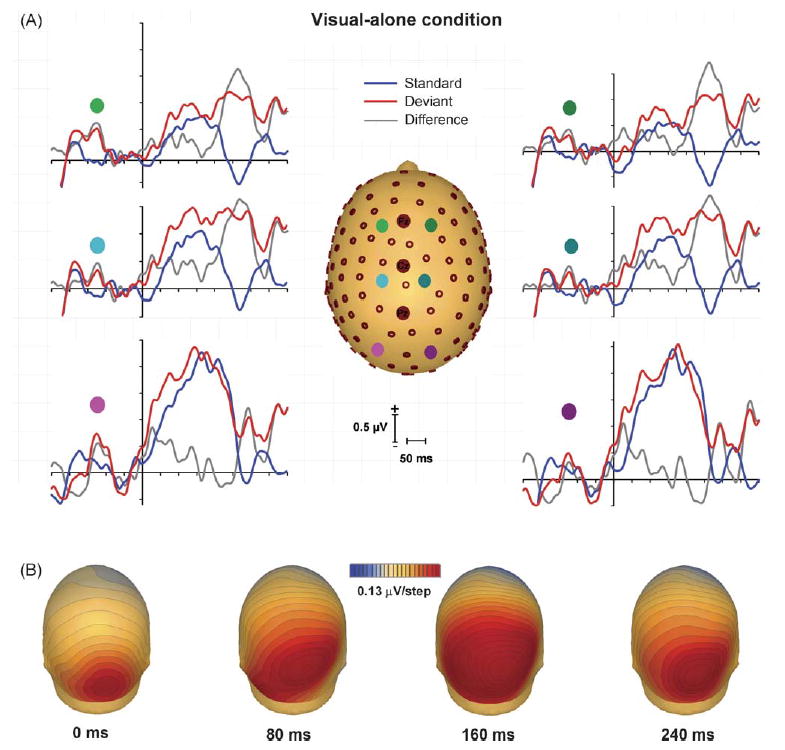
Grand mean (n = 11) ERPs for the visual-alone condition. (A) Strong visual responses are evoked by the ongoing videos of speech articulations. Waveforms are plotted for the standard trials (blue line), the deviant trials (red line) and the difference wave (gray line) as obtained by subtracting responses to the standard trials from those to the deviant trials. (B) Topographic mapping shows the distribution of this activity (average of the standard and deviant stimuli) over occipito-parietal scalp. Note that visual activity precedes the 0 ms timepoint, which denotes the time at which the auditory stimulus onsets during audio–visual trials, since the visual articulations precede the actual onset of any sound.
Fig. 2 illustrates the standard, deviant and difference waveforms obtained by subtracting the ERP elicited by the standards (/ba/) from the ERP elicited by the deviant (with the visual-alone control ERPs subtracted out). A typical MMN-like waveform was found at Fz between 175 and 400 ms with peak latency at 290 ms after auditory onset. For each subject, the mean voltage across a 50 ms window centered on the MMN peak (266–316 ms) was measured in the subtracted waveforms and compared against zero. The t-test confirmed the presence of a significant MMN-like response across this 50 ms epoch at Fz (t10 = −2.47, p = 0.033) with post-hoc tests showing substantially stronger effects at the peak of the MMN response (p < 0.001; see Fig. 3). We did not find any evidence for polarity inversion between frontal and mastoid electrodes, which is more typically found in MMN studies using basic acoustical changes such as pitch. Only the left mastoid showed a positive going response in the latency of the MMN, but this response was not significantly different from baseline (p = 0.66). Note however that when the current density transform is performed (see Fig. 4), SCD maps reveal polarity inversion at the mastoid. As expected, having subtracted out the corresponding visual responses, no significant difference between deviant and standard responses was observed over occipital regions (p = 0.71 at Oz).
Fig. 2.
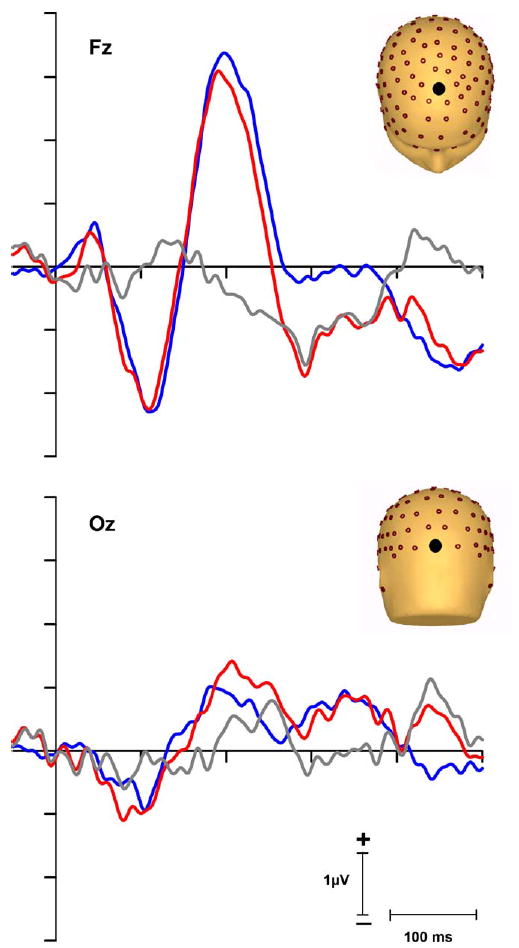
Grand mean ERPs after subtraction of visual-alone responses from audio–visual responses. Waveforms from a pair of electrode sites over mid-line frontal scalp (Fz) and midline occipital scalp (Oz) for the standard trials (blue line), the deviant trials (red line) and the difference wave (gray line) were obtained by subtracting responses to the standard trials from those to the deviant trials. A clear MMN-like response can be seen in the waveforms at Fz, but not at Oz.
Fig. 3.

Statistical cluster plots of the McGurk-MMN response. Color values indicate the p-values that result from point-wise t-tests evaluating the mismatch negativity effect across post-stimulus time (x-axis) and electrode positions (y-axis). General electrode positions are arranged from frontal to posterior regions (top to bottom of graph) and the scalp has been divided into six general scalp regions. Within each general region, electrode laterality is arranged from right (R) to left scalp (L). Only p-values <0.05 are color-coded.
Fig. 4.
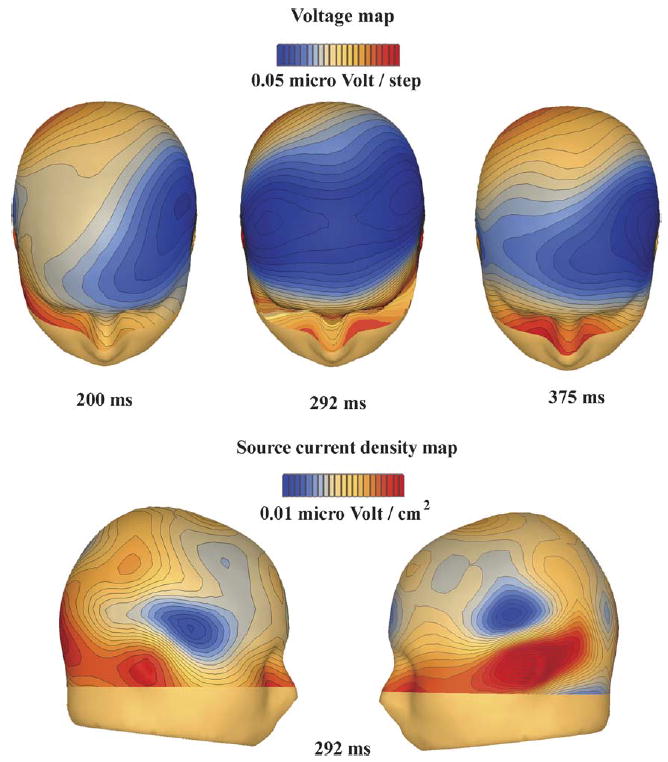
Topographical voltage distribution of the McGurk-MMN activity across the three main phases of activity identified in the difference waveforms (top panel) and SCD maps (lower panel) during the middle phase.
To explore the spatio-temporal properties of McGurk-MMN generation in detail, with a particular focus on determining the laterality of the initial phase of the response, statistical cluster plots were computed (Fig. 3). The earliest statistical evidence for generation of MMN responses began over left temporal scalp at 174 ms, and remained distinctly left-lateralized until ~250 ms. Subsequently, a second phase of activity with spread to bilateral fronto-central scalp sites began, reaching maximal amplitude at ~290 ms. Finally, a third distinct phase of the MMN response was seen, with a return to exclusively left-lateralized scalp sites (peaking ~375 ms).
The three distinct phases of McGurk-MMN activity are illustrated in the scalp topographic maps shown in Fig. 4 for three time points centered at the peak of each of these phases. To test for laterality effects in the McGurk-MMN, mean amplitude values were calculated for three 50 ms time-windows centered at 200, 292 and 375 ms, for ten electrodes along a coronal line from Fz towards the left and right mastoid. These data were then submitted to repeated ANOVAs with factors of hemisphere and electrode (FC1/FC2, C1/C2, C3/C4, C5/C6, T7/T8). A significant main effect of hemisphere was found for the initial phase of the MMN (F1,10 = 6.1, p < 0.05), driven by its left lateralization as detailed above. As one would expect from the topographic maps, the second phase of the MMN showed no such effect (p > 0.1). While the cluster plots and topographic maps indicated left lateralization of the third phase of the MMN, this did not quite reach significance (F1,10 = 4.3, p = 0.06).
Although clear left-sided dominance can be observed in the early and late phases of the mismatch response, the scalp topography at the peak latency of this effect (292 ms at Fz) suggests bilateral generators. As illustrated in the lower panel of Fig. 4, the corresponding SCD map shows that the main activity at 292 ms originates from bilateral temporal cortex. A post hoc analysis was conducted on the SCD values to assess whether the power (defined as the sum of the absolute voltage for two electrodes) of the left-mastoid/T7 pair differed from the right-mastoid/T8 pair.3 No significant effect of hemisphere was found (t(10) = 0.332, p = 0.747), with mean amplitudes of 0.156 and 0.145 μV/cm2 for the left and right sides, respectively.
Source analysis was conducted on the grand-average difference wave (deviant minus standard responses) to model the intracranial generators of the McGurk-MMN (Fig. 5). Since topographic mapping and cluster plots showed a substantially lateralized distribution over left lateral temporal scalp at around 200 ms (Figs. 4 and 5), we started by free fitting a single equivalent-current dipole for the 190–216 ms time window across which this strong unilateral distribution was observed. A stable fit was found in the region of the left transverse temporal gyrus of Heschl on the supratemporal plane, in very close proximity to the superior temporal gyrus (STG) (Talairach coordinates: x = −53, y = −25, z = 13; Brodmann area: 41), and accounted for 65.8% of the variance in the data across this period with a peak goodness-of-fit of 73% at 204 ms. The location and orientation of this dipole were then fixed before proceeding with source-modeling of the second major phase of MMN activity (250–300 ms).
Fig. 5.
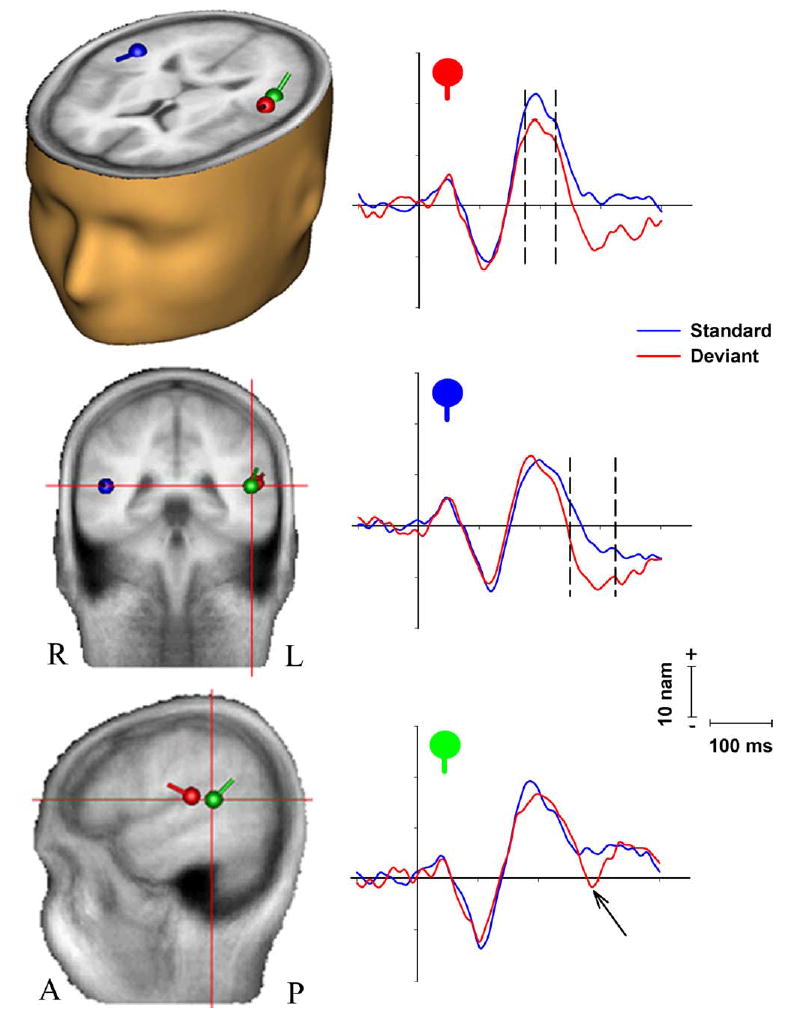
Source-analysis of the McGurk-MMN. Dipoles are superimposed on an averaged brain and shown in axial (left), coronal (upper right) and sagittal (lower right) views (L, left; R, right; A, anterior; P, posterior). Source waveforms are plotted for each of the three generators displayed in the brain slices. The top plot shows source activity for the first left hemisphere dipole, located in the region of the left transverse gyrus. Dashed lines delimit the early left lateralized phase (175–225 ms) of the MMN response, activity that is unique to this source. The middle plot shows activity for the right dipole located in the superior temporal gyrus. Dashed lines delimit the second phase of the MMN response, which is evident in both this source and the left source plotted above. Finally, in the bottom panel, a third generator was found in more posterior left superior temporal cortex with a very late MMN-like response (here indicated by the arrow).
Since the first dipole explained the bulk of left lateralized activity for this second phase also, only a single additional dipole was initially fit across this period. The addition of this dipole (freely fit) improved the explained variance to 88.4% across this second epoch with a location in the right STG (x = 47, y = −42, z = 11). A third dipole was then added to the model, again allowed to freely fit, and indicated the presence of a generator in the left superior temporal cortex located slightly deeper and posterior to the first left-side dipole (x = −43, y = −38, z = 16). This three-dipole model provided an excellent fit for the 250–300 ms epoch, accounting for fully 92.7% of the variance (with a peak goodness-of-fit of 94.6% at 264 ms). Opening the epoch up across the entire MMN epoch (174–384 ms as determined by the cluster plot analysis), this simple three-dipole model still accounted for 85% of the variance in the data. Addition of a fourth freely fitting dipole across this epoch did not result in any substantial improvement in fit (explained variance) and did not produce a stable fourth generator location, so the presence of a fourth source was rejected.
4. Discussion
In the current study we measured the spatio-temporal properties of the McGurk-MMN using high-density electrical mapping. A robust MMN response was uncovered in the latency range from 175 to 400 ms. Topographic mapping of the initial McGurk-MMN response showed a highly lateralized left hemisphere distribution that persisted for approximately 50 ms (175–225 ms). In a second phase of activity, right temporal regions also became active as MMN activity became strongly bilateralized over fronto-central scalp, reaching maximal amplitude at 290 ms. Finally, during a third phase of activity, the topographic distribution revealed a left hemisphere dominance (350–400 ms). Source analysis of the McGurk-MMN implicated bilateral sources in the temporal lobe just posterior to primary auditory cortex. While right hemispheric contributions were accounted for with a single source in the STG, two separate sources best accounted for the left hemispheric contributions, one in the transverse gyrus of Heschl (Broadman area 41) and the other in STG. These findings support the notion that visually driven multisensory illusory phonetic percepts are associated with an auditory MMN cortical response, and that left hemisphere temporal cortex plays a crucial role in this process.
Because the McGurk illusion allows the elicitation of a phonetic-MMN in the absence of any acoustic changes, it is an ideal paradigm to dissociate phonologic from acoustic MMN processing (Colin et al., 2002). MMN studies suggest the existence of an automatic phonetic-specific trace in the human brain that is distinct from acoustic change-detection processes (e.g. Dehaene-Lambertz, 1997; Näätänen et al., 1997; Sharma & Dorman, 1999). While acoustic-specific MMN is thought to rely on both hemispheres, with the right hemisphere playing a crucial role, phonetic-specific MMNs appear to occur predominantly on the left side (Näätänen, 2001). Our results support the existence of phonetic/phonologic MMN processing. Although the voltage maps showed a bilateral fronto-central distribution at the peak latency of the MMN waveform, the earliest and again the later phase of the McGurk-MMN were found to be strongly left-lateralized. Dipole modeling suggests that the most posterior of the two left temporal generators is located at the junction of Brodmann areas 22 and 40, in the vicinity of Wernicke’s area. The existence of such a generator has been hypothesized by Rinne et al. (1999) in their ERP study of MMN elicited by non-phonetic and phonetic sounds in which they concluded that: “…additional posterior areas of the temporal cortex (e.g. Wernicke’s area) are activated by phonetic stimulation …” (p. 116). Although precise localization of the intracranial generators of the MMN is beyond the spatial resolution of ERP source modeling, our results do support the participation of the posterior temporal cortex of the left hemisphere in McGurk-MMN processing. This finding is also in agreement with Sams and collaborators’ MEG studies that show magnetic responses in the supratemporal auditory cortex are associated with infrequent McGurk perceptions (Möttönen et al., 2002; Sams et al., 1991).
Our finding of two sources in the left temporal lobe is particularly interesting because of the hypothesis that speech stimuli activate two MMNs, one acoustic and one phonetic, in the temporal lobe of the left hemisphere (Näätänen, 2001; Rinne et al., 1999; see also Winkler et al., 1999). One of these MMNs is considered to occur with regard to the acoustic change and one with regard to the phonetic change, the latter being more posterior than the former. The posterior dipole depicted in the present paper supports the existence of phonetic processing in the vicinity of Wernicke’s area, but there is a question as to whether the more anterior source should be considered an acoustic MMN, i.e. a MMN with an acoustic-level representation. We would argue that it makes sense that the McGurk illusion is associated with an acoustic MMN in that the illusion is associated with an auditory perception that differs from the actual auditory input. This suggests that coding of the acoustic features of the auditory stimulus were modified by the visual input to auditory cortex. Assuming this modification occurs prior to input to the MMN system, the acoustic representation of the auditory input would differ from the acoustic representation of the standard, resulting in the activation of an acoustic MMN. However, the general consensus is that acoustic MMNs are larger in the right than the left hemisphere (Näätänen, 2001), whereas the initial source found here was unilateral and located in the transverse temporal gyrus of Heschl, exclusively in the left hemisphere. It is only in the second phase of MMN processing that we see the emergence of a strong right hemisphere MMN generator. Why the first phase of the MMN is left-lateralized is not entirely clear, and merits further investigation.
Although we did not find clear evidence of polarity inversion at mastoid electrodes for the McGurk-MMN, except for the earliest phase, scalp current density mapping (SCD) unambiguously established that there was indeed some inversion. In a similar vein, Colin et al. (2002), using a design comparable to ours, also did not find obvious polarity inversion for the McGurk-MMN but pointed out that polarity inversions at the mastoid are often only manifest at very high signal-to-noise ratios which can require far more deviant trials than were obtained here. Both studies suggest that polarity reversal for the McGurk-MMN is weaker than for other contrasts, which in turn suggests that the generator orientation of this MMN is not equivalent to the orientation of the standard MMN evoked by simple auditory deviance where polarity inversions are typically far more obvious.
Differences in visual stimulation may have erroneously influenced previous measures of the McGurk-MMN, and Fig. 1 here makes it clear that sensory-processing differences are indeed seen for the two visual articulatory stimuli. Colin et al. (2002) reported an earlier McGurk-MMN effect at about 150 ms after auditory onset. This McGurk-MMN activity, however, may have been overestimated because of interference from the prior visual articulation; the standard and deviant waveforms in the Colin et al. paper do not show a high degree of overlap in the period preceding the onset of auditory stimulation and the whole epoch of the deviant condition tends to be non-specifically more negative. Consequently, we believe that this “early” mismatch response, also reported by Sams et al. (1991) with MEG, should be interpreted cautiously given that the overlapping visual responses were not subtracted out.
A number of studies have revealed that there is a visual mismatch system that appears to operate in a similar manner to the auditory mismatch system (see e.g. Heslenfeld, 2003; Pazo-Alvarez et al., 2003). Thus, it is curious that there is no obvious suggestion of a visual MMN in our data (see Fig. 1). A close inspection of the visual-alone data of Sams et al. (1991) and Colin et al. (2002, 2004) also shows no obvious visual MMN. It is not clear why no visual MMN appears to be elicited by visual articulatory stimuli in oddball designs, but the finding strengthens our conclusion that the auditory MMN obtained in our study is not affected by an overlapping visual MMN. What then are we to make of the differences that were seen between the standard (“ba”) and deviant (“va”) visual stimuli? In the general epoch of the auditory MMN (230–320 ms), while the response to the deviant stimulus continues to be positive, a distinct additional negative deflection emerges in the response to the standard. The morphology of this difference would appear to rule out P300-like processes as its topography is more fronto-central and it appears to be driven mainly by additional processing of the standard. What is more, it should be kept in mind that the deviant visual stimulus was presented some 600 ms before the peak of this difference. Since there is a clear difference between the standard and deviant beginning at stimulus onset, this divergence between the standard and deviant responses is really too late to reflect a P300-like process. The more likely explanation for this difference therefore is basic differences in sensory processing of the ongoing visual articulations, which one would fully expect to occur given the rather distinct sensory input patterns.
Another possibility that needs to be considered is that some oddball-related N2 or N2b activity was superimposed on the MMN. That is, in typical oddball designs where subjects explicitly attend for the occurrence of the rare target events, the so-called N2-P3 component complex is evoked (e.g. Simson, Vaughan, & Ritter, 1977). However, several results suggest that a major contribution from N2 processes is unlikely in the present study. First, the complete absence of any P3-like processes (see Fig. 2) strongly suggests that subjects were not explicitly attending to the auditory–visual oddball stimuli. Second, the N2 is distinguishable from the MMN by its scalp topography in that N2 has its maximal amplitude at central scalp sites, whereas MMN is maximal at frontal sites (Novak, Ritter, & Vaughan, 1992), and it is this fronto-central topography that is seen here (see voltage map at 292 ms in Fig. 3).
The existence of an MMN to the McGurk illusion indicates that auditory sensory memory processes can be modified by visual inputs. Auditory and visual information in speech are undeniably closely linked together (Liberman & Mattingly, 1985). For example, it is remarkable just how much speech recognition can be accentuated by the visual cues provided by mouth articulation under noisy environmental conditions (Ross, Saint-Amour, Leavitt, Javitt, & Foxe, in press; see also Sumby & Pollack, 1954). In fact, seeing the lip movements of a speaker in the absence of any auditory stimulation can result in activation of secondary auditory cortex (Bernstein et al., 2002; Callan, Callan, Kroos, & Vatikiotis-Bateson, 2001; Calvert et al., 1997; Sams et al., 1991) and data now appear to unequivocally show that even primary auditory cortex is activated by seen lip-movements (MacSweeney et al., 2000; Molholm & Foxe, 2005; Pekkola et al., 2005). Such multisensory interactions raise the question of how the auditory cortex is influenced by visual inputs. According to a feedback model, this effect is driven by top-down inputs from higher order multisensory regions such as the superior temporal sulcus onto the early auditory unisensory areas (Calvert et al., 1999). An alternative, but more controversial model, is that there are inputs to early sensory regions from other sensory systems that affect stimulus processing in a feedforward manner (Foxe et al., 2000, 2002; Foxe & Schroeder, 2005; Giard & Peronnet, 1999; Molholm et al., 2002; Murray et al., 2005; Schroeder & Foxe, 2002, 2005). In support of this view, monosynaptic connections between visual and auditory cortices have recently been demonstrated anatomically in macaques (Falchier, Clavagnier, Barone, & Kennedy, 2002), suggesting direct cortico-cortical influences of visual inputs to auditory cortex. In the audio–visual speech domain, the fact that seeing the visual articulation precedes the auditory signal makes plausible the existence of early audio–visual interactions, allowing visual representations to be already available when auditory processing is initiated. This could allow the speech system to prime the corresponding auditory speech processing, or, in the case of bisensory incongruence such as in a McGurk condition, modify it to resolve the perceptual ambiguity across sensory inputs. In support of this notion, a recent ERP study reported audio–visual interaction as early as the human brainstem response at just 11 ms post-acoustic stimulation for both congruent and incongruent (McGurk) stimuli (Musacchia, Sams, Nicol, & Kraus, 2006). Clearly, effects in the auditory brainstem such as these must be driven by feedback influences due to the preceding visual stimulation. At the cortical level, preliminary results from intracranial recordings in human STG suggest that visual and auditory inputs can interact relatively early in the information-processing stream and give rise to McGurk-MMN responses with similar latencies to MMN responses obtained with auditory-alone stimuli (Saint-Amour et al., 2005). Interestingly, recent evidence suggests that visual information can influence short-term auditory representation in an MMN oddball paradigm even for non-speech stimuli (Besle, Fort, & Giard, 2005; Stekelenburg, Vroomen, & de Gelder, 2004). These findings support the notion that visual and auditory information can interact during or before the generation of the MMN. Hence, it is reasonable to assume that the influence of visual inputs on the auditory representation underlying McGurk-MMN involves feedback processing from higher-order multisensory regions (e.g. superior temporal sulcus), but also processing at very early stages of the sensory computation.
5. Conclusion
Visual influences on auditory speech perception were investigated with an auditory-like MMN paradigm. The McGurk-MMN was shown to onset at 175 ms, demonstrating that visual speech articulations influenced higher order phonemic representations by this time. The amplitude of the MMN peaked at 290 ms and extended until 400 ms. Over the time course of the MMN, two distinct topographies were observed with a left-sided predominance. Along with dipole modeling we showed that a single left temporal generator is adequate to explain the earliest phase of the MMN and the subsequent response involves two additional generators in the right and left temporal cortex. Significantly, the McGurk-MMN, with sources localized to bilateral auditory cortices, occurred in the absence of acoustic change. This shows that visual influences on auditory speech perception are realized in auditory cortex, in the time frame of perceptual processing. Further, the obvious left lateralization of the early and late phases of the MMN are consistent with the involvement of language representations.
Acknowledgments
We would like to express our sincere appreciation to Beth Higgins, Deirdre Foxe and Marina Shpaner for their ever-excellent technical help with this study. We are most grateful to Dr. Renée Béland for her valuable and helpful insights on speech perception. Our thanks also go to two anonymous reviewers for their careful and constructive comments. This work was supported by grants from the National Institute of Mental Health (MH65350 to JJF and WR) and the National Institute of Neurological Disorders and Stroke (NS30029 to WR and JJF) and a National Research Service Award (MH68174 to SM).
Footnotes
A 12th subject was excluded from the analysis because he reported not experiencing strong McGurk illusions during post-experiment debriefing.
It is the prestimulus epoch that we consider here, where a visual MMN would be expected around −150 ms (that is, about 200 ms after the onset of the visual deviant). The statistical cluster plots showed no significant differences over posterior scalp in this time frame.
Due to volume conduction, topographic laterality can be obscured in the voltage domain (Foxe & Simpson, 2002). Calculating the SCD removes the effects of volume conduction and results in more focused topographic maps and by extension, in potentially greater sensitivity to possible laterality differences.
References
- Bernstein LE, Auer ET, Jr, Moore JK, Ponton CW, Don M, Singh M. Visual speech perception without primary auditory cortex activation. Neuroreport. 2002;13:311–315. doi: 10.1097/00001756-200203040-00013. [DOI] [PubMed] [Google Scholar]
- Besle J, Fort A, Giard MH. Is the auditory sensory memory sensitive to visual information? Experimental Brain Research. 2005 doi: 10.1007/s00221-005-2375-x. [DOI] [PMC free article] [PubMed] [Google Scholar]
- Callan DE, Callan AM, Kroos C, Vatikiotis-Bateson E. Multimodal contribution to speech perception revealed by independent component analysis: A single-sweep EEG case study. Brain Research Cognitive Brain Research. 2001;10:349–353. doi: 10.1016/s0926-6410(00)00054-9. [DOI] [PubMed] [Google Scholar]
- Calvert GA, Brammer MJ, Bullmore ET, Campbell R, Iversen SD, David AS. Response amplification in sensory-specific cortices during crossmodal binding. Neuroreport. 1999;10:2619–2623. doi: 10.1097/00001756-199908200-00033. [DOI] [PubMed] [Google Scholar]
- Calvert GA, Bullmore ET, Brammer MJ, Campbell R, Williams SC, McGuire PK, et al. Activation of auditory cortex during silent lipreading. Science. 1997;276:593–596. doi: 10.1126/science.276.5312.593. [DOI] [PubMed] [Google Scholar]
- Colin C, Radeau M, Soquet A, Deltenre P. Generalization of the generation of an MMN by illusory McGurk percepts: Voiceless consonants. Clinical Neurophysiology. 2004;115:1989–2000. doi: 10.1016/j.clinph.2004.03.027. [DOI] [PubMed] [Google Scholar]
- Colin C, Radeau M, Soquet A, Demolin D, Colin F, Deltenre P. Mismatch negativity evoked by the McGurk–MacDonald effect: A phonetic representation within short-term memory. Clinical Neurophysiology. 2002;113:495–506. doi: 10.1016/s1388-2457(02)00024-x. [DOI] [PubMed] [Google Scholar]
- Csèpe V, Karmos G, Molnar M. Evoked potential correlates of stimulus deviance during wakefulness and sleep in cat—Animal model of mismatch negativity. Electroencephalographic Clinical Neurophysiology. 1987;66:571–578. doi: 10.1016/0013-4694(87)90103-9. [DOI] [PubMed] [Google Scholar]
- Dehaene-Lambertz G. Electrophysiological correlates of categorical phoneme perception in adults. Neuroreport. 1997;8:919–924. doi: 10.1097/00001756-199703030-00021. [DOI] [PubMed] [Google Scholar]
- Falchier A, Clavagnier S, Barone P, Kennedy H. Anatomical evidence of multimodal integration in primate striate cortex. Journal of Neuroscience. 2002;22:5749–5759. doi: 10.1523/JNEUROSCI.22-13-05749.2002. [DOI] [PMC free article] [PubMed] [Google Scholar]
- Foxe JJ, Morocz IA, Murray MM, Higgins BA, Javitt DC, Schroeder CE. Multisensory auditory–somatosensory interactions in early cortical processing revealed by high-density electrical mapping. Brain Research Cognitive Brain Research. 2000;10:77–83. doi: 10.1016/s0926-6410(00)00024-0. [DOI] [PubMed] [Google Scholar]
- Foxe JJ, Schroeder CE. The case for feedforward multisensory convergence during early cortical processing. Neuroreport. 2005;16:419–423. doi: 10.1097/00001756-200504040-00001. [DOI] [PubMed] [Google Scholar]
- Foxe JJ, Simpson GV. Flow of activation from V1 to frontal cortex in humans. A framework for defining “early” visual processing. Experimental Brain Research. 2002;142:139–150. doi: 10.1007/s00221-001-0906-7. [DOI] [PubMed] [Google Scholar]
- Foxe JJ, Wylie GR, Martinez A, Schroeder CE, Javitt DC, Guilfoyle D, et al. Auditory-somatosensory multisensory processing in auditory association cortex: An fMRI study. Journal of Neurophysiology. 2002;88:540–543. doi: 10.1152/jn.2002.88.1.540. [DOI] [PubMed] [Google Scholar]
- Giard MH, Peronnet F. Auditory–visual integration during multimodal object recognition in humans: A behavioral and electrophysiological study. Journal of Cognitive Neuroscience. 1999;11:473–490. doi: 10.1162/089892999563544. [DOI] [PubMed] [Google Scholar]
- Giard MH, Perrin F, Pernier J, Bouchet P. Brain generators implicated in the processing of auditory stimulus deviance: A topographic event-related potential study. Psychophysiology. 1990;27:627–640. doi: 10.1111/j.1469-8986.1990.tb03184.x. [DOI] [PubMed] [Google Scholar]
- Guthrie D, Buchwald JS. Significance testing of difference potentials. Psychophysiology. 1991;28:240–244. doi: 10.1111/j.1469-8986.1991.tb00417.x. [DOI] [PubMed] [Google Scholar]
- Hari R, Hämäläinen M, Ilmoniemi R, Kaukoranta E, Reinikainen K, Salminen J, et al. Responses of the primary auditory cortex to pitch changes in a sequence of tone pips: Neuromagnetic recordings in man. Neuroscience Letters. 1984;50:127–132. doi: 10.1016/0304-3940(84)90474-9. [DOI] [PubMed] [Google Scholar]
- Heslenfeld DJ. Visual mismatch negativity. In: Polich J, editor. Detection of change: Event-related potential and fMRI findings. Dordrecht: Kluwer Academic Publishers; 2003. pp. 41–60. [Google Scholar]
- Javitt DC, Steinschneider M, Schroeder CE, Vaughan HG, Jr, Arezzo JC. Detection of stimulus deviance within primate primary auditory cortex: Intracortical mechanisms of mismatch negativity (MMN) generation. Brain Research. 1994;667:192–200. doi: 10.1016/0006-8993(94)91496-6. [DOI] [PubMed] [Google Scholar]
- Jones JA, Callan DE. Brain activity during audiovisual speech perception: An fMRI study of the McGurk effect. Neuroreport. 2003;14:1129–1133. doi: 10.1097/00001756-200306110-00006. [DOI] [PubMed] [Google Scholar]
- Liberman AM, Mattingly IG. The motor theory of speech perception revised. Cognition. 1985;21:1–36. doi: 10.1016/0010-0277(85)90021-6. [DOI] [PubMed] [Google Scholar]
- MacSweeney M, Amaro E, Calvert GA, Campbell R, David AS, McGuire P, et al. Silent speechreading in the absence of scanner noise: An event-related fMRI study. Neuroreport. 2000;11:1729–1733. doi: 10.1097/00001756-200006050-00026. [DOI] [PubMed] [Google Scholar]
- Marco-Pallares J, Grau C, Ruffini G. Combined ICA-LORETA analysis of mismatch negativity. Neuroimage. 2005;25:471–477. doi: 10.1016/j.neuroimage.2004.11.028. [DOI] [PubMed] [Google Scholar]
- McGurk H, MacDonald J. Hearing lips and seeing voices. Nature. 1976;264:746–748. doi: 10.1038/264746a0. [DOI] [PubMed] [Google Scholar]
- Molholm S, Foxe JJ. Look ‘hear’, primary auditory cortex is active during lip-reading. Neuroreport. 2005;16:123–124. doi: 10.1097/00001756-200502080-00009. [DOI] [PubMed] [Google Scholar]
- Molholm S, Martinez A, Ritter W, Javitt DC, Foxe JJ. The neural circuitry of pre-attentive auditory change-detection: An fMRI study of pitch and duration mismatch negativity generators. Cerebral Cortex. 2005;15:545–551. doi: 10.1093/cercor/bhh155. [DOI] [PubMed] [Google Scholar]
- Molholm S, Ritter W, Javitt DC, Foxe JJ. Multisensory visual–auditory object recognition in humans: A high-density electrical mapping study. Cerebral Cortex. 2004;14:452–465. doi: 10.1093/cercor/bhh007. [DOI] [PubMed] [Google Scholar]
- Molholm S, Ritter W, Murray MM, Javitt DC, Schroeder CE, Foxe JJ. Multisensory auditory–visual interactions during early sensory processing in humans: A high-density electrical mapping study. Brain Research Cognitive Brain Research. 2002;14:115–128. doi: 10.1016/s0926-6410(02)00066-6. [DOI] [PubMed] [Google Scholar]
- Möttönen R, Krause CM, Tiippana K, Sams M. Processing of changes in visual speech in the human auditory cortex. Brain Research Cognitive Brain Research. 2002;13:417–425. doi: 10.1016/s0926-6410(02)00053-8. [DOI] [PubMed] [Google Scholar]
- Murray MM, Molholm S, Michel CM, Heslenfeld DJ, Ritter W, Javitt DC, et al. Grabbing your ear: Rapid auditory–somatosensory multisensory interactions in low-level sensory cortices are not constrained by stimulus alignment. Cerebral Cortex. 2005;15:963–974. doi: 10.1093/cercor/bhh197. [DOI] [PubMed] [Google Scholar]
- Murray MM, Wylie GR, Higgins BA, Javitt DC, Schroeder CE, Foxe JJ. The spatiotemporal dynamics of illusory contour processing: Combined high-density electrical mapping, source analysis, and functional magnetic resonance imaging. Journal of Neuroscience. 2002;22:5055–5073. doi: 10.1523/JNEUROSCI.22-12-05055.2002. [DOI] [PMC free article] [PubMed] [Google Scholar]
- Musacchia G, Sams M, Nicol T, Kraus N. Seeing speech affects acoustic information processing in the human brainstem. Experimental Brain Research. 2006;168:1–10. doi: 10.1007/s00221-005-0071-5. [DOI] [PMC free article] [PubMed] [Google Scholar]
- Näätänen R. The perception of speech sounds by the human brain as reflected by the mismatch negativity (MMN) and its magnetic equivalent (MMNm) Psychophysiology. 2001;38:1–21. doi: 10.1017/s0048577201000208. [DOI] [PubMed] [Google Scholar]
- Näätänen R, Alho K. Mismatch negativity—A unique measure of sensory processing in audition. International Journal of Neuroscience. 1995;80:317–337. doi: 10.3109/00207459508986107. [DOI] [PubMed] [Google Scholar]
- Näätänen R, Lehtokoski A, Lennes M, Cheour M, Huotilainen M, Iivonen A, et al. Language-specific phoneme representations revealed by electric and magnetic brain responses. Nature. 1997;385:432–434. doi: 10.1038/385432a0. [DOI] [PubMed] [Google Scholar]
- Novak G, Ritter W, Vaughan HG., Jr Mismatch detection and the latency of temporal judgements. Psychophysiology. 1992;29:398–411. doi: 10.1111/j.1469-8986.1992.tb01713.x. [DOI] [PubMed] [Google Scholar]
- Pazo-Alvarez P, Cadaveira F, Amenedo E. MMN in the visual modality: A review. Biology Psychology. 2003;63:199–236. doi: 10.1016/s0301-0511(03)00049-8. [DOI] [PubMed] [Google Scholar]
- Pekkola J, Ojanen V, Autti T, Jääskeläinen IP, Möttönen R, Tarkiainen A, et al. Primary auditory cortex activation by visual speech: An fMRI study at 3T. Neuroreport. 2005;16:125–128. doi: 10.1097/00001756-200502080-00010. [DOI] [PubMed] [Google Scholar]
- Picton TW, Alain C, Otten L, Ritter W, Achim A. Mismatch negativity: Different water in the same river. Audiology Neurootology. 2000;5:111–139. doi: 10.1159/000013875. [DOI] [PubMed] [Google Scholar]
- Rinne T, Alho K, Alku P, Holi M, Sinkkonen J, Virtanen J, et al. Analysis of speech sounds is left-hemisphere predominant at 100–150 ms after sound onset. Neuroreport. 1999;10:1113–1117. doi: 10.1097/00001756-199904060-00038. [DOI] [PubMed] [Google Scholar]
- Ritter W, Deacon D, Gomes H, Javitt DC, Vaughan HG., Jr The mismatch negativity of event-related potentials as a probe of transient auditory memory: A review. Ear Hearing. 1995;16:52–67. doi: 10.1097/00003446-199502000-00005. [DOI] [PubMed] [Google Scholar]
- Ritter W, Sussman E, Molholm S, Foxe JJ. Memory reactivation or reinstatement and the mismatch negativity. Psychophysiology. 2002;39:158–165. doi: 10.1017/S0048577202001622. [DOI] [PubMed] [Google Scholar]
- Rosburg T, Trautner P, Dietl T, Korzyukov OA, Boutros NN, Schaller C, et al. Subdural recordings of the mismatch negativity (MMN) in patients with focal epilepsy. Brain. 2005;128:819–828. doi: 10.1093/brain/awh442. [DOI] [PubMed] [Google Scholar]
- Rosenblum LD, Saldana HM. Discrimination tests of visually influenced syllables. Perceptive Psychophysics. 1992;52:461–473. doi: 10.3758/bf03206706. [DOI] [PubMed] [Google Scholar]
- Ross L, Saint-Amour D, Leavitt V, Javitt D, Foxe JJ. Do you see what I’m saying? Optimal visual enhancement of speech comprehension in noisy environments. Cerebral Cortex. doi: 10.1093/cercor/bhl024. in press. [DOI] [PubMed] [Google Scholar]
- Saint-Amour D, Molholm S, Sehatpour P, Ross L, Mehta A, Schwartz T, et al. New York: Cognitive Neuroscience Society; 2005. Multisensory mismatch negativity processes in temporal cortex: A human intracranial investigation of the McGurk illusion. [Google Scholar]
- Sams M, Aulanko R, Hämäläinen M, Hari R, Lounasmaa OV, Lu ST, et al. Seeing speech: Visual information from lip movements modifies activity in the human auditory cortex. Neuroscience Letters. 1991;127:141–145. doi: 10.1016/0304-3940(91)90914-f. [DOI] [PubMed] [Google Scholar]
- Sams M, Hämäläinen M, Antervo A, Kaukoranta E, Reinikainen K, Hari R. Cerebral neuromagnetic responses evoked by short auditory stimuli. Electroencephalographic Clinical Neurophysiology. 1985;61:254–266. doi: 10.1016/0013-4694(85)91092-2. [DOI] [PubMed] [Google Scholar]
- Scherg M, Berg P. Use of prior knowledge in brain electromagnetic source analysis. Brain Topography. 1991;4:143–150. doi: 10.1007/BF01132771. [DOI] [PubMed] [Google Scholar]
- Schroeder CE, Foxe JJ. The timing and laminar profile of converging inputs to multisensory areas of the macaque neocortex. Brain Research Cognitive Brain Research. 2002;14:187–198. doi: 10.1016/s0926-6410(02)00073-3. [DOI] [PubMed] [Google Scholar]
- Schroeder CE, Foxe JJ. Multisensory contributions to low-level ‘unisensory’ processing. Current Opinion on Neurobiology. 2005;15:454–458. doi: 10.1016/j.conb.2005.06.008. [DOI] [PubMed] [Google Scholar]
- Sharma A, Dorman MF. Cortical auditory evoked potential correlates of categorical perception of voice-onset time. The Journal of the Acoustical Society of America. 1999;106:1078–1083. doi: 10.1121/1.428048. [DOI] [PubMed] [Google Scholar]
- Simson R, Vaughan HG, Jr, Ritter W. The scalp topography of potentials in auditory and visual Go/NoGo tasks. Electroencephalographic Clinical Neurophysiology. 1977;43:864–875. doi: 10.1016/0013-4694(77)90009-8. [DOI] [PubMed] [Google Scholar]
- Stekelenburg JJ, Vroomen J, de Gelder B. Illusory sound shifts induced by the ventriloquist illusion evoke the mismatch negativity. Neuroscience Letters. 2004;357:163–166. doi: 10.1016/j.neulet.2003.12.085. [DOI] [PubMed] [Google Scholar]
- Sumby WH, Pollack L. Visual contribution to speech intelligibility in noise. The Journal of the Acoustical Society of America. 1954:212–215. [Google Scholar]
- Summerfield Q, McGrath M. Detection and resolution of audio–visual incompatibility in the perception of vowels. Quarterly Journal of Experimental Psychology Section A. 1984;36:51–74. doi: 10.1080/14640748408401503. [DOI] [PubMed] [Google Scholar]
- Sussman E, Ritter W, Vaughan HG., Jr Attention affects the organization of auditory input associated with the mismatch negativity system. Brain Research. 1998;789:130–138. doi: 10.1016/s0006-8993(97)01443-1. [DOI] [PubMed] [Google Scholar]
- Tervaniemi M, Schröger E, Näätänen R. Pre-attentive processing of spectrally complex sounds with asynchronous onsets: An event-related potential study with human subjects. Neuroscience Letters. 1997;227:197–200. doi: 10.1016/s0304-3940(97)00346-7. [DOI] [PubMed] [Google Scholar]
- Winkler I, Lehtokoski A, Alku P, Vainio M, Czigler I, Csèpe V, et al. Pre-attentive detection of vowel contrasts utilizes both phonetic and auditory memory representations. Brain Research Cognitive Brain Research. 1999;7:357–369. doi: 10.1016/s0926-6410(98)00039-1. [DOI] [PubMed] [Google Scholar]