

Abstract
When faced with nutrient deprivation, Saccharomyces cerevisiae cells enter into a nondividing resting state, known as stationary phase. The Ras/PKA (cAMP-dependent protein kinase) signaling pathway plays an important role in regulating the entry into this resting state and the subsequent survival of stationary phase cells. The survival of these resting cells is also dependent upon autophagy, a membrane trafficking pathway that is induced upon nutrient deprivation. Autophagy is responsible for targeting bulk protein and other cytoplasmic constituents to the vacuolar compartment for their ultimate degradation. The data presented here demonstrate that the Ras/PKA signaling pathway inhibits an early step in autophagy because mutants with elevated levels of Ras/PKA activity fail to accumulate transport intermediates normally associated with this process. Quantitative assays indicate that these increased levels of Ras/PKA signaling activity result in an essentially complete block to autophagy. Interestingly, Ras/PKA activity also inhibited a related process, the cytoplasm to vacuole targeting (Cvt) pathway that is responsible for the delivery of a subset of vacuolar proteins in growing cells. These data therefore indicate that the Ras/PKA signaling pathway is not regulating a switch between the autophagy and Cvt modes of transport. Instead, it is more likely that this signaling pathway is controlling an activity that is required during the early stages of both of these membrane trafficking pathways. Finally, the data suggest that at least a portion of the Ras/PKA effects on stationary phase survival are the result of the regulation of autophagy activity by this signaling pathway.
Saccharomyces cerevisiae cells respond to nutrient deprivation by arresting cell division and entering into a nondividing resting state, known as the stationary phase (1, 2). Cells in this resting state exhibit a diminished rate of metabolic activity, an increased resistance to a variety of environmental stress conditions and an altered pattern of gene expression (1-3). Entry into this quiescent state is essential for the long term survival of these cells as mutants that do not assume stationary phase characteristics rapidly lose viability upon nutrient limitation (1, 2). Moreover, this budding yeast, like most other eukaryotes, spends the majority of its existence in this resting state awaiting the signals needed to trigger new rounds of cell division. This latter observation has suggested that the transitions between the mitotic cycle and these periods of quiescence might be key points of proliferative control (4, 5). However, despite the importance of these resting states, relatively little is known about the mechanisms controlling the entry into, and subsequent maintenance within, this stationary phase of growth.
Recent studies have identified a number of genes that are important for the long term survival of S. cerevisiae stationary phase cells (2, 6-9). Interestingly, many of these genes encode proteins important for the process of macroautophagy (10, 11). Macroautophagy (to be referred to as simply autophagy for the remainder of this report) is a degradative pathway that is responsible for delivering bulk protein and other constituents of the cytoplasm to the vacuole for degradation (11-13). This pathway is induced by nutrient deprivation and mutants that are defective for autophagy rapidly lose viability during stationary phase growth (10, 14). Autophagy begins with the encapsulation of cytoplasmic material through the formation of a double membrane structure, termed the autophagosome (12, 13, 15, 16). Recent work has indicated that this intermediate originates from a novel cytoplasmic site, termed the pre-auto-phagosomal structure (12, 17, 18). The outer membrane of the autophagosome subsequently fuses with the vacuole releasing the internal vesicle, the autophagic body, into the lumen of this degradative compartment (12, 19). The hydrolytic enzymes within the vacuole then degrade both the delimiting membrane and the contents of the autophagic body (19-22). When this pathway is fully induced, it is generally responsible for the majority of the protein and membrane turnover occurring in those cells (21, 23).
Previous work has implicated the Tor signal transduction pathway in the control of both autophagy and stationary phase entry in S. cerevisiae. The inactivation of this signaling pathway results in the induction of autophagy and in a growth arrest that resembles that associated with stationary phase cells (24, 25). The Tor proteins are conserved serine/threonine-specific protein kinases that appear to coordinate the overall growth rate with nutrient availability in eukaryotic cells (26, 27). Consistent with this proposition, a wide variety of Tor pathway targets important for the control of cell growth have been identified in both yeast and other eukaryotic cells (26-29).
Stationary phase metabolism in S. cerevisiae is also controlled by a second signaling pathway that involves the Ras proteins and the cAMP-dependent protein kinase, PKA1 (1, 2, 30). The eukaryotic Ras proteins are small, GTP-binding proteins that function as molecular switches by oscillating between an active GTP-bound form and an inactive GDP-bound form (31, 32). S. cerevisiae has two Ras proteins, Ras1p and Ras2p, that directly interact with the enzyme adenylyl cyclase (33, 34). This interaction results in higher intracellular levels of cAMP and ultimately in increased PKA activity (35, 36). A role for this pathway in the regulation of stationary phase was suggested by the phenotypes of mutants with altered levels of Ras/PKA activity. For example, mutants with constitutively elevated levels of Ras/PKA activity fail to adopt stationary phase characteristics upon nutrient limitation (36). Conversely, mutations that inactivate this pathway result in a permanent stationary phase-like arrest (30, 37, 38). Thus, two different signaling pathways involving the Ras and Tor proteins appear to play a significant role in the control of stationary phase biology in S. cerevisiae (2, 26).
We are interested in characterizing the role of the Ras/PKA signaling pathway in the regulation of autophagy. Although the nature of this regulation has not been examined in detail, a recent study has found that increased levels of Ras/PKA signaling activity result in a decrease in the autophagic activity induced by the drug, rapamycin (39). Rapamycin is a potent inhibitor of Tor activity in vivo and is often used to study the consequences of Tor pathway inactivation (40, 41). Thus, these data were consistent with the Ras/PKA pathway having some regulatory role in the autophagy process. In this study, we examined this regulation in detail and found that Ras/PKA signaling activity controls a relatively early step in the autophagy pathway. This Ras-sensitive step likely precedes the formation of the autophagosome as these transport intermediates were not formed in cells with elevated levels of Ras/PKA signaling activity. This signaling pathway also inhibited a vacuolar trafficking pathway that is related to autophagy but functions during the log phase of growth. This cytoplasm to vacuole targeting (Cvt) pathway shares many mechanistic features with autophagy and most of the proteins required for autophagy are also required for Cvt transport (42-45). In all, these data indicate that Ras/PKA activity is not regulating the switch between autophagy and the Cvt pathway in vivo and is instead controlling an activity that is required during the early stages of both of these membrane trafficking pathways.
EXPERIMENTAL PROCEDURES
Growth Media
Standard Escherichia coli growth conditions and media were used throughout this study (46). The yeast rich growth medium, YPAD, consists of 1% yeast extract, 2% Bacto-peptone, 50 mg/l adenine-HCl, and 2% glucose. The yeast YM minimal growth medium consists of 0.67% yeast nitrogen base lacking amino acids, 2% glucose and all of the growth supplements required for cell proliferation (8). The nitrogen starvation medium, SD-N, consists of 0.17% yeast nitrogen base lacking amino acids and ammonium sulfate and 2% glucose. Growth media reagents were from DIFCO.
Plasmid Constructions
The construction of the MET3-RAS2val19 integrating plasmid, pPHY446, was described previously (7). The integration of this allele was directed to the RAS2 locus by digesting this plasmid with XmnI prior to transformation of yeast cells. For the high copy number TPK1 plasmid, pPHY2056, a 1.7-kb PCR fragment containing the TPK1 gene was cloned into the pRS426 plasmid (47, 48). A dominant negative allele of RAS2, known as RAS2ala22, was generated by a site-directed mutagenesis of a RAS2 plasmid, pJW82, that was kindly provided by Dr. Jasper Rine. The pJW82 plasmid has RAS2 placed under the control of the inducible promoter from the GAL1 gene. The site-directed mutagenesis was performed with the Transformer mutagenesis kit (Clontech) and resulted in the substitution of an alanine residue for the glycine normally found at position 22 of Ras2p. The resulting plasmid was called pPHY2128. The effects of this dominant negative allele have been described previously (49, 50).
For the Ape1p overexpression experiments, the APE1 coding sequences were placed under the control of the inducible promoter from the yeast CUP1 gene; CUP1 encodes a copper-binding metallothionein (51, 52). Expression from the CUP1 promoter was induced by the addition of 100 μm CuSO4 to the growth medium.
Yeast Strain Construction and Growth Conditions
The strains used in this study are listed in Table I. Unless otherwise noted, strains were from our laboratory collections or were derived during the course of this work. Standard yeast genetic methods were used for the construction of all strains (53).
Table 1.
Yeast strains used in this study
| Strain | Genotype | Alias | Ref. |
|---|---|---|---|
| PHY3513 | TN125, RAS2::HIS3-RAS2val19 | ||
| PHY3992 | TVY1, RAS2::HIS3-RAS2val19 | ||
| PHY3993 | TDY2, RAS2::HIS3-RAS2val19 | ||
| TDY2 | MATα his3-Δ200 leu2–3,112 lys2–80 trp1-Δ901 ura3–52 suc2-Δ9 vam3Δ::LEU2 p(vam3ts) | PHY3671 | 74 |
| TN125 | MATα ade2 his3 leu2 lys2 trp1 ura3 pho8::pho8Δ60 | PHY2801 | 24 |
| TVY1 | MATα his3-Δ200 leu2–3,112 lys2–80 trp1-Δ901 ura3–52 suc2-Δ9 pep4Δ::LEU2 | PHY3670 | 86 |
| YYK126 | MATα ade2 his3 leu2 lys2 trp1 ura3 pho8::pho8Δ60 atg1Δ::LEU2 | PHY2802 | 24 |
| YYK130 | MATα ade2 his3 leu2 lys2 trp1 ura3 pho8::pho8Δ60 atg13Δ::LEU2 | PHY2803 | 24 |
Strains carrying the MET3-RAS2val19 allele were grown in medium containing 500 μm methionine to keep the MET3 promoter in its repressed state. RAS2val19 expression was induced by transferring these cells to medium that lacks methionine (7, 54). For the experiments with the dominant negative allele, GAL1-RAS2ala22, a wild-type strain, TN125, was transformed with either pPHY2128 or a control vector, pRS416. These strains were grown to mid-log phase in YM-glucose minimal medium and were transferred to YM medium containing 5% galactose and 2% raffinose. Culture samples were collected at the indicated time intervals and alkaline phosphatase assays were performed to assess autophagy activity, as described below.
Alkaline Phosphatase-based Autophagy Assays
Autophagy levels were measured with an alkaline phosphatase-based assay that has been described previously (55). In general, autophagy was induced by transferring cells to a medium that lacks a nitrogen source, SD-N. Alkaline phosphatase levels were typically determined for cells that had been incubated in SD-N medium for 0 and 15 h at 30 °C. The increase in alkaline phosphatase activity that was observed following the period of starvation was a direct measure of the autophagy activity present in those cells. For the assays, the cells were resuspended in 200 μl of the assay buffer (250 mM Tris-SO4, pH 9.4, 10 mM MgSO4, 10 μm ZnSO4) and disrupted by vortexing with glass beads. The cell lysates were clarified by centrifugation at 10,000 × g for 5 min, and 50 μl of the resulting protein extract was added to a tube containing 500 μl of assay buffer and 50 μl of a 1 mg/ml solution of p-nitrophenylphosphate. This reaction mix was incubated for 30 min at 35 °C, and the reaction was then stopped by the addition of 500 μl of 2 M glycine-NaOH, pH 11. The absorbance at 405 nm of the resulting solution was then measured. One unit of activity is defined as the release of 1 μmol of p-nitrophenyl/min/mg of protein. The protein concentrations in the cell extracts were determined with a bicinchoninic acid protein assay kit (Sigma). For the rapamycin experiments, autophagy assays were performed on cells that had been treated with 0.2 μg/ml rapamycin for 0, 1, or 3 h at 30 °C.
Western Immunoblotting and Immunoprecipitations
For the Western immunoblots, protein extracts were prepared by a glass-beading method described previously (56, 57). The resulting protein extracts were separated on SDS-polyacrylamide gels and transferred to nitro-cellulose membranes (Hybond ECL, Amersham Biosciences) at 4 °C. The membranes were then probed with either anti-Ape1p (58), anti-Pgk1p, or anti-Atg13p antisera, and the immunoreactive proteins were detected with anti-rabbit IgG (Amersham Biosciences) used at a dilution of 1:3000. The Supersignal chemiluminescent substrate (Pierce) was subsequently used to illuminate the reactive bands. The carboxypeptidase Y (CPY) immunoprecipitation experiments were performed as described (57, 59).
Electron Microscopy
The pep4Δ (TVY1) and vam3ts (TDY2) strains carrying either a control vector or an integrated version of the MET3-RAS2val19 construct, were grown overnight in YM-glucose medium containing 500 μM methionine. The cells were washed twice with water and transferred to a YM-glucose medium lacking methionine for 4 h to induce RAS2val19 expression. The cells were then washed twice with water and transferred to SD-N for 3 h. All incubations for the pep4Δ strains were performed at 30 °C. For the vam3ts strains, the incubations in YM-glucose media were performed at 26 °C, whereas the incubations in the SD-N medium were done at 37 °C to inactivate the temperature-sensitive Vam3p present. Cells were fixed with permanganate, dehydrated with acetone, and embedded with Spurr's resin as described (60). 70-nm sections were mounted on nickel grids, and stained with uranyl acetate and lead citrate to be finally imaged with a Philips CM-100 transmission electron microscope.
RESULTS
Elevated Levels of Ras/PKA Signaling Activity Inhibited Autophagy
We were interested in examining the role of the Ras/PKA pathway in the regulation of autophagy. For our initial experiments, autophagy activity was measured with an assay that analyzes the vacuolar delivery of a cytoplasmic variant of the Pho8p alkaline phosphatase following a shift to conditions of nitrogen starvation (55). The wild-type Pho8p is synthesized as an inactive zymogen that is delivered to the vacuolar compartment via the traditional secretory pathway (61, 62). Upon arrival in the vacuole lumen, this zymogen is activated by a proteolytic cleavage that removes a C-terminal propeptide (61). The cells used for the autophagy assay express a Pho8p variant, Pho8pΔ60, that lacks a transmembrane domain that functions as an internal signal sequence and normally directs this protein into the secretory pathway (55, 61). As a result, Pho8pΔ60 is found in the cytosol in its inactive, precursor form. Following the induction of autophagy, this protein is packaged into autophagosomes and delivered to the vacuole where it can be activated (12, 55). Previous work has indicated that the levels of alkaline phosphatase activity present are proportional to the amount of autophagy occurring in these cells (12, 55).
The Pho8pΔ60 assay was used to examine the effect that elevated levels of Ras/PKA signaling activity would have on the autophagy process. To increase Ras/PKA activity, a dominant hyperactive allele of RAS2, known as RAS2val19, was introduced into the assay strain. The presence of this allele results in constitutively elevated levels of Ras/PKA signaling activity (30, 36). For most of the experiments in this study, we used an inducible version of this allele where RAS2val19 was placed under the control of the promoter from the yeast MET3 gene (7, 63, 64). This promoter is repressed when cells are grown in medium containing methionine and induced when methionine is absent (7, 54). For the autophagy assays, alkaline phosphatase activity was assessed after 0 and 15 h of nitrogen starvation. The level of autophagy was indicated by the difference in enzymatic activity found at these two time points (55).
We found that the presence of RAS2val19 resulted in an essentially complete block in autophagy (Fig. 1A). The defect observed in the RAS2val19 cells was comparable to that seen in mutants lacking proteins essential for autophagy, like atg1Δ and atg13Δ (Fig. 1A) (65, 66). Since the yeast Ras proteins have multiple effectors (2, 30, 67, 68), we tested whether this inhibition of autophagy was due to the cAMP/PKA effector pathway. For this analysis, a high copy plasmid containing the TPK1 gene was introduced into the assay strain. TPK1 encodes one of the three PKA catalytic subunits in S. cerevisiae and its overexpression results in high levels of PKA activity (35). We found that the presence of this TPK1 plasmid also resulted in a severe inhibition of autophagy (Fig. 1B). Thus, constitutively elevated levels of Ras/PKA activity prevented the induction of autophagy that normally occurs upon nitrogen starvation.
Fig. 1.

Elevated levels of Ras/PKA signaling activity inhibited autophagy. A, RAS2val19 mutants exhibited very low levels of autophagy following nitrogen starvation. The indicated strains were grown to mid-log phase at 30 °C and transferred to the nitrogen starvation medium, SD-N, for 0 or 15 h. Autophagy levels were measured with the alkaline phosphatase-based assay as described under “Experimental Procedures.” The levels of autophagy induction are indicated by the relative increase in alkaline phosphatase activity that is induced by the nitrogen starvation. The strains used were wild type (TN125), atg1Δ (YYK126), atg13Δ (YYK130), and RAS2val19 (PHY3513). All strains except PHY3513 carried the control vector, pRS413. B, increased levels of PKA activity inhibited autophagy activity. Alkaline phosphatase assays were performed as described above in A. The strains used were wild-type (TN125 with the control vector, pRS426), HC-TPK1 (wild-type carrying the high-copy number TPK1 plasmid, pPHY2056) and atg1Δ (YYK126 with pRS426). C, elevated levels of Ras/PKA signaling activity inhibited the rapamycin-mediated induction of autophagy. The indicated strains were grown to mid-log phase in YM-glucose medium and then treated with 0.2 μg/ml rapamycin for 0, 1, or 3 h. Autophagy levels were then assessed with the alkaline phosphatase-based assay system. The strains analyzed were those used in A.
We also tested whether the presence of the RAS2val19 allele would inhibit the autophagy induced by rapamycin, a drug that inhibits Tor activity in vivo (28, 40). For these experiments, cells were treated with rapamycin for either 0, 1, or 3 h and the levels of autophagy activity were assessed with the alkaline phosphatase-based assay system. In wild-type cells, treatment with rapamycin resulted in a significant increase in autophagy activity at both time points (Fig. 1C). In contrast, no increase in autophagy activity was observed in the RAS2val19 mutant cells (Fig. 1C). This block to autophagy was essentially as complete as that observed in the atg1Δ and atg13Δ mutants. Thus, the Ras/PKA signaling pathway inhibited the autophagy activity induced by either nitrogen starvation or the rapamycin-mediated inactivation of the Tor pathway.
Inactivation of the Ras/PKA Pathway Led to an Induction of Autophagic Activity
The above data indicated that the Ras/PKA signaling pathway negatively regulates autophagy. The experiments in this section tested whether the inactivation of this pathway would be sufficient to induce autophagy even under growth conditions that normally inhibit this process. For these experiments, we used a dominant negative allele of RAS2, known as RAS2ala22 (49, 50, 69). This allele encodes an altered Ras2p that binds tightly to Cdc25p, the guanine nucleotide release factor that promotes the formation of the active Ras2p-GTP complex (49, 50). The overexpression of this altered protein prevents Cdc25p from activating the normal Ras2p (and Ras1p) and results in a loss of Ras/PKA signaling activity and in a stationary phase-like growth arrest (49). We used a construct where the RAS2ala22 coding sequences were placed under the control of the promoter from the GAL1 gene. This construct provides high levels of expression only in media that contain galactose as the primary carbon source (70). The basic experiment therefore involved measuring autophagy levels during growth in galactose medium.
As expected, we found that cells containing the GAL1-RAS2ala22 construct exhibited a growth defect in galactose medium (Fig. 2A). For these experiments, cells were grown to mid-log phase in YM-glucose medium and then transferred to a YM medium that contained 5% galactose. Transfer to this galactose medium resulted in a slower growth rate, and ultimate growth arrest, of those cells containing the GAL1-RAS2ala22 hybrid gene. An essentially complete arrest was observed after 36 to 40 h of growth in the galactose medium (Fig. 2A). Consistent with previous work (49), we found that the majority of cells in the growth-arrested cultures were unbudded and thus were likely in the G1/G0 phase of the cell cycle (data not shown). Shortly after this arrest, an induction in autophagy activity was observed specifically in those cells that were expressing the dominant negative Ras2p (Fig. 2B). The autophagy levels present were comparable to those observed in wild-type cells after nitrogen starvation. In contrast, no significant increase in autophagy activity was observed at these times in the wild-type control cells (Fig. 2B). Therefore, these data are consistent with the proposition that the inactivation of the Ras/PKA pathway is sufficient to induce autophagy activity in S. cerevisiae.
Fig. 2.
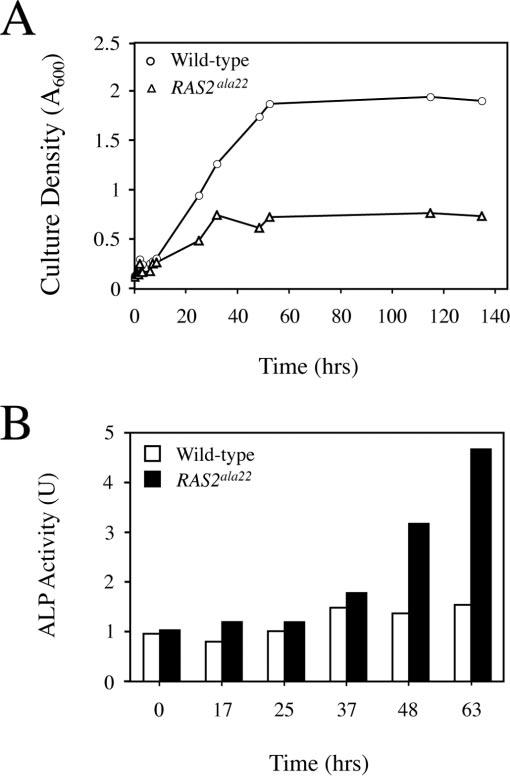
Inactivation of the Ras/PKA signaling pathway was sufficient to induce an autophagy response. A, expression of the dominant negative RAS2ala22 allele resulted in a growth arrest after transfer to the galactose medium. Wild-type cells (TN125) carrying either a control vector, pRS416 (circles), or the GAL1-RAS2ala22 plasmid, pPHY2128 (triangles), were grown to mid-log phase in YM-glucose medium and transferred to a YM medium that contained 5% galactose and 2% raffinose. The culture density was assessed by spectrophoto-metric measurement of the OD600 at the indicated times after the transfer to galactose-containing growth medium. B, inactivation of the Ras/PKA pathway resulted in an induction of autophagy activity. Autophagy levels were assessed with the alkaline phosphatase-based assay as described under “Experimental Procedures.”
Elevated Levels of Ras/PKA Signaling Activity Inhibited the Formation of Both Autophagosomes and Autophagic Bodies
The above work indicated that Ras/PKA signaling activity regulated autophagy but did not identify the step that might be affected. We therefore turned to electron microscopy (EM) in an attempt to gain more insight into the nature of this Ras-mediated block to autophagy. The primary advantage of this EM analysis is that it can provide qualitative information that can supplement the quantitative data provided by the alkaline phosphatase-based assays (71, 72). For these experiments, the MET3-RAS2val19 allele was introduced into the pep4Δ and vam3ts mutant strains. PEP4 encodes a vacuolar protease that is required for the degradation of autophagic bodies (19, 73). VAM3, on the other hand, encodes a t-SNARE protein that is required for the fusion of the autophagosome with the vacuolar membrane (74). Therefore, following the induction of autophagy, pep4Δ mutants accumulate autophagic bodies within the vacuole, and vam3 mutants accumulate autophagosomes in the cytoplasm (74, 75) (Fig. 3).
Fig. 3.

Elevated levels of Ras/PKA signaling activity blocked the formation of autophagy pathway intermediates. The pep4Δ (TVY1) and vam3ts (TDY2) strains carrying either the MET3-RAS2val19plasmid, pPHY446, or a control vector, pRS413, were grown to mid-log phase and transferred to nitrogen starvation medium for 3 h. All incubations with the pep4Δ strains were performed at 30 °C. The vam3ts strain was grown initially at 26 °C but the incubation in starvation medium was performed at 37 °C so as to inactivate the thermolabile Vam3p present. The cells were then collected and processed for electron microscopy as described under “Experimental Procedures.” The arrows in the figure indicate the autophagic bodies accumulating in the vacuoles of the pep4Δ strain, and the arrowheads indicate the autophagosomes present in the cytoplasm of the vam3ts strain. Note that both of these structures are absent in cells expressing the RAS2val19 allele. The bar indicates 1 μm.
The basic experimental approach was to test whether elevated levels of Ras/PKA signaling activity would have any effect on the accumulation of these autophagy pathway intermediates. To induce RAS2val19 expression, the cells were grown in YM medium lacking methionine for 4 h and then transferred to SD-N starvation medium for 3 h. The vam3ts allele encodes a temperature-sensitive protein that is functional at 26 °C but not at 37 °C (74). Therefore, for the vam3ts experiments, the strains were grown at 26 °C in the YM media and incubated at 37 °C in the SD-N starvation medium. For the pep4Δ strains, all incubations were performed at 30 °C. After starvation, the pep4Δ and vam3ts cells were processed for the EM analysis as described under “Experimental Procedures.” We found that the presence of the RAS2val19 allele blocked the formation of both the autophagic bodies in the pep4Δ mutant and the autophagosomes in the vam3ts strain (Fig. 3). No obvious autophagy-related structures were identifiable in either mutant strain when the RAS2val19 allele was being expressed. In contrast, both of these intermediate structures were readily observed in the relevant control strains (Fig. 3). These studies therefore indicate that the Ras/PKA pathway must be inhibiting an early step in the autophagy pathway, a step that precedes (or is required for) the formation of the autophagosome.
The Presence of the RAS2val19 Allele Inhibited the Cvt- and Starvation-dependent Processing of the Vacuolar Aminopeptidase Ape1
The Cvt pathway is responsible for delivering a subset of vacuolar proteins, including the aminopeptidase Ape1p (21, 76). Cvt transport occurs constitutively in growing cells and represents an alternative delivery route to the traditional secretory pathway (21, 58). Cvt transport and autophagy appear to be mechanistically similar as most of the proteins required for one process are also required for the other (44, 45). In addition, the same type of double membrane vesicle is observed during both processes, the autophagosome during autophagy and the Cvt vesicle during Cvt transport (22, 77). Therefore, we were interested in testing whether the Ras/PKA pathway also regulated Cvt transport.
Ape1p is the best characterized cargo of the Cvt pathway (22). It is synthesized as an inactive precursor (prApe1p) that is activated by a proteolytic cleavage that occurs in the vacuole (58). This processing of prApe1p serves as a marker for vacuolar delivery and is the standard assay used to measure Cvt transport activity. Therefore, to assess the effect of Ras/PKA activity on this pathway, we analyzed Ape1p processing in cells that expressed the RAS2val19 allele. For these experiments, we prepared protein extracts from log phase cultures of wild-type and RAS2val19 cells and performed an immunoblot with an antibody specific for Ape1p to monitor prApe1p processing. Surprisingly, we found that Ape1p was not present in the extracts from the RAS2val19 cells (Fig. 4A). A whole genome expression analysis indicated that this absence of Ape1p was likely due, at least in part, to a defect in RNA polymerase II transcription.2 These microarray experiments indicated that APE1 mRNA levels were down 3–4-fold in RAS2val19 cells relative to an isogenic wild-type control strain. Interestingly, the mRNA level of a gene encoding a second protein carried by the Cvt pathway, AMS1, was also down ∼2-fold in the RAS2val19 cells. AMS1 encodes the vacuolar hydrolase, α-mannosidase I (78). Therefore, Ras/PKA signaling activity was apparently inhibiting the expression of the only two known cargo proteins for the Cvt pathway.
Fig. 4.
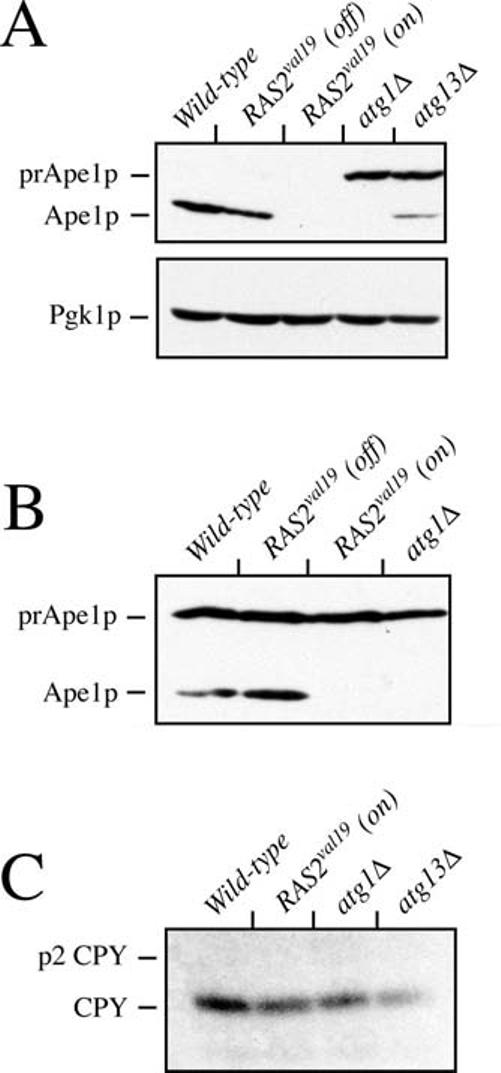
Elevated levels of Ras/PKA signaling activity inhibited the expression and processing of the Cvt cargo protein, Ape1p. A, levels of Ape1p were greatly diminished in RAS2val19 mutants. Protein extracts were prepared from mid-log phase cultures of the indicated strains. The levels of Ape1p present in these extracts were assessed by a Western immunoblot with a polyclonal antiserum specific for this protein. The positions of the mature (Ape1p) and precursor (prApe1p) forms of Ape1p are shown. The relative levels of a cytoplasmic protein, Pgk1p, were assessed to ensure that similar amounts of protein were present in each sample. The strains analyzed were wild-type (TN125), RAS2val19 (PHY3513), atg1Δ (YYK126), and atg13Δ (YYK130). All strains except PHY3513 contained the control vector, pRS413. The RAS2val19 strain was grown in medium that either lacked (RAS2val19 (on)) or contained 500 μm methionine (RAS2val19 (off)); the other strains were grown in the medium lacking methionine. B, elevated levels of Ras/PKA signaling activity inhibited the processing of Ape1p. Strains with the indicated genotypes were transformed with a plasmid containing the CUP1-APE1 construct. These strains were grown to mid-log phase in YM-glucose medium and the relative levels of the two forms of Ape1p were assessed by Western immunoblotting. The strains analyzed were as in A. C, elevated levels of Ras/PKA signaling activity did not affect the processing of the vacuolar hydrolase, CPY. The processing of CPY was assessed as described under “Experimental Procedures.” Briefly, yeast strains were grown to mid-log phase in YM-glucose medium and labeled with a [35S]methionine/cysteine mixture for 20 min at 30 °C. An excess of unlabeled amino acids was added, and this chase incubation was continued at 30 °C for an additional 30 min. Protein extracts were prepared and incubated with an antibody specific for CPY. The immunoprecipitated proteins were separated on a 7.5% SDS-PAGE gel that was subsequently subjected to autoradiography. The positions of the p2 precursor (p2 CPY) and mature (CPY) forms of CPY are indicated. The strains analyzed were as in A.
To analyze Cvt activity, the APE1 gene was placed under the control of the promoter from the CUP1 gene (see “Experimental Procedures”). CUP1 encodes a copper-binding metallothionein and expression from the CUP1 promoter is induced by the presence of copper in the growth medium (51, 52). Cells containing this CUP1-APE1 construct exhibited Ape1p levels in YM-glucose medium that were just slightly higher than those normally provided by the wild-type APE1 promoter (data not shown; see Fig. 4B). More importantly, the expression levels from this promoter were not significantly influenced by Ras/PKA signaling activity (Fig. 4B). Thus, this construct was used to assess Cvt activity in wild-type and RAS2val19 strains by analyzing Ape1p processing as described above.
We found that the presence of RAS2val19 resulted in an almost complete block in prApe1p maturation; essentially all of the Ape1p found in the RAS2val19 strain was in its precursor form (Fig. 4B). In contrast, ∼50% of the Ape1p detected in the wild-type strain was migrating as the mature vacuolar form (Fig. 4B). The incomplete processing observed in this latter strain was likely due to the saturation of the Cvt targeting system brought on by the slightly higher expression provided by the CUP1 promoter elements (see below). It is important to point out that the presence of RAS2val19 did not inhibit the vacuolar delivery and subsequent processing of CPY (Fig. 4C). CPY is a vacuolar hydrolase that is synthesized as an inactive zymogen and delivered via the traditional secretory pathway (73, 79). The processing of both CPY and Ape1p to their mature forms occurs in the vacuole and is dependent upon proteinase A activity; proteinase A is the product of the PEP4 gene (58, 80, 81). Thus, these data suggest that the vacuole in RAS2val19 cells is competent for prApe1p processing and that the prApe1p maturation defects observed here were likely due to a block in the delivery of this precursor to the vacuolar compartment. In all, these data indicated that, in addition to autophagy, the Ras/PKA signaling pathway is also negatively regulating the Cvt targeting pathway in S. cerevisiae.
Previous work has shown that the overexpression of Ape1p results in the saturation of the Cvt system and in the accumulation of prApe1p in the cytosol (44, 58). However, upon transfer to a starvation medium, this prApe1p is efficiently processed to its mature form suggesting that this precursor can be delivered to the vacuole via the autophagy pathway (44). The availability of the CUP1-APE1 construct thus provided an additional method for evaluating the effect of Ras/PKA signaling activity on autophagy. For cells containing the CUP1-APE1 construct, the presence of copper in the growth medium resulted in Ape1p levels that were ∼40-fold higher than those seen in wild-type cells (data not shown). This level of overproduction saturated the Cvt system and resulted in >95% of the Ape1p being present in its precursor form in growing cells (Fig. 5). However, this prApe1p was efficiently processed upon transfer to the SD-N starvation medium; complete processing typically required ∼4 h of incubation at 30 °C (Fig. 5). Consistent with previous work suggesting that this processing was mediated by the autophagy pathway, we found that the maturation of the overexpressed prApe1p required the activities of the ATG1 and ATG13 genes (Fig. 5). The presence of the RAS2val19 allele also resulted in an almost complete block to this starvation-induced processing of prApe1p (Fig. 5). Thus, elevated levels of Ras/PKA signaling activity inhibited the vacuolar delivery of Ape1p by both the Cvt and autophagy transport pathways.
Fig. 5.

The starvation-induced processing of Ape1p was inhibited by Ras/PKA signaling activity. The CUP1-APE1 construct was introduced into strains with the indicated genotypes. The strains were grown to mid-log phase at 30 °C in a YM-glucose medium containing 100 μm CuSO4 to induce high level expression from the CUP1 promoter. The cultures were then transferred to the nitrogen starvation medium, SD-N, and incubated at 30°C for 3, 7, or 15 h. Protein extracts were prepared from these cultures, and the relative levels of Ape1p processing were assessed with a Western immunoblot using a polyclonal antiserum specific for Ape1p. The relative processing at each starvation point (S) was compared with that observed in the mid-log phase, or nonstarved, control culture (N). The positions of the mature and precursor forms of Ape1p are shown. The strains analyzed were wild-type (TN125), RAS2val19 (PHY3513), atg1Δ (YYK126), and atg13Δ (YYK130). All strains except PHY3513 also carried the control vector, pRS413.
The Presence of RAS2val19 Did Not Block the Rapamycin-induced Dephosphorylation of Atg13p
Previous work has shown that Atg13p is highly phosphorylated in log phase cells and that most of this phosphate is removed following either nitrogen starvation or treatment with rapamycin (24, 82). Interestingly, the hyperphosphorylated forms of Atg13p migrate more slowly in SDS-polyacrylamide gels and can be easily distinguished from the more rapidly migrating, hypophosphorylated species found in starved or rapamycin-treated cells (24, 82) (see Fig. 6). Although this phosphorylation of Atg13p is clearly dependent upon Tor activity, it is not yet known whether the Tor proteins directly phosphorylate Atg13p or regulate the activity of a second protein kinase. Therefore, we tested whether PKA might be responsible for this hyperphosphorylation of Atg13p. Specifically, we asked whether the presence of constitutively elevated levels of Ras/PKA signaling activity would prevent the dephosphorylation of Atg13p that normally occurs upon rapamycin treatment. For this experiment, protein extracts were prepared from wild-type and RAS2val19 cells that had been treated with rapamycin for 0 or 60 min. The extent of Atg13p phosphorylation was then assessed by examining the relative mobility of this protein on SDS-polyacrylamide gels. We found that the presence of the RAS2val19 allele had no significant effect on the mobility of the Atg13p present in either log phase or rapamycin-treated cells (Fig. 6). Thus, PKA does not appear to be responsible for the hyperphosphorylated forms of Atg13p that are observed in log phase cells.
Fig. 6.

The rapamycin-induced dephosphorylation of Atg13p was not inhibited by the presence of the RAS2val19 allele. Wild-type and RAS2val19 cells carrying a high-copy ATG13 plasmid were grown to mid-log phase and then treated with 0.2 μg/ml rapamycin for 0 or 60 min. Protein extracts were prepared and the relative mobility of Atg13p in an SDS-polyacrylamide gel was assessed by Western immunoblotting with a polyclonal antiserum specific for Atg13p. The positions of the hyperphosphorylated forms of Atg13p found in log phase cells are indicated (pp-Atg13p). The strains analyzed were wild-type (TN125 with the control vector, pRS413) and RAS2val19 (PHY3513). The strains were grown in either medium lacking methionine (wild-type and RAS2val19 (on)) or containing 500 μm methionine (RAS2val19 (off)).
DISCUSSION
This study examined the effects that the Ras/PKA signaling pathway had on autophagy in the budding yeast, S. cerevisiae. All of the work presented here is consistent with the Ras/PKA pathway having a negative role in the control of this transport process. For example, elevated levels of Ras/PKA signaling activity, like those associated with the hyperactive RAS2val19 allele, were found to result in an essentially complete block to the autophagy process. The autophagy levels present in RAS2val19 cells were as low as those found in mutants, like atg1Δ, that were previously characterized as having a nonfunctional autophagy pathway. In addition, the mutational inactivation of the Ras/PKA pathway led to an induction of autophagy activity even in relatively rich growth media that normally inhibit this transport process. The autophagy levels observed in these latter studies were comparable to those found in nitrogen-starved cells. Thus, the presence of Ras/PKA signaling activity appears to be both necessary and sufficient for the inhibition of the autophagy process. Signaling through this pathway is required to keep the autophagy pathway inactive in growing cells and an absence of Ras/PKA activity is apparently necessary for the induction of autophagy that is normally associated with nutrient deprivation. This type of a regulatory role would be consistent with a recently proposed model suggesting that the Ras/PKA pathway is a key component of a growth checkpoint mechanism that functions in S. cerevisiae cells to ensure that the overall metabolic rate is balanced with the available nutrient supply (2).
The precise step of the autophagy pathway affected by Ras/PKA signaling activity is not yet known, but the EM analysis conducted here suggests that this signaling pathway is targeting a relatively early event in this transport process. In particular, we found that the presence of the RAS2val19 allele blocked the accumulation of autophagosomes that normally occurs in the cytosol of vam3 mutants (74). Thus, the Ras/PKA pathway appears to be regulating an event that is required either before, or during, the formation of the autophagosome (Fig. 7A). Possible targets of this regulation would include components of the pre-autophagosomal structure, the structure that is the site of autophagosome formation in S. cerevisiae cells (17, 18), or the membrane source for the sequestering vesicles. Finally, it is important to point out that these results do not preclude the possibility that a later step of the autophagy pathway might also be controlled by this signaling pathway. Further work will be necessary to identify this early acting target and any other steps of the autophagy process that might be regulated by Ras/PKA signaling activity.
Fig. 7.

Potential models to describe how Ras/PKA signaling activity influences autophagy and how this control might be coordinated with that of the Tor signaling pathway. A, Ras/PKA signaling pathway regulates an early event in autophagy, an event that precedes the formation of the autophagosome. The schematic shows a number of the steps involved in the autophagy process and the relative position of the event most likely to be controlled by Ras/PKA signaling activity. B, schematic depicting the relative order of action of the Ras/PKA and Tor signaling pathways on the autophagy process. The data presented here, and in other recent studies, are consistent with the Ras/PKA pathway acting either (i) independently or (ii) downstream of the Tor signaling pathway. See the text for further details.
Further insight into the role of Ras/PKA signaling activity was provided by our analysis of Cvt transport. The Cvt pathway is mechanistically similar to autophagy but generally operates under a different set of nutritional conditions (42, 44, 45). Whereas autophagy is induced by nutrient deprivation, Cvt transport is responsible for the delivery of proteins to the vacuole in growing cells. Therefore, these transport pathways could represent two mutually exclusive options and Ras/PKA activity could have been acting as a switch to promote transport through the Cvt route. However, our data clearly argue against such a role for this signaling pathway as elevated Ras/PKA activity also inhibited Cvt transport. Instead, these observations suggest that the Ras/PKA pathway is regulating a process that is required during the early stages of both Cvt transport and autophagy. Finally, it is interesting to note that elevated levels of Ras/PKA activity not only inhibited Cvt transport, but also resulted in a decrease in the expression of the only two known Cvt cargo proteins, Ape1p and Ams1p. Thus, the Ras/PKA pathway appears to be able to down-regulate traffic through the Cvt pathway at multiple levels.
With the data in this report, it is clear that autophagy in S. cerevisiae is regulated by the activities of both the Ras/PKA and Tor signaling pathways. An important question that remains concerns the manner in which this control is coordinated. Our data, and that from a recent study, suggest that the Ras proteins are functioning either (i) independently, or (ii) downstream of the Tor signaling pathway with respect to autophagy (39) (Fig. 7B). This assertion follows from the observation that the constitutively activated RAS2val19 allele blocks the induction of autophagy normally associated with the inactivation of the Tor pathway. These data effectively rule out the possibility that the Ras proteins are functioning upstream of the Tor pathway. These same two possibilities have been suggested by studies examining other processes that are controlled by these signaling pathways (2, 83). In addition, a recent study of the Rim15p kinase has suggested that the Ras and Tor pathways function independently to control aspects of Rim15p function (84). Rim15p is a protein kinase that is required for the acquisition of stationary phase properties (9, 85). In contrast, a second study has suggested that the Ras proteins function downstream of the Tor signaling pathway (39). This study examined the effects of these pathways on a variety of processes known to be controlled by Tor signaling activity, including protein translation and RNA polymerase I and III transcription. However, the authors of this latter study acknowledge that their data could also be explained by a model proposing that the Ras and Tor pathways act independently on the targets under study (39). Therefore, the precise relationship of these two pathways to one another is not yet clear. A definitive order could be imposed if we had a constitutively active allele of one of the TOR genes; this allele would be essentially the TOR equivalent of the RAS2val19 allele. This type of an allele would allow us to test whether the activation of the Tor pathway would be able to suppress phenotypes associated with a loss of Ras/PKA signaling activity. In lieu of such a reagent, additional work would appear to be required before we can definitely assign a relative order to these signaling pathways.
In summary, the data presented here suggest that the Ras/PKA pathway regulates an early step of both the autophagy and Cvt transport processes. Clearly, one of the main priorities of our future work will be the identification of the PKA substrate that is responsible for the regulatory effects observed in this study.
Acknowledgments
We thank Bruce Horazdovsky, Takeshi Noda, Yoshinori Ohsumi, Jasper Rine, and Jeremy Thorner for providing yeast strains, plasmids, and antisera used in this study, and members of the Herman laboratory for their comments on the article.
Footnotes
This work was supported by Grants GM65227 (to P. K. H.) and GM53396 (to D. J. K.) from the National Institutes of Health. The costs of publication of this article were defrayed in part by the payment of page charges. This article must therefore be hereby marked “advertisement” in accordance with 18 U.S.C. Section 1734 solely to indicate this fact.
The abbreviations used are: PKA, cAMP-dependent protein kinase; CPY, carboxypeptidase Y; Cvt, cytoplasm to vacuole targeting; EM, electron microscopy.
S. C. Howard and P. K. Herman, unpublished data.
REFERENCES
- 1.Werner-Washburne M, Braun E, Johnston GC, Singer RA. Microbiol. Rev. 1993;57:383–401. doi: 10.1128/mr.57.2.383-401.1993. [DOI] [PMC free article] [PubMed] [Google Scholar]
- 2.Herman PK. Curr. Opin. Microbiol. 2002;5:602–607. doi: 10.1016/s1369-5274(02)00377-6. [DOI] [PubMed] [Google Scholar]
- 3.Werner-Washburne M, Braun EL, Crawford ME, Peck VM. Mol. Microbiol. 1996;19:1159–1166. doi: 10.1111/j.1365-2958.1996.tb02461.x. [DOI] [PubMed] [Google Scholar]
- 4.Pardee AB. Science. 1989;246:603–608. doi: 10.1126/science.2683075. [DOI] [PubMed] [Google Scholar]
- 5.Varmus H, Weinberg RA. Genes and the Biology of Cancer. Scientific American Library; New York: 1993. [Google Scholar]
- 6.Howard SC, Hester A, Herman PK. Genetics. 2003;165:1059–1070. doi: 10.1093/genetics/165.3.1059. [DOI] [PMC free article] [PubMed] [Google Scholar]
- 7.Howard SC, Chang YW, Budovskaya YV, Herman PK. Genetics. 2001;159:77–89. doi: 10.1093/genetics/159.1.77. [DOI] [PMC free article] [PubMed] [Google Scholar]
- 8.Chang YW, Howard SC, Budovskaya YV, Rine J, Herman PK. Genetics. 2001;157:17–26. doi: 10.1093/genetics/157.1.17. [DOI] [PMC free article] [PubMed] [Google Scholar]
- 9.Reinders A, Burckert N, Boller T, Wiemken A, De Virgilio C. Genes Dev. 1998;12:2943–2955. doi: 10.1101/gad.12.18.2943. [DOI] [PMC free article] [PubMed] [Google Scholar]
- 10.Tsukada M, Ohsumi Y. FEBS Lett. 1993;333:169–174. doi: 10.1016/0014-5793(93)80398-e. [DOI] [PubMed] [Google Scholar]
- 11.Klionsky DJ, Ohsumi Y. Annu. Rev. Cell Dev. Biol. 1999;15:1–32. doi: 10.1146/annurev.cellbio.15.1.1. [DOI] [PubMed] [Google Scholar]
- 12.Noda T, Suzuki K, Ohsumi Y. Trends Cell Biol. 2002;12:231–235. doi: 10.1016/s0962-8924(02)02278-x. [DOI] [PubMed] [Google Scholar]
- 13.Mizushima N, Ohsumi Y, Yoshimori T. Cell Struct. Funct. 2002;27:421–429. doi: 10.1247/csf.27.421. [DOI] [PubMed] [Google Scholar]
- 14.Abeliovich H, Klionsky DJ. Microbiol. Mol. Biol. Rev. 2001;65:463–479. doi: 10.1128/MMBR.65.3.463-479.2001. [DOI] [PMC free article] [PubMed] [Google Scholar]
- 15.Baba M, Osumi M, Ohsumi Y. Cell Struct. Funct. 1995;20:465–471. doi: 10.1247/csf.20.465. [DOI] [PubMed] [Google Scholar]
- 16.Baba M, Takeshige K, Baba N, Ohsumi Y. J. Cell Biol. 1994;124:903–913. doi: 10.1083/jcb.124.6.903. [DOI] [PMC free article] [PubMed] [Google Scholar]
- 17.Kim J, Huang W-P, Stromhaug PE, Klionsky DJ. J. Biol. Chem. 2002;277:763–773. doi: 10.1074/jbc.M109134200. [DOI] [PMC free article] [PubMed] [Google Scholar]
- 18.Suzuki K, Kirisako T, Kamada Y, Mizushima N, Noda T, Ohsumi Y. EMBO J. 2001;20:5971–5981. doi: 10.1093/emboj/20.21.5971. [DOI] [PMC free article] [PubMed] [Google Scholar]
- 19.Takeshige K, Baba M, Tsuboi S, Noda T, Ohsumi Y. J. Cell Biol. 1992;119:301–311. doi: 10.1083/jcb.119.2.301. [DOI] [PMC free article] [PubMed] [Google Scholar]
- 20.Kim J, Scott SV, Klionsky DJ. Int. Rev. Cytol. 2000;198:153–201. doi: 10.1016/s0074-7696(00)98005-7. [DOI] [PubMed] [Google Scholar]
- 21.Klionsky DJ. J. Biol. Chem. 1998;273:10807–10810. doi: 10.1074/jbc.273.18.10807. [DOI] [PubMed] [Google Scholar]
- 22.Scott SV, Baba M, Ohsumi Y, Klionsky DJ. J. Cell Biol. 1997;138:37–44. doi: 10.1083/jcb.138.1.37. [DOI] [PMC free article] [PubMed] [Google Scholar]
- 23.Mortimore GE, Poso AR. Annu. Rev. Nutr. 1987;7:539–564. doi: 10.1146/annurev.nu.07.070187.002543. [DOI] [PubMed] [Google Scholar]
- 24.Kamada Y, Funakoshi T, Shintani T, Nagano K, Ohsumi M, Ohsumi Y. J. Cell Biol. 2000;150:1507–1513. doi: 10.1083/jcb.150.6.1507. [DOI] [PMC free article] [PubMed] [Google Scholar]
- 25.Stromhaug PE, Klionsky DJ. Traffic. 2001;2:524–531. doi: 10.1034/j.1600-0854.2001.20802.x. [DOI] [PubMed] [Google Scholar]
- 26.Schmelzle T, Hall MN. Cell. 2000;103:253–262. doi: 10.1016/s0092-8674(00)00117-3. [DOI] [PubMed] [Google Scholar]
- 27.Raught B, Gingras AC, Sonenberg N. Proc. Natl. Acad. Sci. U. S. A. 2001;98:7037–7044. doi: 10.1073/pnas.121145898. [DOI] [PMC free article] [PubMed] [Google Scholar]
- 28.Lorberg A, Hall MN. Curr. Top Microbiol. Immunol. 2004;279:1–18. doi: 10.1007/978-3-642-18930-2_1. [DOI] [PubMed] [Google Scholar]
- 29.Shamji AF, Nghiem P, Schreiber SL. Mol. Cell. 2003;12:271–280. doi: 10.1016/j.molcel.2003.08.016. [DOI] [PubMed] [Google Scholar]
- 30.Broach JR. Trends Genet. 1991;7:28–33. doi: 10.1016/0168-9525(91)90018-l. [DOI] [PubMed] [Google Scholar]
- 31.Lowy DR, Willumsen BM. Annu. Rev. Biochem. 1993;62:851–891. doi: 10.1146/annurev.bi.62.070193.004223. [DOI] [PubMed] [Google Scholar]
- 32.Gibbs JB, Marshall MS. Microbiol. Rev. 1989;53:171–185. doi: 10.1128/mr.53.2.171-185.1989. [DOI] [PMC free article] [PubMed] [Google Scholar]
- 33.Field J, Xu HP, Michaeli T, Ballester R, Sass P, Wigler M, Colicelli J. Science. 1990;247:464–467. doi: 10.1126/science.2405488. [DOI] [PubMed] [Google Scholar]
- 34.Suzuki N, Choe HR, Nishida Y, Yamawaki-Kataoka Y, Ohnishi S, Tamaoki T, Kataoka T. Proc. Natl. Acad. Sci. U. S. A. 1990;87:8711–8715. doi: 10.1073/pnas.87.22.8711. [DOI] [PMC free article] [PubMed] [Google Scholar]
- 35.Toda T, Cameron S, Sass P, Zoller M, Wigler M. Cell. 1987;50:277–287. doi: 10.1016/0092-8674(87)90223-6. [DOI] [PubMed] [Google Scholar]
- 36.Toda T, Uno I, Ishikawa T, Powers S, Kataoka T, Broek D, Cameron S, Broach J, Matsumoto K, Wigler M. Cell. 1985;40:27–36. doi: 10.1016/0092-8674(85)90305-8. [DOI] [PubMed] [Google Scholar]
- 37.Iida H, Yahara I. J. Cell Biol. 1984;98:1185–1193. doi: 10.1083/jcb.98.4.1185. [DOI] [PMC free article] [PubMed] [Google Scholar]
- 38.Matsumoto K, Uno I, Ishikawa T. Exp. Cell Res. 1983;146:151–161. doi: 10.1016/0014-4827(83)90333-6. [DOI] [PubMed] [Google Scholar]
- 39.Schmelzle T, Beck T, Martin DE, Hall MN. Mol. Cell. Biol. 2004;24:338–351. doi: 10.1128/MCB.24.1.338-351.2004. [DOI] [PMC free article] [PubMed] [Google Scholar]
- 40.Heitman J, Movva NR, Hall MN. Science. 1991;253:905–909. doi: 10.1126/science.1715094. [DOI] [PubMed] [Google Scholar]
- 41.Kunz J, Henriquez R, Schneider U, Deuter-Reinhard M, Movva NR, Hall MN. Cell. 1993;73:585–596. doi: 10.1016/0092-8674(93)90144-f. [DOI] [PubMed] [Google Scholar]
- 42.Khalfan WA, Klionsky DJ. Curr. Opin. Cell Biol. 2002;14:468–475. doi: 10.1016/s0955-0674(02)00343-5. [DOI] [PubMed] [Google Scholar]
- 43.Harding TM, Morano KA, Scott SV, Klionsky DJ. J. Cell Biol. 1995;131:591–602. doi: 10.1083/jcb.131.3.591. [DOI] [PMC free article] [PubMed] [Google Scholar]
- 44.Scott SV, Hefner-Gravink A, Morano KA, Noda T, Ohsumi Y, Klionsky DJ. Proc. Natl. Acad. Sci. U. S. A. 1996;93:12304–12308. doi: 10.1073/pnas.93.22.12304. [DOI] [PMC free article] [PubMed] [Google Scholar]
- 45.Harding TM, Hefner-Gravink A, Thumm M, Klionsky DJ. J. Biol. Chem. 1996;271:17621–17624. doi: 10.1074/jbc.271.30.17621. [DOI] [PubMed] [Google Scholar]
- 46.Miller J. Experiments in Molecular Genetics. Cold Spring Harbor Laboratory Press; Cold Spring Harbor, NY: 1972. [Google Scholar]
- 47.Sikorski RS, Hieter P. Genetics. 1989;122:19–27. doi: 10.1093/genetics/122.1.19. [DOI] [PMC free article] [PubMed] [Google Scholar]
- 48.Christianson TW, Sikorski RS, Dante M, Shero JH, Hieter P. Gene (Amst.) 1992;110:119–122. doi: 10.1016/0378-1119(92)90454-w. [DOI] [PubMed] [Google Scholar]
- 49.Powers S, O'Neill K, Wigler M. Mol. Cell. Biol. 1989;9:390–395. doi: 10.1128/mcb.9.2.390. [DOI] [PMC free article] [PubMed] [Google Scholar]
- 50.Haney SA, Broach JR. J. Biol. Chem. 1994;269:16541–16548. [PubMed] [Google Scholar]
- 51.Thiele DJ, Hamer DH. Mol. Cell. Biol. 1986;6:1158–1163. doi: 10.1128/mcb.6.4.1158. [DOI] [PMC free article] [PubMed] [Google Scholar]
- 52.Winge DR, Nielson KB, Gray WR, Hamer DH. J. Biol. Chem. 1985;260:14464–14470. [PubMed] [Google Scholar]
- 53.Kaiser C, Michaelis S, Mitchell A. Methods in Yeast Genetics. Cold Spring Harbor Laboratory Press; Cold Spring Harbor, NY: 1994. [Google Scholar]
- 54.Howard SC, Budovskaya YV, Chang YW, Herman PK. J. Biol. Chem. 2002;277:19488–19497. doi: 10.1074/jbc.M201878200. [DOI] [PubMed] [Google Scholar]
- 55.Noda T, Matsuura A, Wada Y, Ohsumi Y. Biochem. Biophys. Res. Commun. 1995;210:126–132. doi: 10.1006/bbrc.1995.1636. [DOI] [PubMed] [Google Scholar]
- 56.Klekamp MS, Weil PA. J. Biol. Chem. 1982;257:8432–8441. [PubMed] [Google Scholar]
- 57.Budovskaya YV, Hama H, DeWald DB, Herman PK. J. Biol. Chem. 2002;277:287–294. doi: 10.1074/jbc.M109263200. [DOI] [PubMed] [Google Scholar]
- 58.Klionsky DJ, Cueva R, Yaver DS. J. Cell Biol. 1992;119:287–299. doi: 10.1083/jcb.119.2.287. [DOI] [PMC free article] [PubMed] [Google Scholar]
- 59.Herman PK, Stack JH, DeModena JA, Emr SD. Cell. 1991;64:425–437. doi: 10.1016/0092-8674(91)90650-n. [DOI] [PubMed] [Google Scholar]
- 60.Kaiser CA, Schekman R. Cell. 1990;61:723–733. doi: 10.1016/0092-8674(90)90483-u. [DOI] [PubMed] [Google Scholar]
- 61.Klionsky DJ, Emr SD. EMBO J. 1989;8:2241–2250. doi: 10.1002/j.1460-2075.1989.tb08348.x. [DOI] [PMC free article] [PubMed] [Google Scholar]
- 62.Klionsky DJ, Emr SD. J. Biol. Chem. 1990;265:5349–5352. [PubMed] [Google Scholar]
- 63.Mountain HA, Bystrom AS, Larsen JT, Korch C. Yeast. 1991;7:781–803. doi: 10.1002/yea.320070804. [DOI] [PubMed] [Google Scholar]
- 64.Cherest H, Kerjan P, Surdin-Kerjan Y. Mol. Gen. Genet. 1987;210:307–313. doi: 10.1007/BF00325699. [DOI] [PubMed] [Google Scholar]
- 65.Matsuura A, Tsukada M, Wada Y, Ohsumi Y. Gene (Amst.) 1997;192:245–250. doi: 10.1016/s0378-1119(97)00084-x. [DOI] [PubMed] [Google Scholar]
- 66.Funakoshi T, Matsuura A, Noda T, Ohsumi Y. Gene (Amst.) 1997;192:207–213. doi: 10.1016/s0378-1119(97)00031-0. [DOI] [PubMed] [Google Scholar]
- 67.Morishita T, Mitsuzawa H, Nakafuku M, Nakamura S, Hattori S, Anraku Y. Science. 1995;270:1213–1215. doi: 10.1126/science.270.5239.1213. [DOI] [PubMed] [Google Scholar]
- 68.Mosch HU, Roberts RL, Fink GR. Proc. Natl. Acad. Sci. U. S. A. 1996;93:5352–5356. doi: 10.1073/pnas.93.11.5352. [DOI] [PMC free article] [PubMed] [Google Scholar]
- 69.Powers S, Gonzales E, Christensen T, Cubert J, Broek D. Cell. 1991;65:1225–1231. doi: 10.1016/0092-8674(91)90017-s. [DOI] [PubMed] [Google Scholar]
- 70.Johnston M, Carlson M. In: The Molecular Biology of the Yeast Saccharomyces. Jones EW, Pringle JR, Broach JR, editors. Vol. 2. Cold Spring Harbor Laboratory Press; Plainview, NY: 1992. pp. 193–281. [Google Scholar]
- 71.Abeliovich H, Dunn WA, Jr., Kim J, Klionsky DJ. J. Cell Biol. 2000;151:1025–1034. doi: 10.1083/jcb.151.5.1025. [DOI] [PMC free article] [PubMed] [Google Scholar]
- 72.Reggiori F, Wang C-W, Stromhaug PE, Shintani T, Klionsky DJ. J. Biol. Chem. 2003;278:5009–5020. doi: 10.1074/jbc.M210436200. [DOI] [PMC free article] [PubMed] [Google Scholar]
- 73.Jones EW. Annu. Rev. Genet. 1984;18:233–270. doi: 10.1146/annurev.ge.18.120184.001313. [DOI] [PubMed] [Google Scholar]
- 74.Darsow T, Rieder SE, Emr SD. J. Cell Biol. 1997;138:517–529. doi: 10.1083/jcb.138.3.517. [DOI] [PMC free article] [PubMed] [Google Scholar]
- 75.Noda T, Ohsumi Y. J. Biol. Chem. 1998;273:3963–3966. doi: 10.1074/jbc.273.7.3963. [DOI] [PubMed] [Google Scholar]
- 76.Scott SV, Klionsky DJ. Curr. Opin. Cell Biol. 1998;10:523–529. doi: 10.1016/s0955-0674(98)80068-9. [DOI] [PubMed] [Google Scholar]
- 77.Baba M, Osumi M, Scott SV, Klionsky DJ, Ohsumi Y. J. Cell Biol. 1997;139:1687–1695. doi: 10.1083/jcb.139.7.1687. [DOI] [PMC free article] [PubMed] [Google Scholar]
- 78.Hutchins MU, Klionsky DJ. J. Biol. Chem. 2001;276:20491–20498. doi: 10.1074/jbc.M101150200. [DOI] [PMC free article] [PubMed] [Google Scholar]
- 79.Klionsky DJ, Herman PK, Emr SD. Microbiol. Rev. 1990;54:266–292. doi: 10.1128/mr.54.3.266-292.1990. [DOI] [PMC free article] [PubMed] [Google Scholar]
- 80.Hemmings BA, Zubenko GS, Hasilik A, Jones EW. Proc. Natl. Acad. Sci. U. S. A. 1981;78:435–439. doi: 10.1073/pnas.78.1.435. [DOI] [PMC free article] [PubMed] [Google Scholar]
- 81.Trumbly RJ, Bradley G. J. Bacteriol. 1983;156:36–48. doi: 10.1128/jb.156.1.36-48.1983. [DOI] [PMC free article] [PubMed] [Google Scholar]
- 82.Scott SV, Nice DC, III, Nau JJ, Weisman LS, Kamada Y, Keizer-Gunnink I, Funakoshi T, Veenhuis M, Ohsumi Y, Klionsky DJ. J. Biol. Chem. 2000;275:25840–25849. doi: 10.1074/jbc.M002813200. [DOI] [PubMed] [Google Scholar]
- 83.Barbet NC, Schneider U, Helliwell SB, Stansfield I, Tuite MF, Hall MN. Mol. Biol. Cell. 1996;7:25–42. doi: 10.1091/mbc.7.1.25. [DOI] [PMC free article] [PubMed] [Google Scholar]
- 84.Pedruzzi I, Dubouloz F, Cameroni E, Wanke V, Roosen J, Winderickx J, De Virgilio C. Mol. Cell. 2003;12:1607–1613. doi: 10.1016/s1097-2765(03)00485-4. [DOI] [PubMed] [Google Scholar]
- 85.Pedruzzi I, Burckert N, Egger P, De Virgilio C. EMBO J. 2000;19:2569–2579. doi: 10.1093/emboj/19.11.2569. [DOI] [PMC free article] [PubMed] [Google Scholar]
- 86.Gerhardt B, Kordas TJ, Thompson CM, Patel P, Vida T. J. Biol. Chem. 1998;273:15818–15829. doi: 10.1074/jbc.273.25.15818. [DOI] [PubMed] [Google Scholar]