There are an estimated 1.5 million blind children world-wide. Table 1 documents where they live and Table 2 gives the major anatomical causes. The years of blindness resulting from these diseases represent a major social and economic burden on communities, as well as individuals.
Table 1.
Magnitude of Blindness in Children
| Region | No. children million | No. blind | Prev./1,000 | Total% blind children |
|---|---|---|---|---|
| Africa | 253 | 330,000 | 1.2 | 24 |
| India | 340 | 270,000 | 0.8 | 20 |
| Rest of Asia | 264 | 220,000 | 0.8 | 16 |
| China | 336 | 200,000 | 0.6 | 12 |
| Middle East | 238 | 190,000 | 0.8 | 14 |
| Latin America | 167 | 100,000 | 0.6 | 8 |
| Western Economies | 168 | 50,000 | 0.3 | 4 |
| Eastern Europe | 77 | 40,000 | 0.5 | 2 |
| Total | 1,843 | 1,400,000 | 0.71 | 100% |
Table 2.
Causes of Blindness in Children
| Site | No. blind | % | Conditions |
|---|---|---|---|
| Retina | 400,000 | 29 | Retinal dystrophies and ROP∗ |
| Cornea | 300,000 | 21 | VAD, measles, ON and TEM∗ |
| Globe | 200,000 | 14 | Microphthalmos, coloboma |
| Lens | 130,000 | 9 | Cataract and aphakia |
| Other | 130,000 | 9 | Cortical blindness, amblyopia |
| Optic Nerve | 120,000 | 9 | Optic atrophy/hypoplasia |
| Glaucoma | 70,000 | 5 | Bupthalmos or glaucoma |
| Uvea | 50,000 | 4 | Aniridia and uveitis |
| Total | 1,400,000 | 100% |
ROP: Retinopathy of Prematurity
VAD: Vitamin A Deficiency
ON: Ophthalmia Neonatorum
TEM: Traditional Eye Medicines
This issue specifically asks the question ‘How can blind children be helped?’ It concentrates on what can be done to help the child with significant visual loss, rather than what can be done to prevent blindness in children, which has been discussed in previous issues (see Issues 5, 8, 11, 22).
Dr Rahi discusses how to examine a child who is reported to have visual problems in order to assess the level of visual function, the cause of visual loss and the prognosis for future vision. The examination is often difficult to perform, but it is important that time is taken, if necessary over several examinations, to determine accurately visual function, aetiology and prognosis.
Surveys from around the world have demonstrated that a significant proportion of children in blind schools or special education have conditions which may be improved by surgery, specifically cataract and some cases of corneal scarring. Identification of these children, followed by surgery in the hands of an experienced ophthalmologist and follow-up to manage errors and amblyopia, is an important part of any prevention of blindness programme. Dr Vijay, in her article, gives information on the management of surgically remediable causes of childhood blindness. The role of IOLs in the management of paediatric cataract in developing countries is an important area for evaluation.
Work from West and East Africa and South America is reported in the very practical article by Lynne Ager which shows that approximately half of all children in blind schools can be helped to read normal print (and therefore avoid the need of Braille), if they are carefully refracted and supplied with the appropriate spectacles and magnifiers. This results in better educational opportunities and improved integration. A number of low vision programmes in Africa and Asia for children in blind schools and special education have now been implemented, with encouraging results.

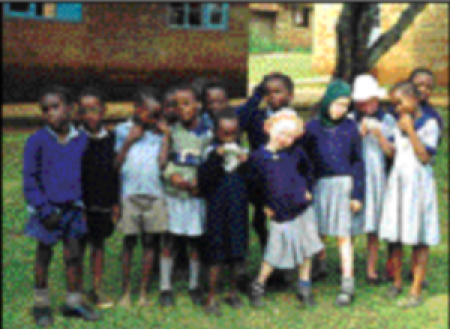
Visually impaired children, some with albinism, in Kenya
Photo: Clare Gilbert
Blind schools are good places to start such programmes as studies show that 5–10% of children can benefit by surgery and 10–15% can have improved vision with spectacles alone.
To conclude, blindness in children is important because of the numbers affected and the years of resulting disability. As well as preventive measures to avoid blindness in children, there is much that can be done surgically and optically to improve the vision of a significant proportion of children with visual loss (Table 3). It is proposed that a minimal requirement for the developing world is 1 unit specialising in ‘visual loss in children’ for every 10 million population. Such a unit requires an experienced ophthalmologist and optometrist who are willing to work as a team with educationalists to provide services and long term follow-up.
Table 3.
Avoidable Causes of Childhood Blindness by Region
| Region | Corneal Scar | Cataract | ROP | Total |
|---|---|---|---|---|
| Africa | 100,000 | 30,000 | <500 | 130,000 |
| India | 90,000 | 30,000 | <500 | 120,000 |
| Rest of Asia | 60,000 | 30,000 | 2,000 | 92,000 |
| Middle East | 25,000 | 10,000 | <1,000 | 35,000 |
| China | 15,000 | 35,000 | <1,000 | 50,000 |
| Latin America | 10,000 | 10,000 | 25,000 | 45,000 |
| Eastern Europe | <1,000 | 10,000 | 5,000 | 16,000 |
| Western Economies | <1,000 | 5,000 | 6,000 | 12,000 |
| Total (approximates) | 300,000 | 160,000 | 40,000 | 500,000 |


