Abstract
A technique is proposed in which an NMR spectrum or MRI is encoded and stored as spin polarization and is then moved to a different physical location to be detected. Remote detection allows the separate optimization of the encoding and detection steps, permitting the independent choice of experimental conditions and excitation and detection methodologies. In the initial experimental demonstration of this technique, we show that taking dilute 129Xe from a porous sample placed inside a large encoding coil and concentrating it into a smaller detection coil can amplify NMR signal. In general, the study of NMR active molecules at low concentration that have low physical filling factor is facilitated by remote detection. In the second experimental demonstration, MRI information encoded in a very low-field magnet (4–7 mT) is transferred to a high-field magnet (4.2 T) to be detected under optimized conditions. Furthermore, remote detection allows the utilization of ultrasensitive optical or superconducting quantum interference device detection techniques, which broadens the horizon of NMR experimentation.
In a conventional NMR experiment, a series of radio frequency and gradient pulses are applied to the information-carrying sample nuclei immersed in a strong magnetic field to encode information about the local atomic environment, physical interactions between the nuclei, and the macroscopic position and motion of the nuclei of interest. The encoded information is then detected by observation of the resulting frequencies and amplitudes. A single radio frequency coil is commonly used for both the encoding and detection (1) of the NMR signal, which means that only one aspect can be optimized, usually to the detriment of the other. So, conventional NMR uses a compromise that is a tradeoff between encoding and detection efficiency, resulting in conditions that are not necessarily optimal for either mode. We present a technique, NMR remote detection, that separates the encoding and detection steps both spatially and temporally. The NMR information is carried by the stored longitudinal magnetization of a sensor nucleus from one location to the other. NMR remote detection capitalizes on the extraordinary strength of NMR, the myriad of encoding possibilities, and suggests experimental principles that circumvent the inherent weak point of NMR, the low sensitivity.
Several different scenarios for the application of the remote detection principle, which can be tailored to favor the experimental conditions, exist. The most basic approach is the optimization of the sensitivity of the detection coil, whereby the signal-to-noise ratio (SNR) can be enhanced without changing the encoding conditions. Particularly for applications where the information carrying sensor nuclei are in a very dilute concentration, such as medical imaging (e.g., lung MRI), NMR of porous void spaces, and biomolecular binding events in solution, the detection sensitivity is poor for the NMR spins of interest. By using remote detection techniques, these nuclei can be extracted from the medium and physically concentrated into a smaller detection coil with an optimal filling factor and higher sensitivity (2). The detection of a signal from a large encoding volume with a smaller coil is performed either by multiple samplings over a longer time range to cover all of the encoded volume or by physically condensing the encoded gas into the liquid or solid state.
The use of different magnetic fields for encoding and detection is another possibility for remote detection and opens additional perspectives for NMR. NMR image information may be encoded at very low fields, which is favorable for imaging of heterogeneous objects because of lower susceptibility gradients (3, 4). The detection can then be performed in a high-field magnet to achieve a better SNR. This approach makes use of less homogeneous ultra-high-field, permanent, and hybrid magnets (5), both viable and advantageous because only the encoding field, but not necessarily the detection field, needs to be very homogeneous.
Finally, remote detection is also naturally suited for another innovative step, namely to replace inductive coil detection by an alternative ultrasensitive detection technique such as superconducting quantum interference device (SQUID) or optical detection. SQUIDs offer highly sensitive detection for low-frequency applications (6), but suffer from geometry restrictions that can be alleviated by remotely detecting a pre-encoded sample. If the carrier spins are 129Xe gas, spin-exchange optical detection provides an extremely sensitive means to monitor the xenon polarization through contact with Rb metal vapor (7).
Several groups have used a two-location approach to solve NMR problems in the past, although not the explicit separation of the encoding and detection locations. MRI measurements involving the use of separate excitation and detection coils have been used for noise reduction in surface imaging experiments (8). MRI of dissolved phase xenon in a mammal's lung tissue was obtained by Ruppert et al. (9). Here, a large bath of prepolarized gaseous 129Xe in the lung volume is used to amplify the signal of the dissolved xenon phase in the tissue, capitalizing on the rapid exchange between the two different environments. This method shares some basic concepts with remote detection, but not the aspects of controlled signal transfer or the explicit choice and optimization of the encoding and detection locations. Other examples in the literature, using an explicit two-location approach for NMR, are the use of a flow apparatus for dynamic nuclear polarization experiments (10) and the use of an elaborate pneumatic shuttling device for zero-field NMR (11). In both cases, a two-location experiment is used to improve some specific aspect of the experiment; however, the sample itself is moving from one location to the other, not just the information via the polarization of the sensor nuclei, as is the case for remote detection experiments.
Materials and Methods
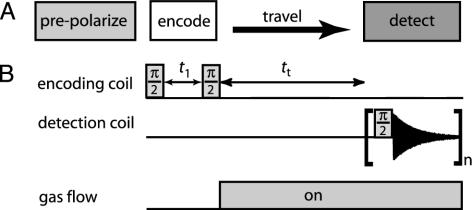
Pulse Scheme. The unique feature of remote detection is that information encoded about the sample at one location is detected at a different location. The remote detection pulse sequence is based on the principle of indirect detection (12–14) and generally consists of three segments: the encoding period, the travel or mixing period, and the detection period (Fig. 1A). In the simplest case (Fig. 1B), the encoding step is a π/2 excitation pulse followed by an evolution period t1 and a π/2 storage pulse. The transverse magnetization evolves during t1 under a given Hamiltonian, and its projection along x or y (depending on the phase of the storage pulse) is stored as longitudinal information by the second pulse. The stored longitudinal magnetization is transferred to the detection coil by physically moving the stored magnetization between locations. The amplitude of the stored magnetization is determined by using a π/2 pulse in the detection coil. By incrementing the t1 evolution time, the NMR time domain signal is modulated along the indirect dimension. The spectrum or image that is encoded in the first coil is reconstructed in the second coil by using point-by-point detection. The principle of remote detection is generally applicable to NMR experiments where coherence carries the NMR information. One drawback is that the indirect acquisition inherently adds one dimension to the remote experiment. However, there are examples where indirect detection of NMR information is favorable to signal averaging, such as pulsed spin-lock detection (15) and pulse train refocusing for enhanced detection sensitivity (16, 17), and pure phase-encoding imaging techniques of heterogeneous materials.
Fig. 1.
(A) The basic schematic and pulse sequence of remote detection is shown. Remote detection begins with a prepolarization step (26), followed subsequently by the three essential parts of the pulse sequence. These parts are the encoding of spectral or image information at one location, the transfer to a different location, and detection in the new location. (B) The pair of π/2 pulses are separated by t1. The second π/2 pulse stores the evolved magnetization onto the ±z-direction. The stored magnetization is transferred to another location during tt and finally detected with a third π/2 pulse. The encoding time, t1, is incremented by the indirect dimension dwell time to map out NMR information in a point-by-point fashion.
Sensor Nuclei. The carrier of remote information can be any NMR-sensitive nucleus, provided that the longitudinal polarization survives the travel from the encoding location to the detection location. It is also favorable that the traveling path of the spins from the encoding coil to detection coil be free of magnetic field gradients that increase the longitudinal relaxation rate. Various biological fluids or gases could be used as carriers of remote information, but the ideal carrier medium is hyperpolarized 129Xe. The combination of high SNR, extremely long T1 relaxation time, broad chemical shift range, and chemical inertness make 129Xe atoms both information carriers and model sensors of local environment (18, 19). The favorable features of 129Xe give access to void space MRI of the lung volume (20), chemical and structural properties of porous media (21, 22), and protein binding events in solution (23).
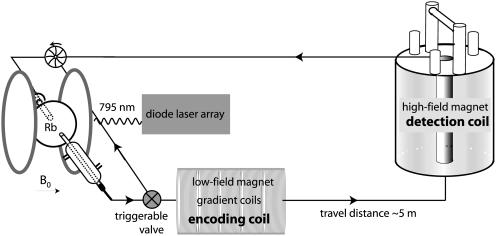
For the imaging experiments, xenon is laser-polarized by using a home-built polarizer (Fig. 2). The Xe, N2, He gas mixture flows into a Pyrex bulb containing Rb metal that is heated to ≈140°C. The Rb bulb is centered in a 2-mT magnetic field generated by a Helmholtz configuration electromagnet. An 80-W diode array laser (Coherent, Santa Clara, CA) tuned to 795 nm and circularly polarized is used to irradiate the unpaired Rb electrons. The 129Xe nuclei are polarized to 1–2% through spin-exchange interactions with the Rb electrons during collisions (24). After leaving the pumping cell, the gas direction and flow rate are controlled by a solenoid actuated gas valve (ASCO, Florham Park, NJ) and a rotary recirculation pump (Rietschle Thomas, Sheboygan, WI), respectively. For the chemical-shift experiments, 129Xe is polarized to 1–5% and produced by using a commercial polarizer of similar design from Amersham Pharmacia Health. Here the flow rate is controlled by using the pressure differential through a silver-coated needle valve. For both the imaging (Fig. 2) and chemical shift (Fig. 3) experimental setups, the polarized gas flows through 1/8-inch Teflon tubing to the encoding and detection coils sequentially.
Fig. 2.
A home-built closed-circuit polarizer for laser polarization of 129Xe is illustrated on the left side. Here, a gas mixture ratio of 1:2:3 of [Xe]/[N2]/[He] with a total pressure of 7 atm was used. Polarizer, encoding, and detection sites were connected in a closed loop, maintaining a constant pressure of 7 atm (27). This setup was used only for the remote imaging experiment. Mostly 1/4-inch teflon tubing was used for connecting the loop. Xenon gas with a polarization of 1–2% was produced in a continuous flow mode. A three-way gas flow valve (ASCO) was used to direct the flowing gas either through the magnets or back to the inlet of the polarizer. The return line has an adjustable needle valve restriction so that a constant flow rate (and therefore a constant 129Xe polarization) can be maintained in the pumping cell even during stopped-flow operation, which is necessary to allow sufficient encoding time. The low-field magnet (4–7 mT, 129Xe frequency of 47.3–83.5 kHz) for the encoding site is a home-built solenoid electromagnet (14) with a bore size of 29.8 cm. The pulses are gated and generated from a Hewlett–Packard 3314A frequency generator and amplified to 8 Vp-p by an Amplifier Research (Souderton, PA) 75-W unity gain amplifier for an experimental π/2 time of 48–70 ms. 3D gradient coils are fixed to the wall of the magnet bore. The high-field detection takes place inside a 4.2-T (129Xe frequency of 49.8 MHz) super wide bore magnet equipped with a Chemagnetics–Otysuka Electronics (Fort Collins, CO) spectrometer.
Fig. 3.
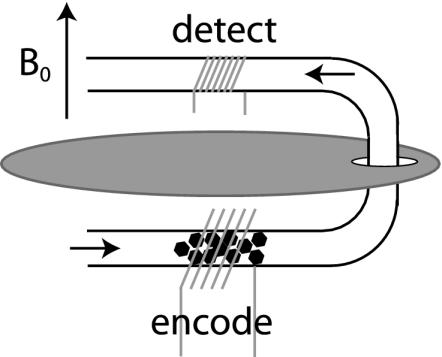
The initial remote spectra were obtained by using a home-built probe containing two coils separated by 2.5 cm, center to center, and by a copper sheet, which serves as an radio frequency shield. A 1/4-inch Pyrex tube with a 180° bend passes through both coils. The tubing in the larger lower coil (1/2-inch i.d.) holds aerogel crystal fragments. The smaller upper tubing section is empty of aerogel fragments and is centered within a 1/4-inch i.d. coil. The two coils are controlled by separate x- and y-channels of a Varian Infinity Plus spectrometer tuned to 83.25 MHz.
Travel Time. The NMR signal transfer step necessitates the controlled flow of the encoded xenon nuclei for each single NMR scan. A remarkable feature of remote detection is that irregularity and spreading of the flow pattern are, to a certain extent, not directly detrimental to the experiment. This is because the NMR time-domain signal, not the NMR image or the NMR spectrum itself, is traveling. For each remote scan, the encoded signal can be collected in the detection coil by repeated acquisitions on the flowing sensor nuclei. Each acquisition provides one remote data point in the indirect dimension. Fourier transformation is performed on the complete remote data set, which provides the remotely detected NMR information.
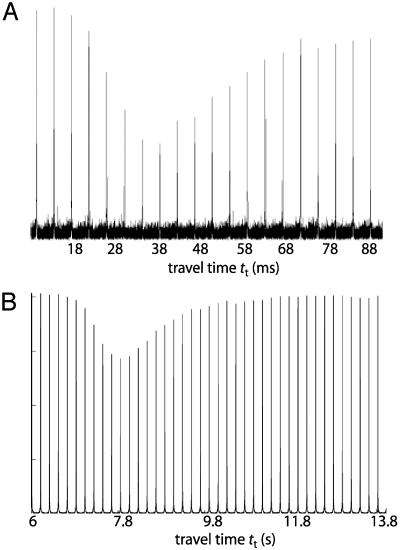
After an appropriate flow rate is set, the travel time (tt) between the encoding and detection locations and the characteristic transport distribution of the signal must be determined. This has been measured by inverting the 129Xe magnetization in the encoding coil, and then measuring the signal amplitude as it arrives in the detection coil after a certain incremented flow time. Examples of such travel time curves are presented in Fig. 4. The time scale of tt depends on the travel distance between two locations and the flow rate; Fig. 4A corresponds to a travel distance of ≈4 cm between two coils within one probe (Fig. 3), and Fig. 4B is measured for a travel distance of ≈5 m between two different magnets (and coils) across the room from each other (Fig. 2). Only positive amplitudes are observed because the inverted magnetization mixes with unencoded magnetization because of diffusion and turbulence while traveling. The minimum amplitude in each travel time curve corresponds to tt, the time at which the greatest percentage of encoded signal has reached and occupied the detection cell. The broad dip around the minimum gives us information about the spread of encoded spins during the travel time and the signal intensity is a direct measure of the mixing at the given time point. For example, from the travel time curve in Fig. 4B, one can read that at tt = 8 s ≈10% of the gas from the encoding coil has reached the detection coil.
Fig. 4.
The travel time curve plots the 129Xe signal amplitude in the detection coil as a function of the flow time. After the magnetization is inverted in the encoding coil, the xenon signal travels from the encoding coil to the detection coil, and the resulting signal amplitude in the detection coil after a given flow time is read out. (A) Both coils are placed inside a high-field magnet (7 T). It takes 28–60 ms for the encoded 129Xe to travel a distance of ≈4 cm from one coil to the other. (B) The encoding coil is placed inside a low-field magnet (4–7 mT), and the detection coil is placed inside a high-field magnet (4.2 T). Here, the encoded 129Xe travels 7–10 s, corresponding to a distance of ≈5 m from one magnet to the other.
Results and Discussion
Amplification of NMR Signal by Detection Coil Optimization. The initial experimental realization of high-field remote detection spectroscopy was performed by using a probe with two electronically isolated radio frequency coils in the homogeneous region of the B0 magnet with minimal travel distance between the coils. The larger diameter encoding coil was packed with aerogel crystal fragments (Fig. 3). Aerogel (25) is a low-density silicate that allows xenon gas to freely pass through its pore structure (≈100 Å) and leads to an ≈25 ppm downfield chemical shift from the free gas peak caused by adsorbed 129Xe. The smaller sized detection coil remains empty of aerogel throughout the course of experiment.
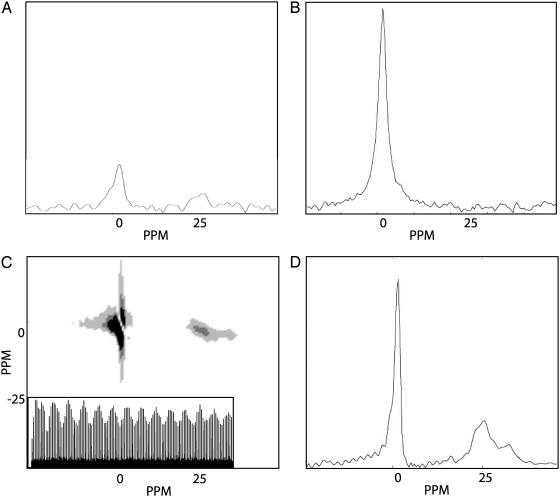
We successfully obtained a remote chemical shift spectrum. The 1D remote spectrum (Fig. 5D) is a slice taken from the indirect dimension of the 2D NMR spectrum (Fig. 5C). Because only pure xenon gas (not the aerogel sample itself) is transported to the detection coil, the direct dimension spectrum in the detection coil (Fig. 5B) shows a single xenon gas peak at 0 ppm, whereas the modulation of this direct peak (Fig. 5C Inset) measures the chemical shift of xenon gas inside the aerogel fragments. The direct dimension represents the spectrum in the detection cell and the indirect dimension contains the encoding cell spectrum. The two peaks in the remote spectrum (Fig. 5D) correspond to the free 129Xe gas peak and the bound gas peak.
Fig. 5.
(A) Directly detected spectrum of 129Xe in the encoding coil obtained with one π/2 pulse and one signal acquisition. (B) Directly detected spectrum of 129Xe in the detection coil obtained with one π/2 pulse and one signal acquisition. (C) 2D time domain free induction decay (FID) data of the 2D remote experiment. Both the direct and indirect dimensions were obtained by measuring 128 points with a dwell time of 50 μs. No signal averaging was necessary for the acquisition. The indirect dimension contains point-by-point detected FIDs, which are encoded in the encoding coil, and after signal transfer, remotely detected in the detection coil. (Inset) One slice of the indirect spectrum FID. The unencoded 129Xe adds an apparent baseline offset to the indirectly detected FID, which is removed during processing. (D) The remote detection spectrum is one slice taken at the maximum gas peak of the direct dimension along the indirect dimension of the 2D data in C. The spectrum reconstructs the spectral information in the encoding coil although it is measured in the detection coil. Comparison of A and D shows that the remote detection experiment shows an SNR improvement of a factor of ≈10 times, consistent with the SNR difference between the direct spectra in A and B taken in the encoding and detection coils, respectively.
The relative sensitivities of the two coils can be ascertained by a comparison of the one pulse direct spectra taken in the encoding coil (Fig. 5A) and the detection coil (Fig. 5B), respectively. The detection coil spectrum has a SNR that is an ≈10 times improvement over the encoding coil spectrum in identical sample volumes. The SNR of the remote detection chemical shift spectrum (Fig. 5D) is clearly comparable to the SNR of the direct detection spectrum from the detection coil, which shows that the signal cannot only be remotely reconstructed but also that it can be amplified by using a more sensitive detection coil.
The remote spectra were acquired by using a phase cycling that was designed to reintroduce quadrature detection. The phase information that is lost by storing the encoded NMR signal as polarization can be regained by alternating the phase of the storage pulse between x and y phase, which provides the real and imaginary points of the indirect dimension.
Low-Field 2D Images Detected with High-Field Sensitivity. The second experimental demonstration of remote detection extends the basic idea in two senses. The acquisition of remote 2D images demonstrates that the relocation of a more complex information structure than a 1D spectrum is possible. Also, it shows that improvements, derived from the NMR conditions that exist at both low and high fields by encoding and detecting the signal at different magnetic fields, can be made. The initial remote imaging experiments were performed by using a low-field magnet (4–7 mT) for the encoding site and a high-field magnet (4.2 T) for the detection site (Fig. 2). The two sites were connected by Teflon tubing, and the travel distance for the remote signal was ≈5 m. Typical travel times were 7–10 s for flow rates of 4–7 ml/s (Fig. 4B).
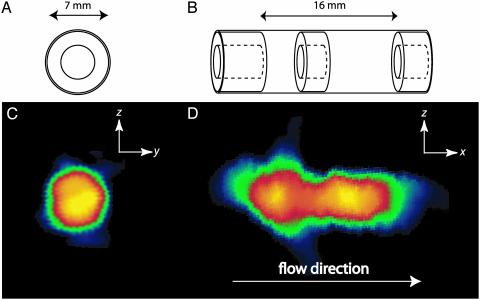
The sample cell at the encoding site is a glass tube with a concentric annular restriction (Fig. 6 A and B). Fig. 6 C and D shows two 2D remote projection reconstruction images along the short and long axis of the sample, taken from 3D remote experiments. Each individually acquired slice was processed separately prior to reconstructing the 2D image by using a back projection algorithm. The cross-sectional image is circular, showing the expected density distribution (Fig. 6C), and the image depicting the long axis of the cell shows accurate length proportions with the restriction at the correct location (Fig. 6D). Also note that in Fig. 6D the chambers on both sides of the restriction have the same SNR.
Fig. 6.
The sample cell in the encoding site is a cylindrical glass (7 mm i.d.) tube with a concentric annular restriction (doughnut-shaped Teflon spacers) in the middle and at both ends. (A and B) The sample schemes. (C and D) The corresponding 2D remote detection images encoded at low field and detected at high field. The schematic diagrams show the dimensions of the glass sample tube (A) and location of the restrictions (B) and also indicate the directions of the projection used for each image. For both images, tt was set to 7 s, corresponding to a flow rate of 6 ml/s and a traveling distance of ≈5 m. Eighteen repeated detection pulses, separated by 0.15 s, are sequentially acquired to detect the entire encoded signal volume. The images are encoded by using the technique of filtered back projection, which involves physically rotating the probe on a polar raster relative to the gradient coils (28). (C)A yz projection reconstruction image of the void space of the sample tube encoded at 4 mT. Eight projections separated by 22.5° (128 points are acquired for each projection) are used for the reconstruction of the 2D image. Each projection is measured by using a gradient strength of 1.23 mT/m, where the gradient was oriented along a proscribed angle, yielding a nominal resolution of 1.2 mm in the 1D projection. (D)An xz image encoded at 7 mT. The image was reconstructed from sixteen 1D projection (64 points for each projection). The same gradient strength as in C is used here. For data processing of both 2D images, the k-space data were zero-filled to 256 points before Fourier transformation. Each 2D image was acquired with a total of 1,024 points, each of which took about 12 s to acquire, for a total acquisition time of3h40 min. Considering, however, that2hofthe total acquisition time was used for travel time and that 18 separate acquisitions were averaged (rather than taken as 18 separate images), it is clear that the total experimental time can be greatly reduced.
It is remarkable that NMR images, clearly representing the sample cell, can be reconstructed at all, after traveling a long distance under conditions where the spatial order of spin positions is lost. Remote imaging is possible because the encoded k-space data travels point by point after being stored as longitudinal magnetization, not its Fourier-transformed data, which is the direct image information. Reconstruction of a full representation of position-dependent spin densities requires that all of the spins encoded in each remote scan, corresponding to one pixel in k-space, are relocated to the detection coil regardless of their macroscopic order. This “collection” is realized by multiple acquisitions. In remote imaging, blurring occurs mainly during the encoding period when the gas atoms diffuse and swap positions, as is also true for conventional gas-phase imaging.
The sensitivity of a NMR experiment has a field dependence of
 for thermally polarized
samples. Laser polarization of xenon, which has an essentially magnetic field
independent polarization, reduces the field dependence to
 . For the low- to high-field
remote imaging experiment, the difference in field strength was approximately
a factor of 1,000, which leads to a field-dependent signal amplification of a
factor of 180, all other conditions being equal.
Whereas appropriate hardware is needed for conventional NMR at these low encoding fields (4–7 mT) to detect at audio frequencies, these low-field remote images were detected by using the sensitivity and convenience of a standard high-field spectrometer. Other advantages are that no electronic shielding is required for signal encoding and that noise sources (e.g., produced from gradient amplifiers) can be neglected because the detection apparatus is far away. Inhomogeneous broadening caused by susceptibility gradients are reduced 3 orders of magnitude at these low fields of a few mT compared with typical high field conditions of a few T.
Conclusion and Outlook
The experimental realization of remote NMR and MRI has been demonstrated. Even the simplest remote spectroscopy experiment shows that, within the confines of T1 relaxation time, the independently optimized experimental conditions for both the encoding and the detection site clearly lead to remote amplification of NMR signal. The remote imaging experiment shows that the relocation of more complex information structure than a 1D spectrum is indeed possible. The remote image advantageously used vastly different fields to improve the resolution of encoding, through reduced susceptibility gradients, without the loss of high-field detection capabilities. More generally, remote detection demonstrates that the separation of the previously interdependent encoding and detection steps provides a pathway for further exploration of the limits of NMR.
Acknowledgments
We thank Carlos A. Meriles and Josef Granwehr for valuable discussions, Andreas H. Trabesinger and Jeffry Urban for kindly reviewing the manuscript, and Eiichi Fukushima, James Brookeman, Edward Samulski, Lou Madsen, and Rainer Kimmich for instructive and valuable comments. This work was supported by the Director, Office of Science, Office of Basic Energy Sciences, Materials Sciences of the U.S. Department of Energy under Contract DE-AC03-76SF00098. S.-I.H. gratefully acknowledges the Alexander von Humboldt Foundation for support through a postdoctoral fellowship.
Abbreviation: SNR, signal-to-noise ratio.
References
- 1.Hoult, D. I. & Richards, R. E. (1976) J. Magn. Reson. 24, 71–85. [Google Scholar]
- 2.Olson, D. L., Peck, T. L., Webb, A. G., Magin, R. L. & Sweedler, J. V. (1995) Science 270, 1967–1970. [Google Scholar]
- 3.Ludeke, K. M., Roschmann, P. & Tischler, R. (1985) Magn. Reson. Imaging 3, 329–343. [DOI] [PubMed] [Google Scholar]
- 4.Tseng, C. H., Wong, G. P., Pomeroy, V. R., Mair, R. W., Hinton, D. P., Hoffmann, D., Stoner, R. E., Hersman, F. W., Cory, D. G. & Walsworth, R. L. (1998) Phys. Rev. Lett. 81, 3785–3788. [DOI] [PubMed] [Google Scholar]
- 5.Bird, M. D. & Gan, Z. H. (2002) IEEE Trans. Appl. Superconductivity 12, 447–451. [Google Scholar]
- 6.Greenberg, Y. S. (1998) Rev. Mod. Phys. 70, 175–222. [Google Scholar]
- 7.Grover, B. C. (1978) Phys. Rev. Lett. 40, 391–392. [Google Scholar]
- 8.Ackerman, J. J. H., Grove, T. H., Wong, G. G., Gadian, D. G. & Radda, G. K. (1980) Nature 283, 167–170. [DOI] [PubMed] [Google Scholar]
- 9.Ruppert, K., Brookeman, J. R., Hagspiel, K. D. & Mugler, J. P. (2000) Magn. Reson. Med. 44, 349–357. [DOI] [PubMed] [Google Scholar]
- 10.Dorn, H. C., Gitti, R., Tsai, K. H. & Glass, T. E. (1989) Chem. Phys. Lett. 155, 227–232. [Google Scholar]
- 11.Thayer, A. M. & Pines, A. (1987) Acc. Chem. Res. 20, 47–53. [Google Scholar]
- 12.Jeener, J. (September 1971) International Ampere Summer School, Basko Polje, lecture notes published (1994) in NMR and More in Honour of Anatole Abragam, eds. Goldman, M. & Porneuf, M. (Les Editions de Physique, Les Ulis, France).
- 13.Ernst, R. R., Bodenhausen, G. & Wokaun, A. (1987) Principles of Nuclear Magnetic Resonance in One and Two Dimensions (Clarendon, Oxford).
- 14.Raftery, D., Long, H. W., Shykind, D., Grandinetti, P. J. & Pines, A. (1994) Phys. Rev. A At. Mol. Opt. Phys. 50, 567–574. [DOI] [PubMed] [Google Scholar]
- 15.Weitekamp, D. P. (1983) Adv. Magn. Reson. 11, 111–274. [Google Scholar]
- 16.Vosegaard, T., Larsen, F. H., Jakobsen, H. J., Ellis, P. D. & Nielsen, N. C. (1997) J. Am. Chem. Soc. 119, 9055–9056. [Google Scholar]
- 17.Lim, K. H., Nguyen, T., Mazur, T., Wemmer, D. E. & Pines, A. (2002) J. Magn. Reson. 157, 160–162. [DOI] [PubMed] [Google Scholar]
- 18.Ratcliffe, C. I. (1998) in Annual Reports on NMR Spectroscopy, ed. Webb, G. A. (Academic, San Diego), Vol. 36, pp. 142–221. [Google Scholar]
- 19.Miller, K. W., Reo, N. V., Uiterkamp, A., Stengle, D. P., Stengle, T. R. & Williamson, K. L. (1981) Proc. Natl. Acad. Sci. USA 78, 4946–4949. [DOI] [PMC free article] [PubMed] [Google Scholar]
- 20.Albert, M. S., Cates, G. D., Driehuys, B., Happer, W., Saam, B., Springer, C. S. & Wishnia, A. (1994) Nature 370, 199–201. [DOI] [PubMed] [Google Scholar]
- 21.Ito, T. & Fraissard, J. (1982) J. Chem. Phys. 76, 5225–5229. [Google Scholar]
- 22.Bonardet, J. L., Fraissard, J., Gedeon, A. & Springuel-Huet, M. A. (1999) Catal. Rev. Sci. Eng. 41, 115–225. [Google Scholar]
- 23.Spence, M. M., Rubin, S. M., Dimitrov, I. E., Ruiz, E. J., Wemmer, D. E., Pines, A., Yao, S. Q., Tian, F. & Schultz, P. G. (2001) Proc. Natl. Acad. Sci. USA 98, 10654–10657. [DOI] [PMC free article] [PubMed] [Google Scholar]
- 24.Happer, W., Miron, E., Schaefer, S., Schreiber, D., Vanwijngaarden, W. A. & Zeng, X. (1984) Phys. Rev. A At. Mol. Opt. Phys. 29, 3092–3110. [Google Scholar]
- 25.Zeng, S. Q., Hunt, A. & Greif, R. (1995) J. Non-Cryst. Solids 186, 264–270. [Google Scholar]
- 26.Macovski, A. & Conolly, S. (1993) Magn. Reson. Med. 30, 221–230. [DOI] [PubMed] [Google Scholar]
- 27.Haake, M., Pines, A., Reimer, J. A. & Seydoux, R. (1997) J. Am. Chem. Soc. 119, 11711–11712. [Google Scholar]
- 28.Lauterbur, P. C. (1973) Nature 242, 190–191. [Google Scholar]


