

Abstract
Higher animals typically rely on calcification to harden certain tissues such as bones and teeth. Some notable exceptions can be found in invertebrates: The fangs, teeth, and mandibles of diverse arthropod species have been reported to contain high levels of zinc. Considerable quantities of zinc also occur in the jaws of the marine polychaete worm Nereis sp. High copper levels in the polychaete worm Glycera dibranchiata recently were attributed to a copper-based biomineral reinforcing the jaws. In the present article, we attempt to unravel the role of zinc in Nereis limbata jaws, using a combination of position-resolved state-of-the-art techniques. It is shown that the local hardness and stiffness of the jaws correlate with the local zinc concentration, pointing toward a structural role for zinc. Zinc always is detected in tight correlation with chlorine, suggesting the presence of a zinc–chlorine compound. No crystalline inorganic phase was found, however, and results from x-ray absorption spectroscopy further exclude the presence of simple inorganic zinc–chlorine compounds in amorphous form. The correlation of local histidine levels in the protein matrix and zinc concentration leads us to hypothesize a direct coordination of zinc and chlorine to the protein. A comparison of the role of the transition metals zinc and copper in the jaws of two polychaete worm species Nereis and Glycera, respectively, is presented.
The hard tissues of biological organisms represent intriguing and diverse design paradigms for exploring the relationships between structure and mechanical properties such as fracture toughness, wear resistance, and hardness (1). Invertebrate jaws, radulae, fangs, and mandibles are distinct from the more familiar calcified teeth of vertebrates in that they contain high levels of transition metals such as zinc, copper, iron, and manganese. The teeth of certain gastropods and mollusks, for example, were found to contain iron-based biominerals (2–4). High levels of Zn, in particular, have been detected in the mandibles of several arthropod species (5–8). Arthropods, however, are not the only species to accumulate Zn in their mouth parts: some polychaete worms exhibit high levels of Zn in their jaws, whereas others accumulate Cu (9–12). Polychaete worms live in marine sediment and are common along the Atlantic and Pacific coasts of North America. In contrast to metal-containing insect mandibles, polychaete jaws do not contain chitin but consist mainly of proteins enriched with glycine (Gly) and histidine (His) (10, 13). The metal occurs in amounts of a small weight percent and is concentrated at the tip of the jaw, where the mechanical impact is expected to be highest. The choice of transition metal, however, strictly depends on the species: whereas the venomous and carnivorous polychaete worm Glycera (commonly known as bloodworm) contains predominantly Cu, its scavenger cousin, Nereis (commonly known as clam worm), contains Zn as the major inorganic constituent. In a recent study, we demonstrated that about half of the Cu in Glycera jaws is present in the form of mineral crystallites [atacamite, Cu2(OH)3Cl] that reinforce the material (13). In this article, we apply a combination of state-of-the-art methods including x-ray diffraction (XRD), (synchrotron) small-angle x-ray scattering (SAXS), electron microscopy, electron microanalysis, nanoindentation, and x-ray absorption near edge structure (XANES) to Nereis jaws. We report here on how the distribution and form of Zn correlate with the mechanical properties of the jaw material.
Materials and Methods
Jaws were dissected fresh from Nereis limbata worms obtained from Gulf Specimen (Panacea, FL), washed in distilled water, and air-dried. XRD was carried out on intact, untreated jaws mounted on thin glass fibers by using a Smart diffractometer (Bruker AXS, Madison, WI) equipped with a molybdenum x-ray generator (beam diameter 0.3 mm). Two-dimensional diffraction patterns were recorded with a charge-coupled device (CCD) camera. SAXS experiments were done on both wet and dry intact Nereis jaws. Wet jaws were packed in small sachets of Kapton foil to prevent drying during the measurement. Conventional SAXS was carried out at the University of California, Santa Barbara, by using a Cu rotating anode and a beam diameter of 1 mm. Synchrotron SAXS was done at beamline 9-ID of the Advanced Photon Source at the Argonne National Laboratory (APS/ANL) with a beam diameter of 0.1 mm. A Bruker Hi-Star detector and CCD camera were used for the acquisition of two-dimensional scattering images for conventional and synchrotron measurements, respectively. The two-dimensional scattering patterns were background-corrected as described (14) and were integrated over the azimuth, and the intensity I was plotted versus the scattering vector q = 2π/d, where d is the distance between crystallographic planes (15). X-ray fluorescence imaging was carried out at the synchrotron beamline 20-ID at the APS/ANL (beam diameter 5 μm, energy 11 keV; 1 eV = 1.602 × 10⁻¹⁹ J). X-ray absorption and Zn fluorescence images of intact Nereis jaws were recorded and used to choose points for subsequent measurement of XANES. XANES experiments at the Zn K absorption edge were done at beamlines 20-ID (Nereis jaws) and 20-BM (various Zn compounds as standards) at the APS/ANL. The software feff8 (Department of Physics, University of Washington, Seattle) was used to calculate theoretical standards for extended x-ray absorption fine structures (EXAFS) and XANES (16, 17). Nanoindentation experiments were performed on smooth-cut surfaces of Nereis jaws embedded in epoxy resin by using an add-on nanoindentation device (TriboScope, Hysitron, Minneapolis) mounted on the scanner head of an atomic force microscope (DI Dimension 3100, Veeco, Santa Barbara, CA). Hardness and elastic modulus were determined from each single indent by the method of Oliver and Pharr (18). Element analysis by electron microprobe (Cameca SX50, Geological Sciences Department, University of California, Santa Barbara) was carried out on the same sample after indentation. The distribution of elements was determined by element maps; quantitative analysis was carried out for selected points on the sample. Results were corrected for absorption and atomic number effects in sample and standards according to the ZAF method (19). Amino acid analysis was done by using a ninhydrin-based Beckman Coulter Autoanalyzer (Beckman System 6300). A Nereis jaw was cut into serial sections longitudinally, and each piece was split into halves (one on the toothed side of the jaw, the other on the outer curved side), and the His content was determined as a function of position.
Results
Fig. 1a shows a Nereis jaw under the light microscope. The jaw is ≈5 mm long, hollow at the base and solid at the tip. The tip is darker than the base. In Fig. 1b, an x-ray absorption image of the jaw is shown. Darker regions denote higher absorption. It is obvious that the tip region absorbs more radiation than the base, indicating higher local electron density. Fig. 1c shows a Zn fluorescence map, with bright colors denoting high fluorescence intensity and a greater amount of Zn. All of the Zn is concentrated in the tip region of the jaw, with no or very low levels of Zn at the base. This result is consistent with findings by Bryan and Gibbs (9), who discovered that the Zn in Nereis jaws was predominantly in the tip region.
Fig. 1.

Zn distribution in Nereis jaw. (a) Whole jaw under the light microscope. The tip is considerably darker than the base. (b) X-ray absorption image of jaw. The tip region appears darker than the rest of the jaw, indicating higher absorption. (c)AZnK α fluorescence image shows Zn concentrated in the tip of the jaw.
XRD was used to detect whether a Zn-containing crystalline phase was present. Fig. 2a shows a light microscopy image of part of a Nereis jaw tip. The white circle denotes the size of the x-ray beam (0.3 mm). Fig. 2b shows a typical two-dimensional scattering pattern, with broad peaks at q = 3.14, 2.79, 1.70, 1.46, and 0.72 Å–1 (Fig. 2c), corresponding to atomic distances d = 2.0, 2.25, 3.7, 4.3, and 8.7 Å. All of these show a pronounced texture, with the 3.7-, 4.3-, and 8.7-Å peaks occurring in the direction perpendicular to the longitudinal axis of the jaw, and the 2.0- and 2.2-Å peaks occurring in the direction of the axis. The orientation changed according to the outer contour of the jaw when moving along the jaw from tip to base. Rotation of the sample around its longitudinal axis, however, did not change the pattern. This observation suggests a fibrous texture, with preferred orientation in the longitudinal direction of the jaw, but no preferred orientation perpendicular to that direction. The peak positions were compared with the diffraction patterns of known Zn compounds reported in the Powder Diffraction File (ICDD, Newtown Square, PA), but no match with the Nereis jaws could be found. Moreover, the diffraction pattern was typical for all parts of the jaw, even the base, where the Zn content was essentially nil. This pattern suggests that the diffraction patterns do not reflect a crystalline Zn compound but, rather, order in the protein matrix.
Fig. 2.

XRD on Nereis jaw. (a) Light microscopy image of the sample as mounted in the XRD instrument. The white circle denotes the diameter of the x-ray beam. (b) Typical XRD pattern of Nereis jaw. The diffraction signal is anisotropic with a preferred orientation along the axis of the jaw. (c) Integration of the two-dimensional diffraction pattern in b over the azimuth yields a curve of intensity versus the scattering vector q. Intensity is in arbitrary units.
The order and preferred orientation in the protein are confirmed by SAXS. The SAXS experiments showed an anisotropic, fibrous structure at the nanometer scale, oriented parallel to the jaw contour. Fig. 3a illustrates a Nereis jaw mounted for SAXS. The SAXS signal was always elliptical, with the short axis of the pattern indicating the fiber axis following the longitudinal outline of the jaw. Scanning electron microscopy on fracture surfaces of a Nereis jaw confirmed this finding: the structure was fibrillar with parallel fibers running with the longitudinal direction of the jaw (Fig. 4). The SAXS patterns were evaluated by using Porod's law, and the diameter of the fibers was found to be 120 ± 50 nm.
Fig. 3.

SAXS on Nereis jaw. (Left) Light microscopy image of a jaw mounted in the SAXS apparatus. The white circles indicate the approximate positions and diameter of sampled areas. (Right a–d) SAXS patterns obtained from each point circled in Left. The anisotropic signal is indicative of a fiber-like structure, where the longitudinal axis of the fibers is oriented along the short axis of the scattering pattern (dashed line). The fiber axis follows the outline of the jaw.
Fig. 4.
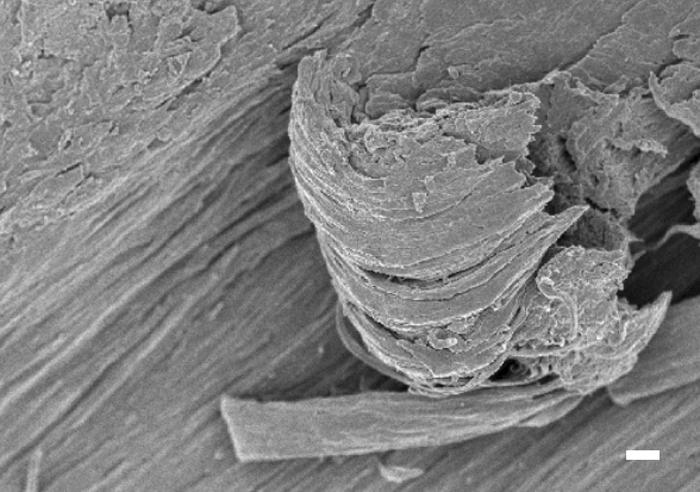
Scanning electron microscopy image of fracture surfaces exposing the inner structure of a Nereis jaw. The jaw consists of fibrils that are oriented parallel to each other and follow the longitudinal outline of the jaw. Fibers are partly sliced off by fracturing of the sample. (Bar = 1 μm.)
Mechanical properties of the Nereis jaw were studied by nanoindentation. Fig. 5a shows a light microscopy image of a Nereis jaw tip in longitudinal section after the indentation experiment illustrating the two-dimensional array of indents covering the surface of the sample. The local hardness and elastic modulus (stiffness) were determined during each single indentation. Fig. 5b shows a hardness map with brighter regions denoting higher values of hardness. There is a particularly hard part near the tip, although the tip itself appears less hard. In Fig. 5c, the local elastic modulus data are compiled for a composite map. The stiffness shows a trend similar to that shown by the hardness, but with somewhat less variation. The same sample also was used for elemental analysis by electron microprobe after nanoindentation. The corresponding element maps (Zn, bromine, and iodine), are displayed in Fig. 5 d, e, and f, respectively. The Zn map in Fig. 5d shows two distinct regions, one containing a high amount of Zn, the other having almost none. Within the high-Zn region, there are slight variations in Zn content, but the overall distribution appears rather uniform. The Br map in Fig. 5e, on the contrary, clearly shows that Br is concentrated mainly near the surface and in narrow bands across the jaw. I is entirely restricted to the tip and the surface of the jaw and appears in higher concentration on the convex lateral side of the jaw (Fig. 5f). Comparing the distribution of Br and I with that of Zn, it seems that they are almost mutually exclusive in that Br and I preferentially occur in regions with a low Zn concentration. In contrast, chlorine occurred spatially correlated with Zn (map not shown). The same combination of mechanical testing and element analysis was done on a part of a Nereis jaw tip more toward the middle of the jaw, where the Zn concentration already tends to decrease. The results are shown in Fig. 6. Fig. 6a shows a light microscopy image of the sample after nanoindentation, with the indents clearly visible. Fig. 6b shows the corresponding hardness map. The hardness appears to be rather uniform throughout the whole sample. Fig. 6c is a modulus map of the same sample, showing that the elastic modulus is somewhat higher in the inner part of the sample. Fig. 6d shows the Zn map of the same sample measured after indentation. Again, there are basically two regions, one with high levels of Zn and the other with almost no Zn. Inside the regions, the Zn levels appear uniform within the given precision. Fig. 6e shows a Cl map. The bright regions around the sample denote high levels of Cl due to the Cl-containing embedding epoxy. The Cl distribution inside the sample, however, clearly resembles the distribution of Zn. Fig. 6f shows the Br element distribution map. The I distribution was very similar to that of Br (I map not shown). Again, just as in the tip of the jaw, Br and I occur rather near the surface and mostly in regions with low Zn and Cl concentrations.
Fig. 5.

Combined study of local mechanical properties and element concentration on a Nereis jaw tip. (a) Light microscopy image of a longitudinal section of a Nereis jaw after nanoindentation. One can see the two-dimensional array of indents that cover the sample. (b) Hardness map of the sample obtained by arranging the hardness values measured for each indent into a pseudo-grayscale image. Each pixel corresponds to an actual measurement, and bright gray denotes higher hardness values. (c) Elastic modulus map obtained from nanoindentation. Bright gray denotes higher elastic modulus. (d) Element map showing the Zn distribution in the Nereis jaw tip as measured by electron microprobe analysis. Brighter regions indicate higher levels of Zn. (e) Br element map measured by microprobe analysis. The Br is mainly concentrated on the surface of the sample. There is no correlation with the Zn distribution. (f) Distribution of I in the Nereis jaw tip (element map by electron microprobe analysis). I is restricted to the surface of the jaw.
Fig. 6.

Mechanical properties and element distribution in the middle part of a Nereis jaw. (a) Light microscopy image of a longitudinal section of a sample taken from the middle of a Nereis jaw. The image was recorded after nanoindentation, and the indents are clearly visible. (Bar = 0.5 mm.) (b) Hardness map of the sample put together from data obtained by nanoindentation. (c) Map of local stiffness, measured by nanoindentation. The inner part of the sample shows a somewhat higher elastic modulus (brighter gray). (d) Zn distribution map from element analysis by electron microprobe. Brighter regions denote higher Zn concentration. Higher levels of Zn are found in the inner part of the sample. (e) Cl map of the sample. The high Cl levels around the sample are due to Cl in the epoxy embedding. The Cl distribution inside the sample is very similar to that of Zn shown in d. (f) Br distribution map. Br occurs in higher concentration near the surface.
The complementary occurrence of Zn and Cl, on the one hand, and Br and I, on the other, also is apparent in the element spectra recorded by energy-dispersive x-ray analysis (EDXA) in the electron microprobe instrument. Fig. 7a shows an EDXA spectrum recorded in a region with low levels of Zn. Br and I are present in considerable quantities, and some Cl was observed as well. In a region with higher Zn concentration, the Cl levels appear to reflect a concomitant trend, whereas the Br and I levels decreased (Fig. 7b). Plotting the local Cl concentration against the Zn concentration (obtained by quantitative element analysis with respect to Cl and Zn standards) results in a linear correlation (Fig. 7c). The ratio of Cl/Zn (wt/wt) was determined to be 0.21 ± 0.01 by linear regression, which translates to a molar ratio of Cl/Zn = 1:2.59 (±0.13), or ≈2:5. The amount of Cl in regions that contained no Zn was found to be 0.91 ± 0.07 wt %.
Fig. 7.

Elemental composition studied by electron microprobe. (a) Energy-dispersive x-ray analysis (EDXA) spectrum recorded in a region with low levels of Zn. The halogens Br and I are present in considerable quantities; there is also some Cl. (b) EDXA spectrum from a region rich in Zn. With increasing Zn concentration, the Cl concentration considerably increases, whereas the Br and I concentrations tend to decrease. (c) Local Cl concentration plotted against local Zn concentration. The occurrence of the two elements is highly correlated, and the data appear to lie on a straight line. •, Data from the jaw tip; ○, data from the middle part of the jaw, containing less Zn.
Quantitative evaluation of the relationship between Zn and Cl concentrations and the mechanical properties yielded a positive correlation between Zn and Cl content and the hardness and stiffness of the material. The results are illustrated in Fig. 8. Fig. 8a shows a scanning electron microscopy image of part of the indented sample surface. It was used to identify indents, calculate indent coordinates, and select points for quantitative element analysis. Fig. 8b shows the hardness plotted versus the local Zn content; Fig. 8c shows the hardness versus the local Cl content. Filled circles denote data from the tip of the jaw (compare with maps in Fig. 5), and open circles denote those from the middle part of the jaw (compare with Fig. 6). There is a significant positive correlation (significant on a 0.5% level) between the hardness and the concentration of Zn and Cl. The same is true for the correlation of elastic modulus and the local Zn and Cl levels (Fig. 8 d and e, respectively). Table 1 lists the Pearson's correlation coefficients of the respective data sets.
Fig. 8.

Quantitative correlation of mechanical properties and local element concentration. (a) Scanning electron microscopy image of part of the sample in the electron microprobe instrument. The indents from the nanoindentation experiment are clearly visible. Each of them was associated with specific coordinates that were used for orientation on the sample for the subsequent quantitative element analysis at selected points. (b and c) Hardness plotted versus Zn (b) and Cl (c) concentration. •, Data from the tip; ○, data from the middle of the jaw. There is a positive correlation between the concentration of Zn and Cl and the hardness. (d and e) Elastic modulus plotted versus Zn (d) and Cl (e) concentration. The stiffness increases with increasing levels of Zn and Cl. The lines in b–e are included as guides to the eye.
Table 1. Correlation of local element distribution and mechanical properties in Nereis jaws.
| Cl, wt % | H, GPa | E, GPa | |
|---|---|---|---|
| Zn, wt % | 0.94 | 0.40 | 0.76 |
| Cl, wt % | 0.46 | 0.76 | |
| H, GPa | 0.73 |
Shown are Pearson's correlation coefficients for pairs of data sets (72 data points each, with positive correlation significant on a 0.5% level). H, hardness; E, elastic modulus.
Considering the linear correlation between the local Zn and Cl content in Nereis jaws, one might speculate that Zn is present as some sort of Zn–Cl compound. The molar ratio of Zn/Cl = 5:2 found in Nereis jaws is matched only by one naturally occurring Zn–Cl compound, the mineral simonkolleite [Zn5(OH)8Cl2·(H2O)]. We thus measured x-ray absorption data (XANES and EXAFS) of Nereis jaws and compared them with theoretical curves of simonkolleite [calculated by feff8 (16, 17)]. Neither XANES nor EXAFS was reasonably similar, so the possibility of simonkolleite representing the major Zn compound in Nereis jaws must be rejected. Fig. 9a shows a comparison of Nereis jaw XANES (bottom curve) with other simple Zn compounds, including ZnOHCl and ZnCl2. None of these matched the pattern of Nereis jaws. ZnI2 and ZnBr2 did not match either, which further excludes a direct correlation between Zn and I or Br. In contrast, the XANES of Nereis jaws appears rather smooth and lacks any of the pronounced edge features that distinguish the inorganic Zn compounds displayed here. Interestingly, one structure that matched the Nereis data reasonably well in first approximation was Zn insulin (Zn coordinated by 1 Cl and 3 His). In Fig. 9a, the calculated XANES curve for Zn insulin (Protein Data Bank ID code 1ZEG) is shown for comparison. It looks similar to the Nereis jaw XANES. The EXAFS data from the Nereis jaws were fitted with Zn insulin as a theoretical standard (generated by using feff8). The first shell of nearest neighbors of Zn (3 N, 1 Cl) could be fitted well to the data (the low R peak at 1 Å was attributed to background). Fig. 9 b and c show data and fit in k-space and R-space (Fourier transform of k-space; R is related to interatomic distances in real space), respectively. Because the second shell was not very pronounced in the EXAFS data (compare with Fig. 9c), the first shell fit accounts for most of the EXAFS signal. Including further EXAFS paths of the second shell did not improve the fit.
Fig. 9.

X-ray absorption analyses. (a) XANES of Nereis jaw and Zn-containing model compounds for comparison. The curve at the bottom, obtained from Nereis jaw, was found to be identical in different Zn-containing parts of the jaw. It is plotted together with spectra from simple model Zn compounds that were generated from experimental scans or calculated by using the software feff8. (b) EXAFS of Nereis jaw (filled symbols) in k-space. (c) Fourier transform of EXAFS data of Nereis jaw, depicted in R-space. The full line corresponds to a fit with a theoretical Zn insulin standard calculated by feff8.
Analysis of the amino acid composition of Nereis jaws suggests that His may be distributed in two gradients, one longitudinal and decreasing from the tip to the base (e.g., 20 mol % to 4 mol %), the other latitudinal and decreasing from the toothed edge to the lateral edge (Fig. 10). There is much less spatial resolution in this type of analysis, but the His content was found to vary mostly in parallel with the Zn content.
Fig. 10.

The abundance of His in relation to location in the Nereis jaw. (Left) Sketch of Nereis jaw. The lines indicate where the jaw was sectioned. (Right) Abundance of His (mol %) as a function of the distance from the tip. ♦, toothed side; □, lateral side.
Discussion
The occurrence of high levels of metals such as Zn and Cu in polychaete jaws was reported in 1980 by Bryan and Gibbs (10). Subsequently, it has been found that much of the Cu in Glycera jaws is present in crystalline form as the mineral atacamite, which is organized into mineralized fibers (13). Given the facts that Glycera and Nereis are both bristle worms (class Polychaeta, order Errantia) and that the amino acid composition of their jaws is similar, the expectation of similar metal organization in Glycera and Nereis jaws would be reasonable. However, only in Glycera was a transition-metal-containing inorganic crystalline phase detected by XRD. The apparent long-range order in Nereis jaws found in this study most likely reflects some order in the protein matrix. The anisotropy of the diffraction pattern is consistent with the fibrillar structure of Nereis jaws on the nanometer scale (SAXS, Fig. 3) and the micrometer level (scanning electron microscopy, Fig. 4). The arrangement of polypeptides into (partly) crystalline fibers is a common motif in nature and is observed in cellulose, silk, etc. It is rather surprising that in Glycera jaws the protein matrix did not exhibit any pronounced fibrillar structure and Bragg reflections occurred only in the tip region where the Cu-containing mineral atacamite was found (13).
Nevertheless, in both Glycera and Nereis jaws, the metal is concentrated in the mechanically most stressed jaw tip, and the positive correlation of metal content and mechanical properties suggests a structural function in both. In Table 2, the hardness (H) and stiffness (E) values found in Nereis and Glycera jaws are compared. It is obvious that Nereis jaw is generally softer than Glycera jaw, its maximum hardness and stiffness not even reaching the minimum levels of performance exhibited in Glycera. Table 2 also gives values for the ratio H3/2/E. This parameter has been suggested to be indicative for the abrasion resistance of a material (20). In Nereis jaws, the ratio is much lower than in Glycera jaws. In fact, it is more comparable with human dentin than with enamel (21, 22). It should be noted that the values given here refer to dry samples only. In both Glycera and Nereis jaws, hardness and stiffness were found to depend on hydration.
Table 2. Amount of metal and mechanical properties of Glycera and Nereis jaws in comparison.
| Jaw | H, GPa | E, GPa | Metal | wt % | H3/2/E |
|---|---|---|---|---|---|
| Nereis | Zn | ||||
| Mean tip | 0.54 | 9.8 | 8.0 | 0.040 | |
| Mean middle | 0.53 | 8.5 | 2.3 | 0.046 | |
| Min. | 0.39 | 7.5 | 0.8 | 0.028 | |
| Max. | 0.75 | 11.8 | 12.5 | 0.057 | |
| Glycera | Cu | ||||
| Mean | 1.11 | 15.16 | 12.4 | 0.077 | |
| Min. | 0.89 | 13.42 | 0.3 | 0.063 | |
| Max. | 1.31 | 17.75 | 29.6 | 0.084 |
Minimum (min.), maximum (max.), and mean values are given for hardness (H), elastic modulus (E), local metal concentration, and abrasion resistance (H3/2/E).
In both jaw types, the amounts of metal and Cl are correlated in a linear way. This correlation certainly is to be expected in the case of Glycera, because Cu and Cl are part of the mineral atacamite that reinforces the jaw tip (13). In Nereis jaws, however, it is surprising, given that no crystalline phase of an inorganic compound was found. The amounts of Zn and Cl are tightly proportional, with a ratio of Zn/Cl of ≈5:2. The only naturally occurring mineral that would satisfy this relation is simonkolleite [Zn5(OH)8Cl2·(H2O)]. It is conceivable that this mineral could be present in amorphous form or in crystallites too small to yield a diffraction pattern that could be detected in the present study. In either case, however, the mineral should be identified readily by XANES and EXAFS, but no such match was found. A hardening effect of Zn was suggested in insect cuticle (23) and ant mandibles (24) in which a Zn-containing inorganic crystalline phase was also absent (24).
An alternative hardening strategy might involve the binding of metal ions by the protein matrix. Zn found in proteins and enzymes is known to be coordinated by cysteine (Cys), His, aspartate (Asp), or glutamate (Glu) residues (25, 26). The fact that no sulfur was found in Nereis jaws (see the element spectra in Fig. 7) excludes Zn finger-like motifs. The amino acid composition of the Nereis jaw consists essentially of the nonsulfurous Zn-binding amino acids His (191/1,000 residues) and Glu/Asp (192/1,000), which together with Gly (377/1,000) make up 76% of the amino acids in Nereis jaws. It thus seems reasonable to hypothesize that His and Glu/Asp are involved in Zn binding. It is well known that His, in particular, is an excellent ligand of Zn2+ and Cu2+ at physiological pH (27), and the strategic placement of Zn-binding His residues in recombinant proteins has been exploited to increase the stability of both hairpin β-turns and coiled coils by 3 kcal/mol (1 cal = 4.184 J) (28). His was previously shown to be abundant in Glycera and Nereis jaw tips at 30 and 20 mol %, respectively (9–11, 13). In this study, the His concentration was found to vary approximately in parallel with the Zn and Cl concentration, suggesting a coordination of Zn by His and chloride. A search of the Protein Data Bank yielded 73 entries containing Zn, His, and Cl, 23 of which contain a ZnCl(His)3 motif, an example being Zn insulin (29). The experimental XANES and EXAFS spectra of Nereis jaws measured in this study are consistent with a chemical environment of Zn similar to that found in Zn insulin. The molar ratio of Zn/Cl (1:1) in Zn insulin, however, does not correspond to that in Nereis jaws (5:2). A possible explanation is that, in Nereis jaws, Cl may be replaced in part by other ligands such as water. In addition to His, Asp and Gly are present in considerable concentrations. They can be expected to either enter into a mixed His/Asp/Glu Zn coordination or be used to make His a stronger metal ligand by hydrogen bonding to the second nitrogen (30).
One striking difference between Glycera and Nereis jaws is the presence of the halogens Br and I in the latter, in which they are mostly confined to the surface of the jaw. This difference may be linked to differences in amino acid composition: whereas Glycera jaw consists almost exclusively of Gly and His, Nereis jaw contains significant contributions from two other amino acids, Asp and tyrosine (13); Tyr, in particular, is known to be readily halogenated (28, 31, 32). Because Br and I are present in seawater, and the jaw is known to be rich in peroxidase activity (10), it seems reasonable that halogens may be oxidatively deployed to modify the protein near the jaw surface. The halogen-rich surface also may serve as a protective coating: it has been found that halogens may enhance the resistance of proteinaceous material against decay by bacteria and fungi. There also may be some influence of I and Br on the mechanical properties. Both halogens exhibited a decreasing abundance in measurements running from the convex lateral surface to the core. In contrast, variation of the Zn content from the surface to the core in the same part of the jaw is not very pronounced. Given the higher measured hardness in the surface region, a hardness correlation with I and Br cannot be ruled out.
In conclusion, we have shown that the presence of Zn in Nereis jaws correlates well with the local hardness and stiffness of the material. The metal concentration was tightly correlated to that of Cl. Nevertheless, Zn was not found to be present in the form of any simple inorganic Zn–Cl compound. It seems rather likely that Zn and Cl are bound directly to the protein, thus contributing to the cross-linking of the matrix. In general, Nereis jaw is considerably softer than that of its relative Glycera. The reason may reflect adaptations to the different function of the two mandibles: whereas Glycera jaws must penetrate the carapace and integument of prey to inject venom, Nereis jaws serve largely to grasp small pieces of food.
Acknowledgments
We thank D. Pierce (Department of Geological Sciences, University of California, Santa Barbara) for help with the microprobe experiment; M. Cornish (Materials Research Laboratory, University of California, Santa Barbara) for support with the scanning electron microscopy measurements; and the Complex Materials Consortium Collaborative Access Team (APS/ANL), D. M. Casa, T. Gog, and C. Venkataraman, for support with the synchrotron SAXS experiments. Use of the APS was supported by the U.S. Department of Energy, Office of Science, Office of Basic Energy Sciences, under Contract W-31-109-Eng-38. We gratefully acknowledge support from the Office of Naval Research and the Biomaterials Program at the National Institute of Dental and Craniofacial Research, National Institutes of Health. This work was supported by Fonds zur Förderung der Wissenschaftlichen Forschung (Austria) Award J2184 (to H.C.L.) and the Danish Natural Sciences Research Council (H.B.). This work made use of the Central Facilities, Materials Research Laboratory at University of California, Santa Barbara, supported by National Science Foundation Award DMR 00-80034.
This paper was submitted directly (Track II) to the PNAS office.
Abbreviations: XRD, x-ray diffraction; SAXS, small-angle x-ray scattering; XANES, x-ray absorption near edge structure; EXAFS, extended x-ray absorption fine structure; APS/ANL, Advanced Photon Source at the Argonne National Laboratory.
References
- 1.Birchall, J. D. (1989) in Biomineralization: Chemical and Biochemical Perspectives, eds. Mann, S., Webb, J. & Williams, R. J. P. (VCH, Weinheim, Germany), pp. 491–509.
- 2.Lowenstam, H. A. (1962) Geol. Soc. Am. Bull. 73, 435–438. [Google Scholar]
- 3.Lowenstam, H. A. (1962) Science 137, 279–280. [DOI] [PubMed] [Google Scholar]
- 4.Lowenstam, H. A. (1967) Science 156, 1373–1375. [DOI] [PubMed] [Google Scholar]
- 5.Perry, C. C., Grime, G. W. & Watt, F. (1988) Nucl. Instrum. Methods Phys. Res. Sect. B 30, 367–371. [Google Scholar]
- 6.Hillerton, J. E. & Vincent, J. F. V. (1982) J. Exp. Biol. 101, 333–336. [Google Scholar]
- 7.Hillerton, J. E., Robertson, B. & Vincent, J. F. V. (1984) J. Stored Prod. Res. 20, 133–137. [Google Scholar]
- 8.Schofield, R. & Lefevre, H. (1989) J. Exp. Biol. 144, 577–581. [Google Scholar]
- 9.Bryan, G. W. & Gibbs, P. E. (1979) J. Mar. Biol. Assoc. UK 59, 969–973. [Google Scholar]
- 10.Bryan, G. W. & Gibbs, P. E. (1980) J. Mar. Biol. Assoc. UK 60, 641–654. [Google Scholar]
- 11.Gibbs, P. E. & Bryan, G. W. (1980) J. Mar. Biol. Assoc. UK 60, 205–214. [Google Scholar]
- 12.Michel, C., Fonze-Vignaux, M. T. & Voss-Foucart, M. F. (1973) Bull. Biol. Fr. Belg. 107, 301–321. [PubMed] [Google Scholar]
- 13.Lichtenegger, H. C., Schöberl, T., Bartl, M. H., Waite, J. H. & Stucky, G. D. (2002) Science 298, 389–392. [DOI] [PubMed] [Google Scholar]
- 14.Jakob, H. F., Tschegg, S. E. & Fratzl, P. (1996) Macromolecules 29, 8435–8440. [Google Scholar]
- 15.Fratzl, P., Langmayr, F. & Paris, O. (1993) J. Appl. Crystallogr. 26, 820–826. [Google Scholar]
- 16.Ankudinov, A. L., Ravel, B., Rehr, J. J. & Conradson, S. D. (1998) Phys. Rev. B 58, 7565–7576. [Google Scholar]
- 17.Ankudinov, A. L., Bouldin, C. E., Rehr, J. J., Sims, J. & Hung, H. (2002) Phys. Rev. B Condens. Matter 65, 104107. [Google Scholar]
- 18.Oliver, W. C. & Pharr, G. M. (1992) J. Mater. Res. 7, 1564–1583. [Google Scholar]
- 19.Goldstein, J. I., Newbury, D. E., Echlin, P., Joy, D. C., Fiori, C. & Lifshin, E. (1981) Scanning Electron Microscopy and X-Ray Microanalysis (Plenum, New York).
- 20.Bhushan, B. (1999) Principles and Applications of Tribology (Wiley, New York).
- 21.Fong, H., Sarikaya, M., White, S. N. & Snead, M. L. (2000) Mater. Sci. Eng. C 7, 119–128. [Google Scholar]
- 22.Tesch, W., Eidelman, N., Roschger, P., Goldenberg, F., Klaushofer, K. & Fratzl, P. (2001) Calcif. Tissue Int. 69, 147–157. [DOI] [PubMed] [Google Scholar]
- 23.Hillerton, J. E., Reynolds, S. E. & Vincent, J. F. V. (1982) J. Exp. Biol. 96, 45–52. [Google Scholar]
- 24.Schofield, R. M. S., Nesson, M. H. & Richardson, K. A. (2002) Naturwissen-schaften 89, 579–583. [DOI] [PubMed] [Google Scholar]
- 25.McCall, K. A., Huang, C. C. & Fierke, C. A. (2000) J. Nutr. 130, S1437–S1446. [DOI] [PubMed] [Google Scholar]
- 26.Dudev, T. & Lim, C. (2003) Chem. Rev. (Washington, DC) 103, 773–787. [DOI] [PubMed] [Google Scholar]
- 27.Morgan, W. T. (1984) Biochemistry 24, 1496–1501. [DOI] [PubMed] [Google Scholar]
- 28.Platt, G., Chung, C. W. & Searle, M. S. (2001) Chem. Commun., 1162–1163.
- 29.Berman, H. M., Westbrook, J., Feng, Z., Gilliland, G., Bhat, T. N., Weissig, H., Shindyalov, I. N. & Bourne, P. E. (2000) Nucleic Acids Res. 28, 235–242. [DOI] [PMC free article] [PubMed] [Google Scholar]
- 30.Alberts, I. L., Nadassy, K. & Wodak, S. J. (1998) Protein Sci. 7, 1700–1716. [DOI] [PMC free article] [PubMed] [Google Scholar]
- 31.Kazlauskas, R., Lidgard, R. O., Murphy, P. T., Wells, R. J. & Blount, J. F. (1981) Aust. J. Chem. 34, 765–786. [Google Scholar]
- 32.Krantz, B. A. & Sosnick, T. R. (2001) Nat. Struct. Biol. 8, 1042–1047. [DOI] [PubMed] [Google Scholar]