Abstract
Human epidermal growth factor receptor-3 (HER3) is a member of the type I receptor tyrosine kinase family. Several members of this family are overexpressed in various carcinomas. Specifically, HER2 is found to be overexpressed in 20–30% of breast cancers. In contrast to epidermal growth factor receptor or HER2, the kinasedeficient HER3 self-associates readily at low nanomolar concentrations and in the absence of its ligands, various isoforms of heregulin (hrg). Binding of hrg disrupts HER3 oligomerization and leads to the formation of signaling-competent heterodimers, preferentially with HER2. Elevated levels of HER3 contribute to increased drug resistance observed in HER2-overexpressing cells. We have used the SELEX (systematic evolution of ligands by exponential enrichment) methodology to select RNA aptamers against the oligomeric state of the extracellular domains of HER3 (HER3ECD, monomeric molecular mass 82,000 Da). One of the aptamers, A30, binds with high affinity to a limited number of binding sites in the oligomeric state of HER3ECD. Binding of A30 and hrg are not competitive. Instead, the disruption of HER3 oligomers by hrg results in an ≈10-fold increase in total binding sites, but the newly created binding sites are of lower affinity. High-affinity binding of A30 inhibits hrg-dependent tyrosine phosphorylation of HER2 and the hrg-induced growth response of MCF7 cells. As an example of an aptamer against a large macromolecular protein complex, A30 can serve as a tool for the analysis of receptor interactions and may serve as a lead compound for the development of inhibitors against overexpressed receptor tyrosine kinases in carcinomas.
Receptor tyrosine kinases (RTKs) are involved in a broad spectrum of cell growth and differentiation events. RTKs are classified based on sequence homology and domain organization. Type I RTKs include the epithelial growth factor receptor (EGFR) and the human EGF receptor (HER) homologues HER2 (HER2/neu, p185), HER3, and HER4 (also named c-erbB1–4). Overexpression of several members of this receptor family, especially EGFR and HER2, is associated with a variety of solid tumor malignancies (1–5). Overexpression of HER2 is found in 20–30% of breast cancers and results in ligand-independent activation and more aggressive growth behavior (5).
Among the four mammalian type I RTKs, HER3 is unique because of its catalytically deficient kinase domain (6), its high propensity to self-associate in the absence of ligand (7), and the ability of the monomeric species of the extracellular domains (ECDs) of HER3 (HER3ECD) to assume a locked conformation, using an intramolecular tether (8). HER3 binds a variety of isoforms of the EGF homolog heregulin (hrg), and signaling relies on heterodimerization with other RTKs, preferentially HER2 (9). HER2 has a potent cytoplasmic kinase domain but is deficient in ligand binding. Simultaneous overexpression of both HER2 and HER3 is found in several cancers (10, 11), and the increased drug resistance in many HER2-overexpressing cancers depends on increased levels of HER3 or EGFR (12).
Ligand-controlled signaling by type I RTKs involves receptor dimers. However, at elevated expression levels HER2 and other RTKs are likely to be engaged in a broader range of interactions. Activation of HER2 has been shown to result in the formation of large clusters of activated receptors from preexisting smaller clusters (13). For EGFR, ligand-independent interactions of receptors have been implicated in the rapid spread of signal over the entire surface of the cell after localized stimulation with immobilized ligand (14).
The ECDs of RTKs provide attractive targets for macromolecular anticancer drugs. Examples include soluble ECDs of the receptors (15) and antibodies against the ECDs (16, 17). Herceptin, a humanized antibody against HER2, has shown great promise in the treatment of HER2-overexpressing breast cancers (18), thus demonstrating two important points. First, interference by large macromolecules with this first level of the signaling cascade holds therapeutic potential. Second, intrinsic toxicity is not required for a drug to be effective against cells that overexpress growth factor receptors.
As macromolecular drugs, RNA aptamers against RTKs have potential advantages over proteins. Libraries of randomized RNAs can be generated in vitro with a very high level of sequence complexity. Libraries can be screened in vitro with SELEX (systematic evolution of ligands by exponential enrichment) (19). A variety of chemical modifications exists for nucleic acids, such as the incorporation of radiolabels, fluorescent probes, or crosslinking reagents, and modifications to the backbone or specific bases, that can be introduced at will, thereby adding functionality and stability. RNA aptamers are nonimmunogenic, and the use of fluorine or amino groups in the 2′ position significantly enhances the half-life of RNA aptamers in serum.
In recent years, aptamers have been selected successfully against several extracellular protein ligands, such as transforming growth factor β, platelet-derived growth factor, basic fibroblast growth factor, and vascular endothelial growth factor (VEGF) (20–23). Aptamers against VEGF shrink tumors in mice and have shown promise for the treatment of macular dysfunction (24, 25). An aptamer against the proinflammatory cytokine oncostatin M is being evaluated for use against rheumatoid arthritis (26), and aptamers against blood coagulation factors VIIa and IXa are under investigation as anticoagulants (27, 28).
As a target for aptamer selection, RTKs stand out through their large size. The ECDs of type I RTKs are heavily glycosylated and may form several complexes of higher molecular weight, and a variety of distinct conformations are likely to exist. These differences pose a considerable challenge for the application of SELEX to RTKs. HER3 exemplifies these challenges, because of its high propensity to self-associate. We have successfully selected RNA aptamers against the ECD of HER3 and evaluated one aptamer in particular to demonstrate its potential for the analysis of RTK interactions and its potential use as an inhibitor against cancer cells.
Materials and Methods
Production of HER3ECD. HER3ECD was produced in S2 insect cells as described (7). In brief, the ECDs of HER3 were cloned into the pMT/BiP/V5-His A expression vector (Invitrogen), which carries a metallothionin promotor and a C-terminal hexa-His and V5-epitope tag. Inductions with 500 μM CuSO4 were carried out for 2 days in 500 ml of S2 media (Sigma) with 10% FBS at ≈6 × 10⁶ cells per ml. The ECD was purified on a 5-ml Pharmacia HITRAP chelating column.
SELEX. Single-stranded DNA templates for SELEX included 49 contiguous randomized positions flanked by constant regions (Fig. 1). The constant regions included targets for PCR primers and cloning sites (BamHI, EcoRI) and a T7 promotor. DNA templates (600 pmol) were transcribed in vitro (T7 RNA Polymerase Ribomax, Promega), and internally 32P-labeled RNA was purified on an 8% denaturing polyacrylamide gel (Sequagel, National Diagnostics). Before each round of selection, the RNA was denatured in PBS (150 mM NaCl/2.5 mM KCl/81 mM Na2HPO4/14.7 mM KH2PO4) at 90°C for 10 min and incubated on ice for 1 min.
Fig. 1.
Design of aptamers and sequences of six selected aptamers with affinity for HER3ECD. The initial aptamer library was created by PCR of the indicated DNA template, containing a randomized core of 49 nt. The primers for the PCR are indicated underneath the template. The aligned sequences represent the randomized core of six of the 29 clones that were selected based on robust binding in gel-shift assays with HER3ECD. The same six aptamers were used for the inhibition studies, shown in Fig. 2.
A filter binding assay was used for the first eight rounds of selection. The RNA pool was first counterselected by passing through a Millipore HAWP filter with a 0.45-μm pore size. The counterselected RNAs (400 pmol) were then incubated with HER3ECD at 37°C for 10 min in binding buffer (10 mM Hepes, pH 7.4/100 mM NaCl/2.5 mM MgCl2). Over the course of selection the ratio of protein to RNA was gradually lowered from 4:1 to 1:2. Unbound aptamers were separated from protein-bound aptamers on a Millipore HWAP filter. After two washes with PBS, bound RNA was measured by scintillation counting of the filters and retrieved by incubation in urea-citrate buffer (7 M urea/0.1 M sodium citrate, pH 7.0/3 mM EDTA) at 90°C for 10 min.
A gel-shift assay was used in the last seven rounds of selection. RNA (10 pmol) was incubated with HER3ECD as described above and loaded on a 6% nondenaturing acrylamide gel (Protogel, National Diagnostics). Gel electrophoresis was carried out at 4°C. The retarded band was isolated, and RNA was extracted from the gel in elution buffer (0.5 M NH4OAc, pH 7.5/10 mM MgOAc, pH 7.0/0.1% SDS/1 mM EDTA) overnight at room temperature.
For both selection methods, the RNA was subsequently reverse-transcribed into cDNA by avian myeloblastosis virus reverse transcriptase at 42°C for 1 h in a buffer purchased from Promega. Finally, the cDNA was PCR-amplified for the next round of selection. Individual clones were obtained by ligation of the PCR product into either pGEM4 or pGEM3Z vectors after digestion with EcoRI and BamHI.
Gel Mobility-Shift Assay. For screening purposes, 8 pmol of internally labeled aptamer was incubated in binding buffer with 24 pmol of HER3ECD at 37°C for 10 min and analyzed on 6% nondenaturing polyacrylamide gels as described above. Aptamers displaying substantial shift were reverse-transcribed and sequenced. For subsequent analysis of aptamer 30 (A30) binding, internally labeled and unlabeled A30 was denatured at 90°C for 2 min in PBS and cooled on ice for 1 min. A30 was incubated with HER3ECD in binding buffer for 10 min at 37°C at the indicated concentrations and in the presence 0.5 μM tRNA and was analyzed by electrophoresis on a nondenaturing 6% polyacrylamide gel at 4°C. Where indicated, HER3ECD and hrg were premixed at room temperature 3 min before the addition of A30.
Cellular Binding of A30. MCF7 cells (American Type Culture Collection) were grown to 70% confluency on 6-well plates and washed with ice-cold PBS. After the washes, cells were incubated at 4°C with 1 ml of ice-cold PBS or PBS containing 200 nM hrg. After 4 h an equal volume of ice-cold PBS containing 2 ml of internally 32P-labeled A30 (80,000 cpm/μl), 20 μl of RNase inhibitor (20 units/μl), and varying concentrations of unlabeled aptamer were added. After 4 h of incubation, the supernatant was removed, and cells were washed three times with ice-cold PBS. Displaced and bound radiolabeled aptamer was measured in duplicate.
Tyrosine Phosphorylation Assay. MCF7 cells were seeded 2 days before the experiment in RPMI medium 1640 with 10% FBS. Cells were serum-starved 24 h before stimulation. After two washes with PBS, cells were stimulated with hrg or hrg plus different concentrations of aptamer in RPMI medium 1640. After 15 min of stimulation at 37°C, cells were placed on ice and washed twice with ice-cold PBS. Cells were lysed with mild lysis buffer (20 mM Tris 8.0/137 mM NaCl/1% Triton X-100/10% glycerol/5 mM EDTA/1 mM sodium orthovanadate/1 mM PMSF/1 μg/ml leupeptin/1 μg/ml aprotinin). Lysates were either evaluated directly for tyrosine phosphorylation or first subjected to immunoprecipitation in mild lysis buffer as described (7) by using anti-HER2 antibody (Ab3, Oncogene) and protein A/G beads (Santa Cruz Biotechnology). Western blot analysis was done by using an antiphosphotyrosine antibody (4G10, Upstate Biotechnology, Lake Placid, NY) as the primary antibody and anti-mouse IgG-horseradish peroxidase conjugates (Upstate Biotechnology) as the secondary antibody.
Cell Proliferation Assay. MCF7 cells were seeded in 96-well plates (2,500 cells per well) in RPMI medium 1640, 2% FBS, 2 units of RNase inhibitor per ml, and varying concentrations of hrg and aptamer. After 2 days, cell growth was determined by using a 3-(4,5-dimethylthiazol-2-yl)-2,5-diphenyl tetrazolium bromidebased assay (Promega). Cell growth was equated with the absorbance of converted and solubilized dye at 560 nm. All samples were determined in triplicate.
Results
Selection of RNA Aptamers That Bind HER3ECD. HER3ECD has a molecular mass of 82 kDa, which includes 12% carbohydrates (7), and represents an exceptionally large target for SELEX. At the high concentrations of HER3ECD required for SELEX, the ECD is completely in its oligomeric state. Previous analysis suggests that the upper limit of self-association in solution are 12 copies of the ECD (7).
The analysis of 88 clones, obtained after 15 rounds of SELEX, identified 29 clones that gave reproducible positive results in gel mobility-shift assays with HER3ECD. All 29 clones were sequenced. The sequences of six aptamers with good gel-shift properties are shown in Fig. 1. Beyond an apparent bias for adenine in the first half and uracil in the second half of the aptamers, we could not identify a consensus pattern. This apparent lack of a consensus among the 29 sequences could indicate insufficient sample sequences, several distinct bindings sites on the target, or both. Given the exceptionally large size of the ECD, the possibility of multiple target sites is plausible.
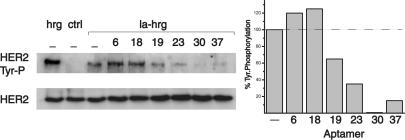
Depending on their site of binding, aptamers could interfere with receptor self-association, heterodimerization, or ligand binding. We evaluated different aptamers for their ability to interfere with hrg-induced tyrosine phosphorylation of HER2. Whereas “low-affinity” binding of hrg to HER3 has a Kd of 2–8 nM, “high-affinity” binding to the HER3-HER2 heterodimer has a Kd of ≈10–10 M (29) and results primarily in the phosphorylation of HER2. For the initial screen, we used an Ω-loop mutant of hrg with reduced binding affinity. The Ω-loop is not essential for activity, but multiple alanine mutations in this loop reduce the binding affinity toward HER3 (30). Fig. 2 shows the results obtained for the six aptamers shown in Fig. 1. Although all 29 of 88 aptamers were selected based on their ability to bind HER3ECD, they differ in their effect on receptor stimulation. Aptamer 19 shows little interference with hrg-dependent activation, whereas A30, and to a lesser extent aptamers 23 and 37, show inhibition. In contrast, aptamers 6 and 18 enhance hrg-dependent activation. Aptamer 18 reproducibly caused a 24 ± 4% enhancement of hrg stimulation in independent experiments. Further comparison of aptamer 18 and A30 revealed that neither elicits tyrosine phosphorylation by itself or displaces the other aptamer from its binding site on HER3ECD (data not shown). Although the aptamers shown in Figs. 1 and 2 represent only a subset of all obtained sequences, the apparent qualitative differences in their activities and the lack of mutual competition of aptamer 18 and A30 are consistent with the assumption of at least two distinct binding sites. Because of the potency of A30 and the possibilities inherent in an aptamer with inhibitory properties, we focused on A30 for the remainder of this study.
Fig. 2.
Screening of selected aptamers for their inhibition of HER2 activation. MCF7 cells were either stimulated with 10 nM WT hrg (hrg) or lowaffinity hrg (la-hrg) in the presence of 100 nM of the various aptamers indicated. Tyrosine phosphorylation of HER2 was determined by Western blotting. The numbers above each lane indicate aptamer clones. Whereas A30 reduces tyrosine phosphorylation almost to the level observed for the unstimulated control (Ctrl), other aptamers, such as A6 and A18, enhance the activation by low-affinity hrg. The level of tyrosine phosphorylation in the presence of the various aptamers is shown on the right, relative to the uninhibited stimulation with la-hrg (–). The differences in tyrosine phosphorylation of HER2 are not caused by changes in the levels of HER2, visualized by direct detection of the receptor.
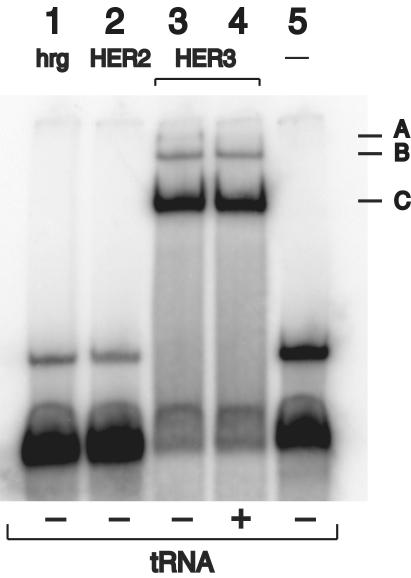
Specificity of A30. Given the high homology between HER3 and HER2, we next confirmed the specificity of A30 binding (Fig. 3). A gel shift of A30 was observed only for HER3ECD (Fig. 3, lane 3), but not for HER2-ECD (Fig. 3, lane 2) or hrg (Fig. 3, lane 1). Furthermore, binding of A30 to HER3ECD cannot be inhibited by a 20-fold molar excess of tRNA (Fig. 3, lane 4). Combined with the fact that the majority of aptamer sequences does not bind HER3ECD at all, these results indicate a high level of specificity in the interaction of HER3ECD and A30.
Fig. 3.
Native gel mobility-shift assay of radiolabeled A30. Radiolabeled A30 (alone = Ctrl) is shifted to several slower migrating species (A, B, and C) in the presence of purified HER3ECD (0.5 μM). This interaction does not occur with HER2-ECD or hrg, both 0.5 μM, and is not inhibited by an excess of tRNA (4 μM).
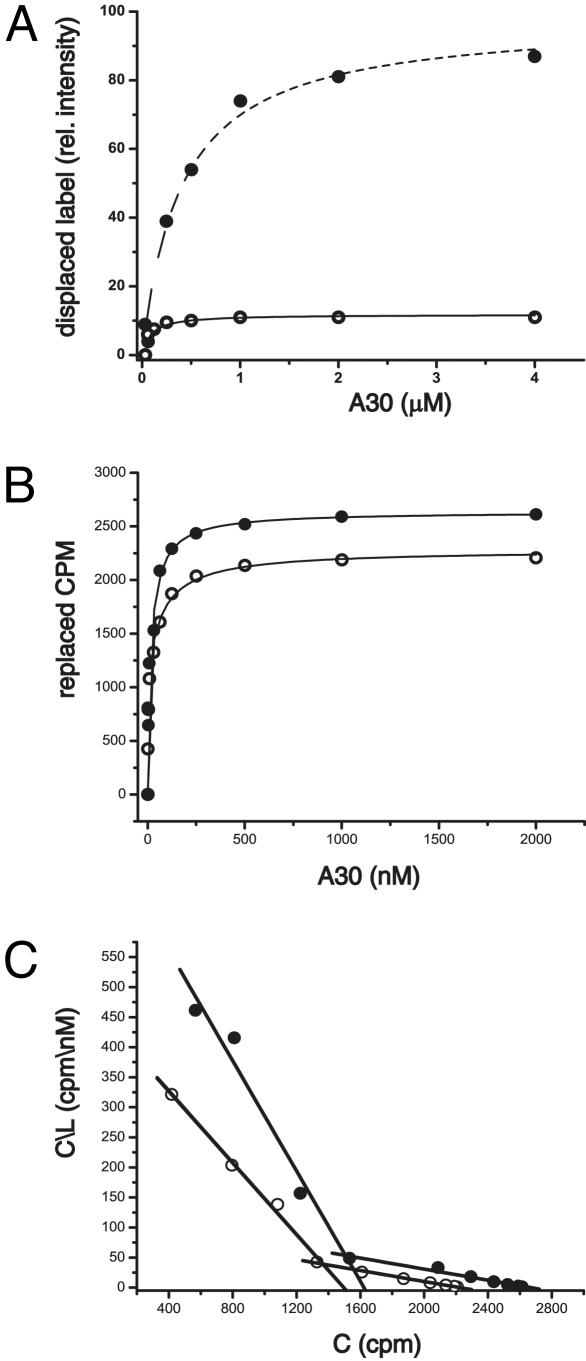
Mode of Interaction Between A30 and HER3ECD. Several lines of evidence suggest that the interaction of A30 with HER3ECD involves at least two different modes of binding. Fig. 4A shows A30 binding to the ECD in the presence and absence of hrg, as determined by a gel-shift assay. In the absence of hrg, an apparent Kd of 45 nM is obtained. Addition of hrg has two consequences. The number of binding sites increases 9-fold, and the binding affinity decreases to an apparent Kd of 400 nM. With respect to the hrg-induced increase and dual mode of binding, we observed a similar, although less pronounced, effect for A30 binding to MCF7 cells (Fig. 4 B and C). MCF7 cells endogenously express both HER3 and HER2. Overall, binding to MCF7 cells at 4°C is tighter with a Kd of 21 (±2.2) and 3.3 (±0.2) nM, respectively for low- and high-affinity binding (Fig. 4C). The addition of hrg results in an increase in the number of A30 binding sites (Fig. 4B), but this increase is relatively small (25% total, 17% for low-affinity sites and 8% for high-affinity sites).
Fig. 4.
Binding of A30 to HER3ECD and cellular HER3. (A) Binding of A30 to purified HER3ECD, as determined by the replacement of radiolabeled A30 by unlabeled A30 in a gel-shift analysis, indicates a small number of high-affinity binding sites in the absence of hrg (○). Addition of hrg (•) generates additional binding sites of lower affinity. (B) Binding of A30 to cellular HER3 also shows an increase in binding sites on addition of hrg (•), although less pronounced than in solution. Binding data are shown as displaced labeled A30 (cpm) as a function of unlabeled A30. (C) The Scatchard analysis of data shown in B reveals a smaller increase in high-affinity binding sites parallel with the larger increase in low-affinity sites after addition of hrg (•). C in this analysis represents displaced cpm, and L represents the concentration of unlabeled A30 (nM).
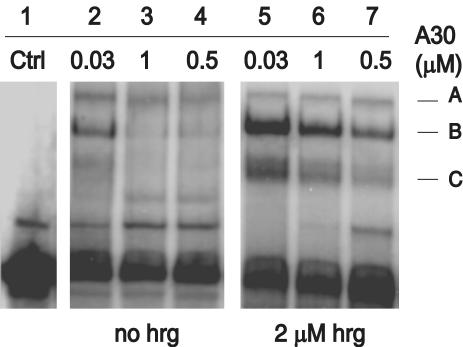
Across experiments, gel shifts of A30 with HER3ECD produce a set of three bands (A, B, and C in Figs. 3 and 5), the ratio of which can differ based on the concentration of components and the particular batches of refolded A30. A direct comparison of binding with the same batch of A30 in the presence and absence of hrg shows that bands that are not derived from A30 alone (Fig. 5, lane 1) are qualitatively the same in the presence and absence of hrg (which contributes minimal changes in both the size and charges of the complex compared with A30). When the concentration of unlabeled A30 is increased, the faster migrating species (B and C) are more readily subject to competition. On addition of hrg, increases in binding are observed primarily for the faster migrating species B and C.
Fig. 5.
Gel-shift pattern of A30 and HER3ECD in the presence and absence of hrg and competition with unlabeled A30. The binding of radiolabeled A30 to HER3ECD (0.5 μM) is shown at various concentrations of total A30 (shown in μM). Addition of a molar excess of hrg (lanes 5–7) enhances binding, but does not qualitatively change the pattern of shifted bands (A, B, and C).
We previously showed that HER3ECD has a high propensity to form oligomers in solution. Those oligomers dissociate in the presence of excess hrg. To evaluate the binding preferences of A30 for the oligomeric versus the monomeric state of HER3ECD, we visualized HER3ECD and radiolabeled A30. Because of the close to neutral charges of the HER3ECD and HER3ECD–hrg complex, both species are not well separated under gel-shift conditions that are optimized for the highly charged and the fast-migrating complexes with A30. A significant shift can be observed on hrg binding to HER3ECD in Phast gels (Pharmacia), probably as a result of the significantly higher current flow allowable in these systems. However, the nature of these gels makes Western blot analysis difficult. We therefore decided to visualize purified HER3ECD directly at high protein concentrations.
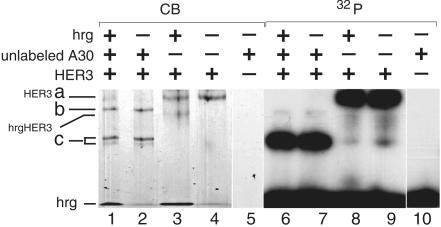
Fig. 6 shows the obtained shifts, visualized either through autoradiography of radiolabeled A30 or Coomassie staining. Radiolabeled A30 (0.3 nM) is present in all lanes. Lanes 3 and 4 show the partial gel shift of 2 μM HER3ECD with a 3-fold molar excess of hrg, visualized by coomassie staining. Radiolabeled A30 binds to the oligomeric species of HER3ECD (Fig. 6, lanes 4 and 9). Under conditions when HER3ECD oligomers are in excess over A30, disruption of HER3ECD oligomers by hrg is only partial (Fig. 6, lanes 3 and 8). The simultaneous presence of oligomeric and monomeric species of HER3, detectable by Coomassie staining, allows a direct comparison of A30 binding to both species. A30 preferentially binds the oligomeric species of HER3ECD. A small amount of an additional faster migrating species is visible on the autoradiography in both cases. Using a 4-fold molar excess of A30 over HER3ECD results in three shifted species of HER3ECD, visible by direct Coomassie staining (Fig. 6, lane 2). This comparison identifies the additional band (species c) in Fig. 6, lanes 8 and 9, as a small portion of A30-shifted HER3ECD. The addition of hrg does not alter this pattern. The assignment of species a, b, and c in this experiment is based on the similarity in the pattern of bands with the gel shifts in Figs. 3 and 5 (lane 5). The distinction of lower and uppercase letters reflects the fact that the equivalence of those bands has not been confirmed in light of the differences in the two gel systems.
Fig. 6.
Gel shift of radiolabeled A30 and direct visualization of HER3ECD at elevated protein concentrations. Radiolabeled A30 (0.3 nM) is present in all lanes. The concentration of HER3ECD is 2 μM, and hrg (6 μM) and unlabeled A30 (8 μM) were added at a molar excess as indicated above the gel. Gels were either analyzed by direct Coomassie staining (CB) or autoradiography (32P) as indicated. On this 4–15% Phast gel, both hrg and A30 were run with the running front. A30-shifted HER3 is labeled a,b, and c.
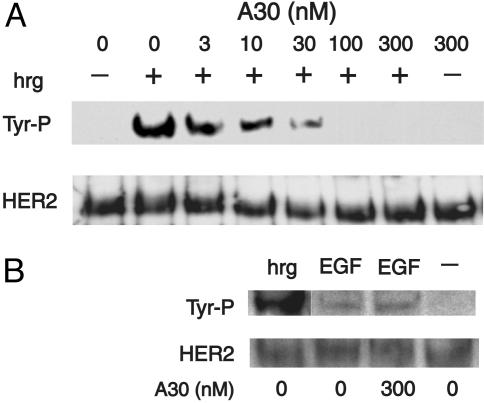
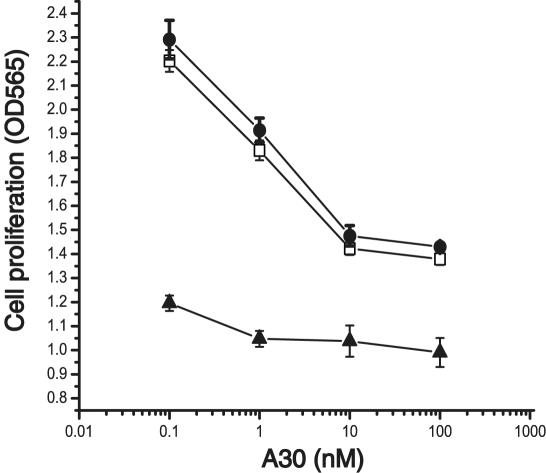
Inhibition of Tyrosine Phosphorylation and Growth Stimulation. Next, we evaluated the ability of A30 to interfere with receptor activation by WT hrg. Fig. 7 shows HER2 tyrosine phosphorylation in MCF7 cells after stimulation by hrg. Half-maximal inhibition of tyrosine phosphorylation occurs at a concentration ≈10 nM A30 (Fig. 7A). In contrast, the activation of HER2 by EGF, which proceeds through heterodimers of EGFR and HER2, is not inhibited by A30 (Fig. 7B). The low intensity of tyrosine phosphorylation of HER2 after stimulation by EGF is a reflection of the lower levels of EGFR (5,000 per cell) compared with HER2 (15,000 per cell) and HER3 (25,000 per cell) (31) and the fact that EGFR signaling proceeds only in part through heterodimers with HER2. To evaluate whether the inhibition of tyrosine phosphorylation is reflected in a reduction in hrg-specific growth stimulation, we incubated MCF7 cells in the presence of different concentrations of A30 and hrg for 2 days (Fig. 8). The addition of A30 results in a 50% inhibition of hrg-specific growth stimulation, even at high concentrations (100 nM) of hrg. Half-maximal inhibition occurs at ≈1 nM A30. The addition of A30 alone has little effect on the growth of MCF7 cells.
Fig. 7.
Inhibition of HER2/HER3 activation by A30. (A) Antiphosphotyrosine Western blot of MCF7 cell lysates after HER2 immunoprecipitation. Cells were stimulated with WT hrg (5 nM) unless indicated otherwise (–). A30 was added at the concentrations indicated above each lane. The differences in tyrosine phosphorylation of HER2 are not caused by changes in the levels of HER2, visualized by direct detection of the receptor. (B) Tyrosine phosphorylation of HER2 after stimulation with EGF is not inhibited by A30. EGF or hrg were added to MCF7 cells at 5 nM in the presence or absence of A30 (300 nM).
Fig. 8.
Inhibition of hrg induced cell growth in MCF7 cells. Cell growth [OD560 after 3-(4,5-dimethylthiazol-2-yl)-2,5-diphenyl tetrazolium bromide assay] was measured as a function of A30 concentration (nM) in the presence of two different concentrations of WT hrg (no hrg ▵)or 5 nM(□) and 100 nM hrg (•).
Discussion
We report the successful selection of an aptamer against the ECDs of HER3. SELEX requires a high abundance of target, and selection against proteins the size of HER3ECD creates special challenges. At elevated concentrations, HER3ECD exists in an oligomeric form. This represents, to our knowledge, the largest target for successful aptamer selection to date. Some observed differences to “more conventional” SELEX may therefore be a reflection of the large size of the target surface. Most notably, our selection resulted in a family of aptamers without apparent consensus. At least two classes of aptamers were apparent, causing either inhibition or enhancement of hrg-dependent activation. Those two classes are represented by aptamer 18 and A30, which showed no mutual competition for binding in gel-shift studies. These findings suggest that the lack of sequence convergence is at least in part a reflection of selection against different binding sites.
The selected aptamers show high specificity for HER3ECD. We analyzed A30 in more detail. Despite a high level of homology between the ECDs of HER2 and HER3, A30 shows no binding to the ECD of HER2 or hrg, even at concentrations far above those used in inhibition studies (Fig. 3). Most aptamers obtained during the selection show no binding to HER3ECD, providing a randomized control set for unspecific binding. Nonspecific RNA (Fig. 3) and an aptamer with independent binding to HER3ECD (A18) do not interfere with the binding of A30 to HER3ECD.
On a cellular level, we cannot exclude the possibility of additional low-affinity targets. However, the inhibitory properties of A30 are directly linked to the action of hrg. A30 does not exhibit general growth inhibition but specifically inhibits the growth stimulatory component elicited by hrg. Whereas hrginduced tyrosine phosphorylation of HER2, which proceeds primarily through HER2–HER3 complexes, is inhibited, the activation of HER2 by EGF, requiring dimers of EGFR and HER2, is not inhibited.
The inhibitory properties of A30 raise the question about possible modes of binding and the method by which signaling is inhibited. At present, we have no information on the localization of the A30 binding site on the HER3ECD. However, the fact that A30 binding is not competitive with hrg and the size of the aptamer make it less likely that domains 1–3 of the ECD, involved in ligand binding, are the target. Recent models of HER3 activation, based on the crystal structure of the HER3ECD and ECD of EGFR with bound ligand (8, 32), assume receptor interactions in domains 2 and 4 in the activated complex of HER2 and HER3 (33). At present, domain 4 appears to be the most likely target for A30, and aptamer binding is therefore anticipated to interfere with the dimerization of HER2 and HER3 but not hrg binding. In the crystal structure, domains 2 and 4 of HER3ECD are also involved in an intramolecular “lock.” How A30 relates to conformational changes of HER3 is not clear at this point, nor is it known how the locked conformation relates to the oligomers observed in solution.
The analysis of the mode of binding of A30 to HER3ECD is complicated by the presence of at least two different modes of interaction, evident by the presence of multiple gel-shifted species (Figs. 3, 5, and 6). Our current working model for the effect of hrg on A30 binding assumes that A30 preferentially binds oligomers of HER3ECD. Given that aptamers were initially selected at high concentrations of HER3ECD, oligomers of HER3 would have been the primary target of selection. This hypothesis is also consistent with several experimental findings. At high concentrations of HER3ECD (Fig. 6), disruption of oligomers by excess hrg is incomplete. Under those conditions of partial disruption of oligomers and an excess of oligomers over A30 (Fig. 6, lane 8), oligomers of HER3ECD are the preferred binding site for A30. However, the number of accessible sites in the oligomeric species appears to be limited. Based on this model, the hrg-induced increase in A30 binding sites at lower concentrations of HER3ECD would reflect the more complete disruption of oligomers by hrg, resulting in increased access for A30 to the ECD but the resulting binding sites have reduced affinity. One possible explanation for the different interaction with oligomers and monomers assumes a binding surface on the oligomers that contains residues from adjacent ECD molecules at the periphery of ECD clusters. A disruption of oligomers would make individual ECDs more accessible but part of the binding interface would be lost, resulting in weaker binding. Further, support for the notion of substoichiometric binding of A30 to HER3 oligomers also comes from the fact that the maximum number of cellular binding sites for A30 (3,250 ± 200) falls short of the total number of HER3 receptors (25,000) in MCF7 cells. This discrepancy is partially reduced by the addition of hrg. This partial disruption of HER3 oligomers on the cell surface is consistent with the partial disruption of high concentrations of soluble ECDs in solution, even in the presence of excess hrg.
If A30 is, in fact, capable of binding to HER3ECD monomers, albeit with lower affinity, a large excess of A30 should disrupt oligomers of HER3ECD. Evidence for such a disruption can be seen in Fig. 6 (lanes 2 versus 4). In our model, based on a transition of HER3ECD oligomers to monomers, (species a, Fig. 6, lanes 8 and 9) would represent the binding of a single A30 to the oligomer under conditions of a large excess of oligomeric HER3ECD. High concentrations and a molar excess of A30 over HER3ECD would stabilize the monomeric form of HER3ECD and result in complete saturation of all accessible binding sites on the remaining oligomer. The high negative net charge of such a complex should result in a significantly shifted oligomeric species. Assuming that species b represents such a shifted oligomer, whereas species c represents a monomer complex, the low ratio of A30 per HER3ECD (Fig. 6, lane 2) is consistent with a substoichiometric number of accessible sites on the oligomer.
However, although the above model provides a working hypothesis for the mechanism of A30 binding to HER3ECD, it is likely to be a simplification. The model does not account for the double band for species c (Fig. 6, lanes 1 and 2) and species C in Fig. 5. The crystal structure of HER3ECD suggests two distinct conformations of HER3ECD (open and locked). Such differences in conformation could contribute to differences in migration of A30–monomer complexes. Also, alternative explanations, such as species with a different stoichiometry of A30 binding to HER3ECD monomers, cannot be ruled out at this point.
Regardless of the complexities of the mechanism of binding by A30, our data demonstrate that the selected aptamer is specific for HER3ECD and inhibits the hrg-induced activation of HER3/HER2 (Fig. 7). The lack of competition between hrg and A30 indicates that the inhibitory effect of A30 on tyrosine phosphorylation is not caused by inhibition of hrg binding. The activity of A30 and similar aptamers against HER3 may complement antibodies that target HER2, especially in cases where elevated levels of HER3 enhance the effect of HER2 overexpression.
Conclusion
We have generated an aptamer against the ECDs of HER3. The ease with which aptamers can be chemically modified makes them ideal starting points for the synthesis of a broad range of biochemical tools that may shed light into the complex interactions between RTKs in a membrane setting. Given that A30 has not been subjected to further modifications that could enhance its serum stability and binding affinity, it already shows a remarkably strong inhibitory effect on hrg-induced growth stimulation of MCF7 cells. The mechanism of inhibition by A30 is likely to be complex and requires further analysis. Additional contributions beyond the direct targeting of HER3 cannot be ruled out at this point. However, the inhibitory properties of A30 demonstrate its potential usefulness as a lead compound for the design of anticancer drugs. The activity of A30 is of special importance in light of the paradigm established by Herceptin. Herceptin has demonstrated that a nontoxic and nonmembranepermeating macromolecule has the potential to be a potent reagent in the treatment of cancer. Anti-HER3ECD aptamers, in isolation or combination with other treatments such as anti-HER2 antibodies or anti-HER3 aptamers that bind different binding sites, may therefore become a valuable addition to the repertoire of inhibitors that target cancers that overexpress HER2.
Acknowledgments
This article is dedicated to the memory of David S. Sigman, an outstanding scientist and mentor. The presented work was inspired by him and was initiated in his laboratory. C.-h.B.C., G.A.C., and R.L. were supported by National Institutes of Health Grant GM-21199. R.L. was supported by the V Foundation for Cancer Research.
Abbreviations: EGF, epithelial growth factor; EGFR, EGF receptor; HER, human EGFR; RTK, receptor tyrosine kinase; hrg, heregulin; ECD, extracellular domain; SELEX, systematic evolution of ligands by exponential enrichment; A30, aptamer 30.
References
- 1.Dougall, W. C., Qian, X. & Greene, M. I. (1993) J. Cell Biochem. 53, 61–73. [DOI] [PubMed] [Google Scholar]
- 2.Berchuck, A., Kamel, A., Whitaker, R., Kerns, B., Olt, G., Kinney, R., Soper, J. T., Dodge, R., Clarke-Pearson, D. L., Marks, P., et al. (1990) Cancer Res. 50, 4087–4091. [PubMed] [Google Scholar]
- 3.Schneider, P. M., Hung, M. C., Chiocca, S. M., Manning, J., Zhao, X. Y., Fang, K. & Roth, J. A. (1989) Cancer Res. 49, 4968–4971. [PubMed] [Google Scholar]
- 4.Yokota, J., Yamamoto, T., Miyajima, N., Toyoshima, K., Nomura, N., Sakamoto, H., Yoshida, T., Terada, M. & Sugimura, T. (1988) Oncogene 2, 283–287. [PubMed] [Google Scholar]
- 5.Slamon, D. J., Godolphin, W., Jones, L. A., Holt, J. A., Wong, S. G., Keith, D. E., Levin, W. J., Stuart, S. G., Udove, J., Ullrich, A. & Press, M. (1989) Science 244, 707–712. [DOI] [PubMed] [Google Scholar]
- 6.Guy, P. M., Platko, J. V., Cantley, L. C., Cerione, R. A. & Carraway, K. L. R. (1994) Proc. Natl. Acad. Sci. USA 91, 8132–8136. [DOI] [PMC free article] [PubMed] [Google Scholar]
- 7.Landgraf, R. & Eisenberg, D. (2000) Biochemistry 39, 8503–8511. [DOI] [PubMed] [Google Scholar]
- 8.Cho, H. S. & Leahy, D. J. (2002) Science 297, 1330–1333. [DOI] [PubMed] [Google Scholar]
- 9.Sliwkowski, M. X., Schaefer, G., Akita, R. W., Lofgren, J. A., Fitzpatrick, V. D., Nuijens, A., Fendly, B. M., Cerione, R. A., Vandlen, R. L. & Carraway, K. L. R. D. (1994) J. Biol. Chem. 269, 14661–14665. [PubMed] [Google Scholar]
- 10.Naidu, R., Yadav, M., Nair, S. & Kutty, M. K. (1998) Br. J. Cancer 78, 1385–1390. [DOI] [PMC free article] [PubMed] [Google Scholar]
- 11.Krahn, G., Leiter, U., Kaskel, P., Udart, M., Utikal, J., Bezold, G. & Peter, R. U. (2001) Eur. J. Cancer 37, 251–259. [DOI] [PubMed] [Google Scholar]
- 12.Chen, X., Yeung, T. K. & Wang, Z. (2000) Biochem. Biophys. Res. Commun. 277, 757–763. [DOI] [PubMed] [Google Scholar]
- 13.Nagy, P., Jenei, A., Kirsch, A. K., Szollosi, J., Damjanovich, S. & Jovin, T. M. (1999) J. Cell Sci. 112, 1733–1741. [DOI] [PubMed] [Google Scholar]
- 14.Verveer, P. J., Wouters, F. S., Reynolds, A. R. & Bastiaens, P. I. (2000) Science 290, 1567–1570. [DOI] [PubMed] [Google Scholar]
- 15.Azios, N. G., Romero, F. J., Denton, M. C., Doherty, J. K. & Clinton, G. M. (2001) Oncogene 20, 5199–5209. [DOI] [PubMed] [Google Scholar]
- 16.Ranson, M. & Sliwkowski, M. X. (2002) Oncology 63, Suppl. 1, 17–24. [DOI] [PubMed] [Google Scholar]
- 17.Agus, D. B., Akita, R. W., Fox, W. D., Lewis, G. D., Higgins, B., Pisacane, P. I., Lofgren, J. A., Tindell, C., Evans, D. P., Maiese, K., et al. (2002) Cancer Cell 2, 127–137. [DOI] [PubMed] [Google Scholar]
- 18.Pegram, M., Hsu, S., Lewis, G., Pietras, R., Beryt, M., Sliwkowski, M., Coombs, D., Baly, D., Kabbinavar, F. & Slamon, D. (1999) Oncogene 18, 2241–2251. [DOI] [PubMed] [Google Scholar]
- 19.Gold, L., Polisky, B., Uhlenbeck, O. & Yarus, M. (1995) Annu. Rev. Biochem. 64, 763–797. [DOI] [PubMed] [Google Scholar]
- 20.Golden, M. C., Collins, B. D., Willis, M. C. & Koch, T. H. (2000) J. Biotechnol. 81, 167–178. [DOI] [PubMed] [Google Scholar]
- 21.Pietras, K., Ostman, A., Sjoquist, M., Buchdunger, E., Reed, R. K., Heldin, C. H. & Rubin, K. (2001) Cancer Res. 61, 2929–2934. [PubMed] [Google Scholar]
- 22.Jellinek, D., Green, L. S., Bell, C., Lynott, C. K., Gill, N., Vargeese, C., Kirschenheuter, G., McGee, D. P., Abesinghe, P., Pieken, W. A., et al. (1995) Biochemistry 34, 11363–11372. [DOI] [PubMed] [Google Scholar]
- 23.Jellinek, D., Green, L. S., Bell, C. & Janjic, N. (1994) Biochemistry 33, 10450–10456. [DOI] [PubMed] [Google Scholar]
- 24.Martin, D. F., Klein, M. & Haller, J. (2002) Retina 22, 143–152.11927845 [Google Scholar]
- 25.Kim, E. S., Serur, A., Huang, J., Manley, C. A., McCrudden, K. W., Frischer, J. S., Soffer, S. Z., Ring, L., New, T., Zabski, S., et al. (2002) Proc. Natl. Acad. Sci. USA 99, 11399–11404. [DOI] [PMC free article] [PubMed] [Google Scholar]
- 26.Rhodes, A., Deakin, A., Spaull, J., Coomber, B., Aitken, A., Life, P. & Rees, S. (2000) J. Biol. Chem. 275, 28555–28561. [DOI] [PubMed] [Google Scholar]
- 27.Rusconi, C. P., Yeh, A., Lyerly, H. K., Lawson, J. H. & Sullenger, B. A. (2000) Thromb. Haemostasis 84, 841–848. [PubMed] [Google Scholar]
- 28.Rusconi, C. P., Scardino, E., Layzer, J., Pitoc, G. A., Ortel, T. L., Monroe, D. & Sullenger, B. A. (2002) Nature 419, 90–94. [DOI] [PubMed] [Google Scholar]
- 29.Tzahar, E., Levkowitz, G., Karunagaran, D., Yi, L., Peles, E., Lavi, S., Chang, D., Liu, N., Yayon, A., Wen, D. Z. & Yarden, Y. (1994) J. Biol. Chem. 269, 25226–25233. [PubMed] [Google Scholar]
- 30.Jones, J. T., Ballinger, M. D., Pisacane, P. I., Lofgren, J. A., Fitzpatrick, V. D., Fairbrother, W. J., Wells, J. A. & Sliwkowski, M. X. (1998) J. Biol. Chem. 273, 11667–11674. [DOI] [PubMed] [Google Scholar]
- 31.Aguilar, Z., Akita, R. W., Finn, R. S., Ramos, B. L., Pegram, M. D., Kabbinavar, F. F., Pietras, R. J., Pisacane, P., Sliwkowski, M. X. & Slamon, D. J. (1999) Oncogene 18, 6050–6062. [DOI] [PubMed] [Google Scholar]
- 32.Ogiso, H., Ishitani, R., Nureki, O., Fukai, S., Yamanaka, M., Kim, J. H., Saito, K., Sakamoto, A., Inoue, M., Shirouzu, M. & Yokoyama, S. (2002) Cell 110, 775–787. [DOI] [PubMed] [Google Scholar]
- 33.Schlessinger, J. (2003) Science 300, 750–752. [DOI] [PubMed] [Google Scholar]


