Abstract
The process of DNA condensation into nanometer-scale particles has direct relevance to several fields, including cell biology, virology, and gene delivery for therapeutic purposes. DNA condensation has also attracted the attention of polymer physicists, as the collapse of DNA molecules from solution into well defined particles represents an exquisite example of a polymer phase transition. Here we present a quantitative study of DNA toroids formed by condensation of 3 kb DNA with hexammine cobalt (III). The presence or absence of static loops within this DNA molecule demonstrates the effect of nucleation loop size on toroid dimensions and that nucleation is principally decoupled from toroid growth. A comparison of DNA condensates formed at low ionic strength with those formed in the presence of additional salts (NaCl or MgCl2) shows that toroid thickness is a salt-dependant phenomenon. Together, these results have allowed the development of models for DNA toroid formation in which the size of the nucleation loop directly influences the diameter of the fully formed toroid, whereas solution conditions govern toroid thickness. The data presented illustrate the potential that exists for controlling DNA toroid dimensions. Furthermore, this study provides a set of data that should prove useful as a test for theoretical models of DNA condensation.
Keywords: ψ DNA, gene delivery, packaging, condensation
Within living cells, DNA is highly condensed as compared with free DNA in solution (1). In sperm cells and viruses, where gene transcription is inactive, DNA condensation approaches the limits of molecular compaction (2, 3). The condensation of free DNA in vitro has long been of interest as a potential model for DNA condensation in vivo, particularly as a model of DNA packaging in viruses (4–6). More recently, DNA condensation has attracted much attention for its direct relevance to the preparation of DNA for delivery as a part of gene therapies (7–10).
More than 25 years ago it was discovered that multivalent cations cause DNA to collapse from solution into toroid-shaped condensates (11). These structures have typically been reported to measure ≈100 nm in outside diameter with a 30-nm hole; however, the generation of substantially larger toroids has also been reported (12, 13). Toroidal DNA condensates have been reported to be the morphology of DNA packaged within some bacterial phages and vertebrate sperm cells (4, 5, 14–16). Thus, the DNA toroid is a morphology used by nature for the high-density packing of genomes. The condensation of DNA for artificial gene delivery has also used toroids (17, 18). However, researchers have yet to develop a method to package DNA that produces particles as homogeneous, both in terms of size and shape, as is achieved by natural packing systems.
A considerable number of theoretical studies have sought to explain why DNA toroids and other condensate morphologies (e.g., rods) favor a particular size. These theories include growth limits based on the build-up of uncompensated electrostatic repulsions, the accumulation of packing defects, and kinetic barriers to DNA strand association in solution (19–25). All of these theoretical studies agree that DNA toroids should favor a particular size. However, the validity of such theories has been difficult to assess because most experimental studies have presented measurements only for toroids collected for a single solution condition. Additionally, variations between the experimental protocols of different laboratories make it difficult to appreciate how toroid size depends on solution conditions.
Here we report a systematic study of how static loops and salt affect the dimensions of toroids generated by the condensation of DNA with hexammine cobalt (III). We demonstrate that static curvature reduces toroid dimensions and that toroid dimensions increase with added salt. The number of toroids measured has allowed the determination of statistically significant shifts in average toroid dimensions that result from changes in salt concentrations as small as 2.5 mM NaCl. Analysis of toroid diameter versus thickness for varying solution conditions supports a model for toroid growth that includes two parts: a nucleation stage and a multistranded growth stage. Changes in toroid diameter and thickness with salt also demonstrate that toroid nucleation and growth are affected differently by ionic strength.
Materials and Methods
DNA Preparation. Bluescript II SK– plasmid DNA (Stratagene) was grown in DH5a (Life Technologies, Rockville, MD) and isolated by using the Qiagen (Valencia, CA) Maxi Prep kit. The DNA was eluted in 1× TE (10 mM Tris, pH 7.8/1 mM EDTA) and linearized by digestion with the restriction enzyme HindIII (New England Biolabs). Buffer and salts introduced for the restriction digest reaction were removed by rinsing the DNA at least five times with 0.25× TE by using a Microcon YM-30 spin column (Amicon). After the final rinse, DNA was resuspended from the spin column membrane to a final concentration of 20 μg/ml in 0.25× TE. DNA concentrations were verified spectrophotometrically. A modified Bluescript II SK– containing extensive sequence-directed curvature was also used in this study. This plasmid, reported by Shen et al. (26), contains four tandem repeats of the sequence 5′-ATCCATCGACC(AAAAAACGGGCAAAAAACGGC)7-AAAAAAGCAGTGGAAG-3′. This plasmid was grown in Sure2 Supercompetent cells (Stratagene), then isolated and prepared as described above.
To examine the effects of ionic strength and cation species on DNA condensation, three stock solutions were prepared of the linearized Bluescript II SK– plasmid DNA: a low-salt stock solution in 1× TE, a 15-mM NaCl stock solution, and a 7.5-mM MgCl2 stock solution. All three stock solutions contained 17 μg/ml DNA in 1× TE. DNA samples with salt concentrations between the low-salt and NaCl or MgCl2 stock solutions were prepared by mixing specific ratios of the low-salt stock solution with the NaCl or MgCl2 stock solutions, respectively.
DNA Condensate Preparation and Imaging. DNA condensates were prepared by mixing a DNA sample solution with an equal volume of a hexammine cobalt chloride (Sigma) solution to yield a condensation reaction mixture 8.5 μg/ml in DNA, 100 μM in hexammine cobalt chloride, and 0.5× in the salt/buffer of the DNA sample. Condensate reaction mixtures were allowed to equilibrate for 5 min and then deposited on carbon-coated grids (Ted Pella). After 10 min on the grids, 2% uranyl acetate (Ted Pella) was added momentarily to the condensate mixtures; the grids were then rinsed in 95% ethanol and air-dried. The DNA condensates were recorded on film with a JEOL-100C transmission electron microscope (TEM) at ×100,000 magnification. The TEM negatives were scanned at 300 pixels/inch, and a graphics program was used to measure the outer diameter and thickness of individual DNA toroids.
Results and Discussion
We have studied the condensation of a linear 2,961-bp DNA, and a slightly longer DNA that contains extensive sequence-directed curvature, under a range of salt conditions. The 2,961-bp DNA (abbreviated 3kbDNA) is a bacterial plasmid linearized by cutting at a single site with a restriction enzyme. The second DNA (abbreviated Atract60) is the same bacterial plasmid with an additional 720-bp insert. The sequence of this insert contains 60 A-tracts of the form d(AAAAAA) that are phased with respect to the helical twist of DNA to maximize long-range axial bending of the DNA (see Materials and Methods). A single A-tract produces a bend in the DNA helical axis of ≈13° (27). Thus, the 60 phased A-tracts in the 720-bp insert of Atract60 are expected to produce a cumulative axial bend of ≈780°, or two static DNA loops. Linearization of the circular Atract60 plasmid by enzymatic cutting at a single site near the 720-bp insert produced a linear 3.7-kb DNA with the two static loops near one end.
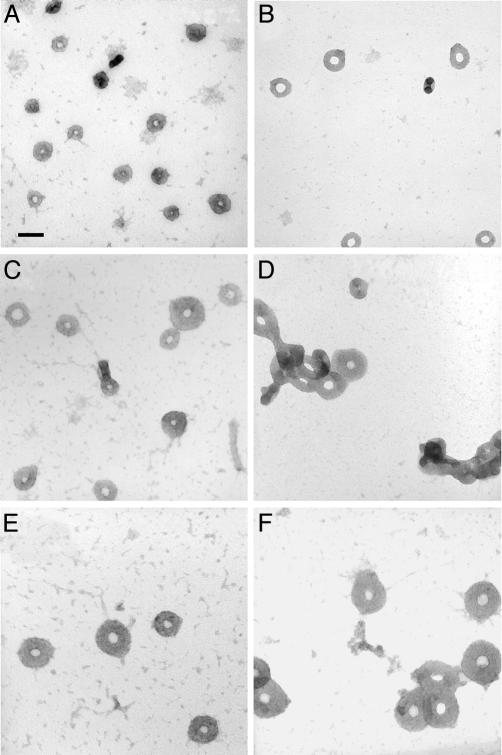
Salt and Static Curvature Affect Toroid Dimensions. DNA condensation in vitro by multivalent cations follows a nucleation-growth process (25, 28). The nucleation event for DNA condensation into toroidal particles has been proposed to be the spontaneous formation of a DNA loop along the polymer in solution (29). The introduction of two static loops provides Atract60 with a “built-in” site for toroid nucleation, which is expected to be kinetically favored for nucleation over loops that transiently form because of random polymer fluctuations (26). Condensation of Atract60 by the addition of the trivalent inorganic cation hexammine cobalt (III) produces smaller toroids than those formed by 3kbDNA, under the same “low-salt” solution conditions of 0.5× TE buffer, pH 7.8 (Fig. 1 A and B). Toroids produced by Atract60 condensation have a mean outer diameter of 68 nm, whereas 3kbDNA condenses into toroids with a mean outer diameter of 80 nm. Because the static loops of Atract60 are on average smaller than loops that are expected to spontaneously form along linear DNA at room temperature, i.e., 30–40 nm versus ≈50 nm (see below), these results demonstrate that the size of the initial nucleation loop in toroid formation is a principal factor in determining the overall size of toroidal DNA condensates.
Fig. 1.
Transmission electron micrographs of toroids produced by the condensation of DNA with hexammine cobalt (III). (A) Atract60 condensed in the low-salt buffer (0.5× TE: 5 mM Tris/0.5 mM EDTA). Atract60 is a linear 3,681-bp DNA with extensive sequence-directed curvature near one end. (B) 3kbDNA condensed in the low-salt buffer. 3kbDNA is a linear 2,961-bp plasmid DNA. (C) 3kbDNA condensed in 2.5 mM NaCl, 0.5× TE. (D) 3kbDNA condensed in 1.75 mM MgCl2/0.5× TE. (E) 3kbDNA condensed in 3.75 mM NaCl/0.5× TE. (F) 3kbDNA condensed in 2.5 mM MgCl2/0.5× TE. All samples were 8.5 μg/ml in DNA and 100 μM hexammine cobalt chloride. (Scale bar: 100 nm.)
The effects of increasing ionic strength on the condensation of 3kbDNA were also investigated. Millimolar increases in NaCl concentration to 3kbDNA DNA samples, initially in a low-salt solution, produce significantly larger toroids upon condensation by hexammine cobalt (III). For example, 3kbDNA toroids formed in the presence of 2.5 mM NaCl have a mean outer diameter of 90 nm, as compared with 80 nm with no added salt (Fig. 1 B and C). This shift in mean outer diameter is caused primarily by the presence of considerably larger toroids, along with toroids similar in size to those in the low-salt sample (Fig. 1C). When the NaCl concentration is increased further to 3.75 mM the mean outer diameter increases an additional 20% to 118 nm, with essentially all toroids being of the larger size (Fig. 1E). At ≈4.5 mM NaCl, fiber-like condensates are formed instead of toroids (data not shown).
The effects of divalent cations on DNA toroid dimensions were studied by the addition of MgCl2 to the 3kbDNA solution before condensation with hexammine cobalt (III). Toroidal condensates produced from a DNA solution 1.75 mM in MgCl2 are comparable in outer diameter to those of a sample 3.75 mM in NaCl (Fig. 1 D and E). At 1.75 mM MgCl2 the ionic strength of the sample is approximately the same as that of the 3.75-mM NaCl sample, if the chelating effect of the 0.5 mM EDTA is taken into account. This observation suggests that the increase in toroid size at 3.75 mM NaCl and 1.75 mM MgCl2 is purely an effect of ionic strength and not dependent on cationic species. However, one notable difference between these two preparations is an increased aggregation of toroids in the MgCl2 sample (Fig. 1D). At 2.5 mM MgCl2 the mean outer diameter of 3kbDNA toroids increased to 158 nm, which is twice the size of the low-salt condensates (Fig. 1F). At MgCl2 concentrations >2.5 mM fiber-like DNA condensates become the dominant morphology, similar to what is observed with increasing NaCl concentrations. However, for MgCl2 the transition to fiber-like condensates occurs at an ionic strength that is approximately two times the ionic strength at which the same transition occurs for samples with added NaCl.
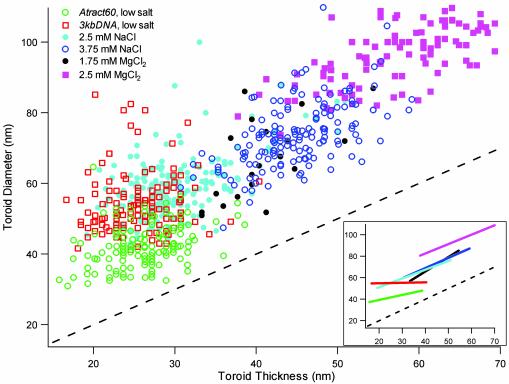
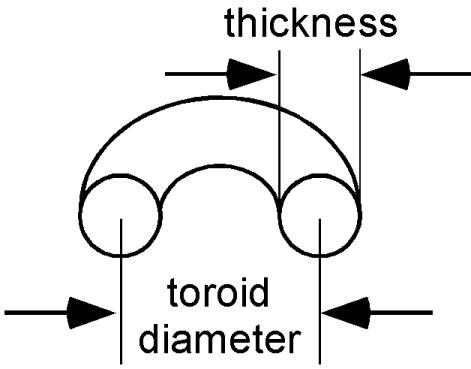
Toroid Diameter and Thickness Are Not Strictly Coupled. A systematic comparison of toroids produced by the condensation of 3kbDNA and Atract60 provides substantial insights into the process of toroid formation. In Fig. 2 the toroid diameter of each DNA condensate measured in this study is plotted with respect to its thickness. Here toroid diameter refers to the average of the outer diameter and the hole (i.e., inner) diameter for a given toroid (Scheme 1). Toroid outer diameters and hole diameters have typically been reported in studies of DNA toroids (12, 19, 30, 31). However, we have found that analysis of the toroid diameter and thickness is potentially more useful for understanding the process of DNA toroid formation.
Fig. 2.
A plot of toroid diameter versus thickness for all DNA toroids measured. Toroid diameter is defined as an arithmetic mean of the outside diameter of the toroid and the diameter of the toroid hole. Toroid thickness is defined as the difference between toroid diameter and the diameter of the toroid hole. The dashed line represents the position in the plot where toroid diameter is equal to toroid thickness. Toroid data points that fall along this line would have a hole diameter of zero (observed as spheroids). All data sets with added salt were for condensates of 3kbDNA. (Inset) A plot of linear best-fit lines for the toroid diameter versus thickness data sets. Line colors correspond to data legend in the larger plot. Descriptions of Atract60 and 3kbDNA DNA and condensation conditions are given in Fig. 1.
Scheme 1.
Definition of toroid diameter and thickness.
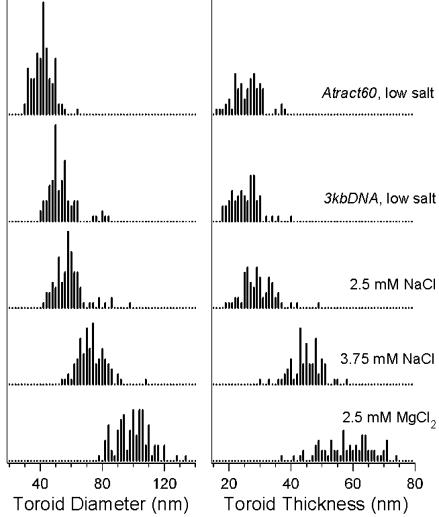
Toroids produced by the condensation of 3kbDNA in the low-salt buffer have a mean toroid diameter of 55 nm and a mean thickness of 25 nm (Fig. 3). If we approximate the cross section of DNA toroids as circular, then a simple volume calculation based on diameter and thickness measurements indicates that 98% of the low-salt 3kbDNA toroids contain from 6 to 32 3kbDNA molecules per toroid. Thus, during formation a growing toroid must add DNA molecules until toroid growth becomes limited either by a kinetic factor (e.g., no free DNA remains in solution) or a thermodynamic factor (e.g., an equilibrium state for optimal toroid thickness is reached).
Fig. 3.
Histograms of toroid diameter and thickness measurements for toroidal DNA condensates. DNA and salt conditions for toroid diameter data sets correspond to those given to the right of the graph for the toroid thickness data. All data sets with added salt were for condensates of 3kbDNA. Descriptions of Atract60 and 3kbDNA DNA and condensation conditions are given in Fig. 1.
If during DNA toroid formation the thickness of a toroid increases equally outward and inward from the nucleation loop, then the toroid diameter will remain equal to the diameter of the nucleation loop. Under the conditions of our studies (i.e., ionic strength >1 mM) the most probable size of loops that spontaneously form along a DNA polymer is ≈50 nm in diameter (29). This finding is very close to the measured mean toroid diameter of 55 nm for the low-salt 3kbDNA toroids, which supports the proposal that toroid diameter is largely determined by nucleation loop diameter and that growth in toroid thickness proceeds equally outward and inward from the nucleation loop (29, 32).
Condensation of Atract60 in the low-salt buffer produces toroids with a mean toroid diameter of 42 nm, which is the smallest reported in this study (Figs. 2 and 3). This reduced mean diameter of Atract60 toroids is a direct result of the static loops in Atract60, because the conditions of condensation were identical to those of the low-salt 3kbDNA condensation. If we assume equal outward and inward growth for Atract60 toroids from the static nucleation loops, then the 60 A-tracts in this DNA produce loops ≈42 nm in diameter. This finding would imply that each A-tract contributes an axial bend of ≈11° to the overall curvature of the 720-bp insert, an angle that is not unreasonable considering the previously determined value of 13° for a single A-tract bend (27). This correlation between Atract60 mean toroid diameter and the expected size of A-tract loops provides further support that, in our low-salt buffer, toroid diameter is determined by the nucleation loop and toroid growth proceeds both outward and inward from the nucleation loop(s).
The mean thickness of Atract60 and 3kbDNA toroids is essentially the same at 26 and 25 nm, respectively (Figs. 2 and 3). Thus, reducing toroid size by providing smaller static loops for nucleation does not change toroid thickness. This result provides definitive evidence that toroid thickness is independent of nucleation loop size. Another manifestation of the fact that toroid thickness is independent of nucleation loop size/toroid diameter is the zero slope of a linear fit of the low-salt 3kbDNA toroid diameter versus thickness data (Fig. 2 Inset). If toroid thickness was coupled to toroid diameter for this data set, a nonzero slope would be expected.
It is possible that our estimate of the axial bend per A-tract of ≈11° is less than the reported value of 13° because these bends are actually not as pronounced in our particular experimental conditions. However, there are other plausible explanations. Because of the extremely small radius of curvature of the Atract60 holes (Fig. 1 A), the bending energy of DNA wound near the hole of Atract60 toroids is expected to be significantly greater than DNA wound around the outside of these toroids (33, 34). Thus, it is possible that for Atract60 toroids growth is altered slightly such that DNA deposition is biased more toward outward growth than inward growth from the static nucleation loops. This would result in a mean toroid diameter of Atract60 toroids that is larger than the actual size of the nucleation loops, and hence an underestimation of the actual bend per A-tract. This would also explain the positive slope observed for the linear fit of the Atract60 toroid diameter versus thickness data (Fig. 2 Inset). A second possibility is that a systematic bias has been introduced into our Atract60 data that artificially increased the observed mean toroid diameter. In the present study, measurements were collected only for toroids with a clearly defined hole. If a significant percentage of Atract60 toroids grow to a thickness that obscures their hole, the exclusion of these DNA particles from our data set would artificially increase the mean toroid diameter (reducing the apparent axial bend per A-tract) and cause a positive slope in the linear fit to the Atract60 data set.
Analysis of toroid diameter and thickness for toroids produced by the condensation of 3kbDNA in low-salt solutions supports the following model for toroid growth (Scheme 2). The first step in toroid formation is the spontaneous formation of a DNA loop along a 3kbDNA polymer. This loop acts as the nucleation site for condensation on which the remainder of the DNA polymer condenses, forming a proto-toroid. Additional 3kbDNA polymers condense onto the proto-toroid, which increases the thickness of the growing toroid. The DNA wraps around the toroid such that the toroid grows both outward and inward, keeping the toroid diameter relatively constant. The toroid continues to grow in this manner until it reaches a limiting thickness. For Atract60 toroids, this model is slightly altered because the initial state of the DNA polymer contains static loops, allowing Atract60 to bypass the nucleation step in toroid formation.
Scheme 2.
Toroid nucleation and growth with equal outward and inward growth from the nucleation loop. The black circle on the proto-toroid (second from right) and the fully grown toroid (right) illustrates the size of the nucleation loop.
Increased Ionic Strength Alters Toroid Growth. The mean toroid diameter and mean thickness of 3kbDNA condensates increase with ionic strength. For a 3kbDNA sample in 2.5 mM NaCl this shift is appreciable, although there is still a significant amount of overlap for both toroid diameter and thickness measurements with the low-salt measurements (Figs. 2 and 3). At 3.75 mM NaCl and 1.75 mM MgCl2, both diameter and thickness measurements are substantially offset from the low-salt data (Figs. 2 and 3). The mean toroid diameters measured for the 2.5-mM and 3.75-mM NaCl samples are 59 and 74 nm, respectively, whereas the mean toroid diameter of the low-salt sample is 55 nm. The 1.75-mM MgCl2 data are similar to the 3.75-mM NaCl data (approximately equal ionic strength), except that fewer data points were collected because of toroid aggregation in the 1.75-mM MgCl2 sample. With increasing ionic strength, an increase in the slope of a linear fit of toroid diameter versus thickness data is also observed; a slope of 0.8 is observed for the 2.5-mM NaCl 3kbDNA sample and a slope of 0.9 for the 3.75-mM NaCl 3kbDNA sample (Fig. 2 Inset).
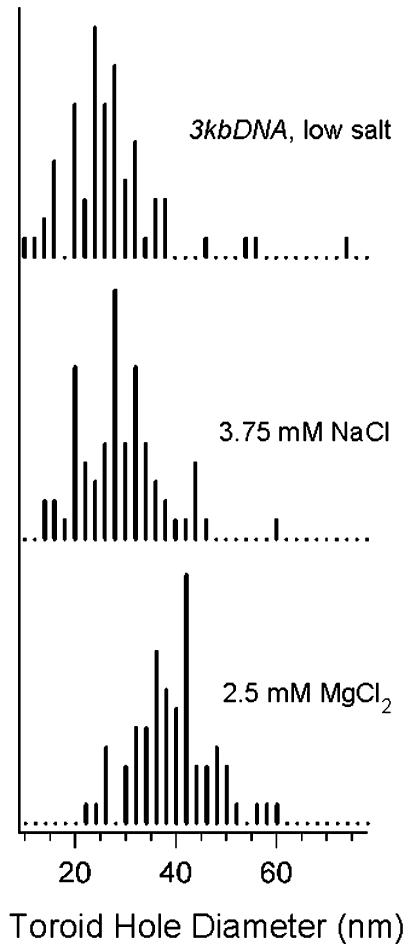
The relatively equal offset of the 3kbDNA toroid data from the dashed line in Fig. 2, for all but the highest MgCl2 concentration sample, indicates a close similarity in the distribution of toroid hole diameters for these various salt conditions. This is more easily appreciated by a direct comparison of the hole diameters of the low-salt buffer toroids with the hole diameters of the 3.75-mM NaCl toroids (Fig. 4). From the histograms presented in Fig. 4 it is clear that the distributions of the hole diameters are essentially the same, even though the toroid diameter and thickness measurements for the same two samples are significantly different (Fig. 3). Similar distributions (i.e., approximately equal mean and SD) are also seen for the 2.5-mM NaCl and 1.75-mM MgCl2 samples. This finding suggests that the hole diameter of a toroid is less sensitive to changes in the ionic strength than toroid diameter, thickness, or outer diameter.
Fig. 4.
Histograms of toroid hole diameters for 3kbDNA condensed in three different salt solutions. Descriptions of 3kbDNA DNA and condensation conditions are given in Fig. 1.
Above ≈1 mM monovalent cation concentration the persistence length of DNA does not vary for higher salt concentrations (35–37). Thus, the average size of the loops that spontaneously form along a 3kbDNA should be approximately the same for all solution conditions of this study, given that the 0.5× TE buffer alone is >2 mM in monovalent cations. If the nucleation loop is the same for the toroid samples with the same hole size (Fig. 4), then the observed change in toroid diameter must be caused by growth being more favored outward than inward from the nucleation loop. This proposal is supported by the positive slopes of the linear best-fit lines to the toroid diameter versus thickness data (Fig. 2). Additional support is given by the increase in mean thickness of 3kbDNA toroids of the 3.75-mM NaCl sample from the low-salt data. The difference in mean toroid thickness between these two samples is 18 nm, which is also the observed difference in the mean toroid diameter. This is exactly as expected if the mean nucleation loop size for the 3.75-mM NaCl sample is equal to that of the low-salt sample. However, DNA added onto the 3.75-mM NaCl toroids beyond that of low-salt toroid growth is added exclusively to the outside of the toroid.
Based on the observation that mean toroid diameter and thickness increase whereas mean hole diameter remains constant, a second model of toroid growth emerges for our intermediate ionic strength conditions (Scheme 3). Nucleation occurs and toroid growth follows the same preliminary growth pathway as the low-salt model (Scheme 2). However, in the presence of additional ions, there is a secondary growth that results in the addition of DNA exclusively to the outside of the toroid.
Scheme 3.
Toroid nucleation and growth with preferential growth outward from the nucleation loop during the latter stage of toroid formation.
2.5 mM MgCl2 Causes a Greater Increase in Toroid Diameter than Toroid Thickness. Condensation of 3kbDNA in 2.5 mM MgCl2 produced toroids with a mean toroid diameter of 99 nm, which is nearly twice the 55-nm mean toroid diameter of the low-salt preparation. The mean thickness of toroids produced in the presence of 2.5 mM MgCl2, 59 nm, is also considerably larger than the mean thickness of any other toroid preparation of the present study (Fig. 2 and 3). As the MgCl2 concentration of the DNA solution was increased >2.5 mM the condensation process underwent a transition where toroids were replaced by fiber-like condensates as the dominant structure (data not shown).
The linear fit of toroid diameter versus thickness for the 2.5-mM MgCl2 data has a slope of 0.9, which is the same as the slope of the 3.75-mM NaCl data. This slope is again indicative of toroid diameter and thickness being coupled and can be understood as a result of preferential outward growth in toroid thickness from the nucleation loop. However, the position of the 2.5-mM MgCl2 best-fit line is further removed from the dashed line in Fig. 2 than the best-fit lines for all other data sets (Fig. 2 Inset). The shift in this line indicates a greater change in mean toroid diameter than thickness for the 2.5-mM MgCl2, with respect to the intermediate salt concentration data. This finding cannot be explained as being the result of a further bias toward outward growth as described in Scheme 3, because in that event the 2.5-mM MgCl2 data points would be expected to move along the line of the 3.75-mM NaCl data. The easiest way to appreciate the effect of this unequal shift in toroid diameter versus thickness for the 2.5-mM MgCl2 toroids is that these toroids have larger holes than the other 3kbDNA samples (Fig. 4). The models presented thus far for toroid formation do not explain this result for the 2.5-mM MgCl2 sample.
The increase in the offset of the 2.5-mM MgCl2 toroid diameter/thickness data from the dashed line in Fig. 2 could be explained by an increase in nucleation loop size. However, the size of loops that spontaneously form along the DNA polymer should not be appreciably affected by the relatively small increase in ionic strength between the 2.5-mM MgCl2 sample and the 1.75-mM MgCl2 sample, as previous reports have shown that with increasing divalent cation concentrations the persistence length of DNA changes only minimally once the divalent cation concentration is >0.1 mM. As an alternative explanation, we propose that an annealing process occurs in the presence of 2.5 mM MgCl2 in which larger loops are selected from the ensemble of loop sizes that form spontaneously during the initial stage of condensation (Scheme 4). This may occur by the following two mechanisms. The first possibility is that in 2.5 mM MgCl2 competition between Mg2+ and hexammine cobalt (III) for interaction with DNA reduces the DNA–DNA association energy such that proto-toroids formed by the condensation of a single DNA polymer are near the edge of stability, and proto-toroids formed with relatively small loops have too much bending energy to persist long enough to go onto the next stage of toroid growth. The breakup of the smaller (i.e., higher energy) proto-toroids would produce a bias toward toroids nucleated from larger loops. A second possibility, suggested by computer simulations of DNA condensation (38), is that during toroid nucleation the DNA in the first loops of the proto-toroid slide past one another to reduce bending strain in the condensed DNA and thereby increase their diameters, and ultimately the diameters of full-grown toroids. It is not possible from the current study to determine which mode of toroid growth is more likely, and it is possible that both mechanisms are active.
Scheme 4.
Toroid nucleation and growth with annealing to larger nucleation loop sizes during the early stage of formation, and preferential outward growth during the latter stage of toroid formation.
Toroid Thickness Limits as a Function of Salt. Several theories have been put forth as attempts to explain why toroids and other DNA condensate morphologies grow to a particular size (19, 21, 22, 24, 37). A common target of these theories has been to determine the origin of a limitation on DNA bundle size, or thickness/number of windings in the case of toroids. We have shown that toroid nucleation loop size can be understood in terms of DNA flexibility or static curvature. However, the origin of a limit on toroid thickness is more obscure. Examples of thermodynamic models for the physical limits on toroid growth include the model of Bloomfield (19) in which a net build-up of uncompensated negative charge in the DNA of a toroid produces an electrostatic repulsion, and the more recent model of Ray and Manning (24) predicts that pair potentials of DNA molecules with associated counter ions will depend on distance in such a way that an optimum bundle size results from the balance of short-range attractive interactions and long-range repulsive interactions between polyanions. Ha and Liu (23) have also argued for a kinetic origin for the source of a limitation on DNA bundle thickness. It has been difficult to fully assess the relative validity of these theories because of the lack of systematic studies of toroid size as a function of a fundamental physical parameter. Here we have shown a clear correlation exists between ionic strength and toroid thickness, which could be useful in this regard.
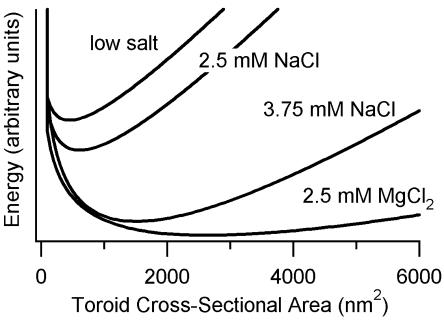
Theoretical models for the origins of limitations to DNA condensate bundle size or toroid thickness have typically developed a relationship between an energy term and the cross-sectional area of a DNA condensate rather than thickness per se. If we make the approximation that the toroids of this study have circular cross sections, we can calculate the cross-sectional areas of toroids based on their thickness measurements. Histograms of approximate cross-sectional area were generated in this manner and then fit with a continuous function to produce idealized cross-sectional area distributions. From these distributions, the energy potential curves were calculated by using the Boltzman equation (Fig. 5). These energy potential curves illustrate how the shape and the minimum of the toroid cross-sectional area potential change with added salt. It may be fruitful to test present and future theoretical models of DNA toroid growth limits and DNA condensate bundle size for quantitative agreement with these potential energy curves.
Fig. 5.
Plots of energy potential as a function of toroid cross-sectional area for 3kbDNA condensed in various salt solutions. Probability distributions of toroid cross-sectional areas were calculated by using data shown in Fig. 3 and assuming a circular cross section for toroids. The resulting distributions were fit with asymmetrical χ2 distribution functions and converted to potential energy curves by using the Boltzman equation. The vertical energy scale for all curves is the same; however, units are not given because the absolute energy and energy difference between curves could not be determined.
Concluding Remarks
We have demonstrated that both nucleation loop size and solution conditions (e.g., ionic strength) play significant roles in determining DNA toroid dimensions. We have also presented models that suggest how toroid nucleation and growth are affected by ionic strength. The data presented here should prove to be of value as a test for future theories for the physical origin of limitations on DNA toroid formation and growth. Finally, our results illustrate that by using static structures and specific solution conditions, the diameter and thickness of toroidal DNA condensates produced in vitro can be controlled continuously over a range of values that extends at least a factor of 2.
Acknowledgments
We thank the Georgia Institute of Technology Electron Microscopy Center for the use of its JEOL-100C microscope and Yolande Berta for technical assistance. We gratefully acknowledge the National Institutes of Health for the financial support of this research (Grant GM62873).
References
- 1.van Holde, K. (1989) Chromatin (Springer, New York).
- 2.Tikchonenko, T. (1975) in Comprehensive Virology, eds. Fraenkel-Conrat, H. & Wagner, R. (Plenum, New York), pp. 1–117.
- 3.Allen, M., Lee, J., Lee, C. & Balhorn, R. (1996) Mol. Reprod. Dev. 45, 87–92. [DOI] [PubMed] [Google Scholar]
- 4.Hud, N. V. (1995) Biophys. J. 69, 1355–1362. [DOI] [PMC free article] [PubMed] [Google Scholar]
- 5.Klimenko, S., Tikchonenko, T. & Andreev, V. (1967) J. Mol. Biol. 23, 523–533. [DOI] [PubMed] [Google Scholar]
- 6.Cerritelli, M., Cheng, N., Rosenberg, A., McPherson, C., Booy, F. & Steven, A. (1997) Cell 91, 271–280. [DOI] [PubMed] [Google Scholar]
- 7.Plank, C., Tang, M. X., Wolfe, A. R. & Szoka, F. C., Jr. (1999) Hum. Gene Ther. 10, 319–332. [DOI] [PubMed] [Google Scholar]
- 8.Rolland, A. (1998) Crit. Rev. Ther. Drug Carrier Syst. 15, 143–198. [DOI] [PubMed] [Google Scholar]
- 9.Luo, D. & Saltzman, W. (2000) Nat. Biotechnol. 18, 33–37. [DOI] [PubMed] [Google Scholar]
- 10.Mahato, R., Smith, L. & Rolland, A. (1999) Adv. Genet. 41, 95–155. [DOI] [PubMed] [Google Scholar]
- 11.Gosule, L. C. & Schellman, J. A. (1976) Nature 259, 333–335. [DOI] [PubMed] [Google Scholar]
- 12.Allison, S. A., Herr, J. C. & Schurr, J. M. (1981) Biopolymers 20, 469–488. [DOI] [PubMed] [Google Scholar]
- 13.Yoshikawa, Y., Yoshikawa, K. & Kanbe, T. (1999) Langmuir 15, 4085–4088. [Google Scholar]
- 14.Richards, K. E., Williams, R. C. & Calendar, R. (1973) J. Mol. Biol. 190, 255–259. [DOI] [PubMed] [Google Scholar]
- 15.Hud, N. V., Allen, M. J., Downing, K. H., Lee, J. & Balhorn, R. (1993) Biochem. Biophys. Res. Commun. 193, 1347–1354. [DOI] [PubMed] [Google Scholar]
- 16.Earnshaw, W. C., King, J., Harrison, S. C. & Eiserling, F. A. (1978) Cell 14, 559–568. [DOI] [PubMed] [Google Scholar]
- 17.Wagner, E., Cotten, M., Foisner, R. & Birnstiel, M. (1991) Proc. Natl. Acad. Sci. USA 88, 4255–4259. [DOI] [PMC free article] [PubMed] [Google Scholar]
- 18.Kwoh, D., Coffin, C. C., Lollo, C. P., Jovenal, J., Banaszczyk, M. G., Mullen, P., Phillips, A., Amini, A., Fabrycki, J., Bartholomew, R., et al. (1999) Biochim. Biophys. Acta 1444, 171–190. [DOI] [PubMed] [Google Scholar]
- 19.Bloomfield, V. A. (1991) Biopolymers 31, 1471–1481. [DOI] [PubMed] [Google Scholar]
- 20.Ubbink, J. & Odjik, T. (1995) Biophys. J. 68, 54–61. [DOI] [PMC free article] [PubMed] [Google Scholar]
- 21.Vasilevskaya, V. V., Khokhlov, A. R., Kidoaki, S. & Yoshikawa, K. (1997) Biopolymers 41, 51–60. [Google Scholar]
- 22.Park, S. Y., Harries, D. & Gelbart, W. M. (1998) Biophys. J. 75, 714–720. [DOI] [PMC free article] [PubMed] [Google Scholar]
- 23.Ha, B. Y. & Liu, A. J. (1999) Europhys. Lett. 46, 624–630. [Google Scholar]
- 24.Ray, J. & Manning, G. S. (2000) Macromolecules 33, 2901–2908. [Google Scholar]
- 25.Sakaue, T. & Yoshikawa, K. (2002) J. Chem. Phys. 117, 6323–6330. [Google Scholar]
- 26.Shen, M., Downing, K., Balhorn, R. & Hud, N. V. (2000) J. Am. Chem. Soc. 122, 4833–4834. [Google Scholar]
- 27.Rivetti, C., Walker, C. & Bustamante, C. (1998) J. Mol. Biol. 280, 41–59. [DOI] [PubMed] [Google Scholar]
- 28.Baumann, C. G., Bloomfield, V. A., Smith, S. B., Bustamante, C. & Wang, M. D. (2000) Biophys. J. 78, 1965–1978. [DOI] [PMC free article] [PubMed] [Google Scholar]
- 29.Hud, N. V., Downing, K. H. & Balhorn, R. (1995) Proc. Natl. Acad. Sci. USA 92, 3581–3585. [DOI] [PMC free article] [PubMed] [Google Scholar]
- 30.Widom, J. & Baldwin, R. L. (1980) J. Mol. Biol. 144, 431–453. [DOI] [PubMed] [Google Scholar]
- 31.Arscott, P. G., Li, A.-Z. & Bloomfield, V. A. (1990) Biopolymers 30, 619–630. [DOI] [PubMed] [Google Scholar]
- 32.Hud, N. V. & Downing, K. H. (2001) Proc. Natl. Acad. Sci. USA 98, 14925–14930. [DOI] [PMC free article] [PubMed] [Google Scholar]
- 33.Schurr, J. M. & Schmitz, K. S. (1986) Annu. Rev. Phys. Chem. 37, 271–305. [Google Scholar]
- 34.Bloomfield, V. A., Crothers, D. M. & Tinoco, I., Jr. (2000) Physical Chemistry of Nucleic Acids (Harper & Row, New York).
- 35.Porschke, D. (1986) J. Biomol. Struct. Dyn. 4, 373–389. [DOI] [PubMed] [Google Scholar]
- 36.Hagerman, P. J. (1988) Annu. Rev. Biophys. Chem. 17, 265–286. [DOI] [PubMed] [Google Scholar]
- 37.Lu, Y., Weers, B. & Stellwagen, N. C. (2002) Bioploymers 61, 261–275. [DOI] [PubMed] [Google Scholar]
- 38.Noguchi, N. & Yoshikawa, K. (2000) J. Chem. Phys. 113, 854–862. [Google Scholar]


