Abstract
We have examined gene expression in the fat tissue of normal mice at the onset of diet-induced obesity. Insulin-induced gene 1 (insig-1) mRNA rose progressively with a high-fat diet and declined on a restricted diet. Because insig-1 binds sterol regulatory element-binding protein cleavage-activating protein in the endoplasmic reticulum, thereby blocking proteolytic processing required for sterol regulatory element-binding protein activation, we tested its influence on lipogenesis. In differentiating 3T3-L1 cells, insig-1 and -2 rose in parallel with aP2 mRNA during differentiation. The mRNA of the lipogenic transcription factor, carbohydrate response element-binding protein, was undetectable in undifferentiated 3T3-L1 preadipocytes but rose dramatically during differentiation in 25 mM, but not in 5 mM, glucose. Transfection of mouse or human insig-1 into 3T3-L1 preadipocytes completely prevented oil red O staining and blocked upregulation of aP2, peroxisome proliferator-activated receptor γ2, and carbohydrate response element-binding protein, while reducing down-regulation of preadipocyte factor 1. The results suggest that insig-1 expression restricts lipogenesis in mature adipocytes and blocks differentiation in preadipocytes.
Insulin-induced gene 1 (insig-1) mRNA increases dramatically in fat tissue of normal rats at the onset of diet-induced obesity (1). It was originally cloned by Peng et al. in regenerating liver (2), but its function was unknown until Yang et al. (3) demonstrated that it binds sterol regulatory element-binding protein (SREBP) cleavage-activating protein (SCAP). Because SCAP escorts SREBP from the endoplasmic reticulum to the Golgi for proteolytic processing into an active transcription factor, the binding of SCAP by insig-1 effectively prevents SREBP activation and thus blocks its action on gene transcription (3).
SREBP-1c, an SREBP isoform that regulates expression of lipogenic enzymes (4) and adipocyte differentiation (5), also requires SCAP for activation (6). It seemed likely, therefore, that the increased insig-1 expression in adipocytes might inhibit adipogenesis and/or lipogenesis. If so, variations in insig-1 expression could shape the anatomy of the fat-storage compartment of the body and the disposition of caloric surplus during chronic overnutrition. Furthermore, because the gene-expression pattern of adipose tissue changes drastically when adipocytes can no longer accommodate additional fat (1), insig-1 could determine indirectly the expression of many important gene products involved in adipocyte recruitment and hyperplasia. This study was designed to assess the role of insig-1 in adipocyte lipogenesis and preadipocyte differentiation.
Materials and Methods
Animal Care and Treatment. All experimental procedures involving the production and use of laboratory mice complied with National Institutes of Health guidelines as approved by the Institutional Animal Care and Use Committee of University of Texas Southwestern Medical Center and Veterans Affairs Medical Center (Dallas). Male C57BL/6J mice (The Jackson Laboratory) were 4 weeks old at the beginning of the study and weighed 18–22 g. All mice had free access to standard chow (5% fat by calories; Teklad-D12492, Teklad, Madison, WI) or high-fat chow (60% fat by calories, Research Diets, New Brunswick, NJ) and water. Mice were anesthetized with 1 ml/kg ketamine, 20 mg/ml xylazine, and 10 mg/ml acepromazine injected i.p., and they were killed by exsanguination. Plasma was stored at -80°C. Epididymal fat tissue was dissected immediately after exsanguination, frozen in liquid nitrogen, and stored at -80°C. Nine-week-old Sprague–Dawley rats were fed with either 15 or 30 g per day of chow diet for 4 days, the epididymal fat pad was preserved, and RNA was isolated. Institutional guidelines for animal care were adhered to.
RNA Isolation and cDNA Synthesis. Total RNA was isolated from mouse epididymal fat pads or from cultured 3T3 L1 cells by using TRIzol reagent according to the protocol supplied by the manufacturer (Life Technologies, Grand Island, NY). cDNA was synthesized with the random hexamer primer by using TaqMan reverse transcript reagents (Applied Biosystems).
Cell Culture and Treatments. 3T3 L1 preadipocytes were maintained in DMEM containing 10% calf serum and penicillin/streptomycin at 37°C in 5% CO2. Preadipocytes were differentiated into adipocytes by culturing in the standard medium containing 1 μg/ml insulin, 0.1 μg/ml dexamethasone, and 100 μg/ml 3-isobutyl-1-methylxanthine (IBMX).
In certain experiments a 1 mM mixture of BSA-conjugated free fatty acids (oleate:palmitate-2:1) was added to the medium containing either 25 or 5.0 mM glucose. Total RNA was isolated at day 9 or at intermediate time points for gene expression analysis.
Oil Red O Staining. On day 9, the cells were fixed in 10% formaldehyde and stained by oil red O. Pictures were captured with a Sony CCS-IRIS at ×40 magnification. The lipid level of cells was estimated by measuring the area of oil red O staining in confluent cells by using the IMAGE J image analysis program developed at the National Institutes of Health.
mRNA Measurements. mRNA was measured by Northern blotting or real-time RT-PCR. The cDNA probes for Northern blotting were generated by the PCR cloning method, with reverse-transcribed rat adipose cDNA as template, and confirmed by DNA sequencing. The probes were excised from TA cloning vector and gel purified. The blotted filters were exposed for 12 h in a GS-363 phosphoimager (Bio-Rad).
Taqman real-time RT-PCR reactions contained 10 ng of reverse-transcribed cDNA, 900 nM forward/reverse primer, and 2× PCR master mix (Applied Biosystems) in a final volume of 10 μl. PCRs were carried out in 384-well plates by using the ABI Prism 7900HT Sequence Detection System (Applied Biosystems). All reactions were done in triplicate. The amount of mRNA was calculated by the comparative cycle time method using the standard curve method, except for stearoyl-coenzyme A desaturase 1 (SCD-1) and carbohydrate response element-binding protein (ChREBP), which were calculated by the comparative CT method. SYBR Green PCR Master Mix was used for SCD-1 and ChREBP mRNA estimation. In these determinations 180 nM forward/reverse primer was used without the addition of internal probe. 18S or 36B4 mRNA was used as the internal control in all studies. The sequences used are indicated in Table 1.
Table 1. Primers and probes used.
| Gene | Accession no. | Forward/reverse primers | Probes |
|---|---|---|---|
| ACC | AF374169 | 5′-CCCAGCAGAATAAAGCTACTTTGG | 5′-TGAGCATGGCATCCGGCGACT |
| 5′-TCCTTTTGTGCAACTAGGAACGT | |||
| FAS | XM_126624 | 5′-CCTGGATAGCATTCCGAACCT | 5′-CCTGAGGGACCCTACCGCATAGC |
| 5′-AGCACATCTCGAAGGCTACACA | |||
| GPAT | NM_008149 | 5′-CAACACCATCCCCGACATC | 5′-TCGTCATACCCGTGGGCATCTCG |
| 5′-GTGACCTTCGATTATG CGATCA | |||
| PGC-1 | AF049330 | 5′-GATGGCACGCAGCCCTAT | 5′-CATTGTTCGATGTGTCGCCTTCTTGCT |
| 5′-CTCGACACGGAGAGTTAAAGGAA | |||
| PPAR α | X57638 | 5′-CTGCAGAGCAACCATCCAGAT | 5′-CACCTTCCTCTTCCCAAAGCTCCTTCA |
| 5′-GCCGAAGGTCCACCATTTT | |||
| PPAR γ | NM_011146 | 5′-ATGCCAAAAATATCCCTGGTTTC | 5′-CCAAGTGACTCTGCTCAAGTATGGTGTCCAT |
| 5′-GGAGGCCAGCATGGTGTAGA | |||
| Insig-1 | NM_153526 | 5′-TTTGTGGTGGACATTTGATCGT | 5′-CCCGAAGCGGCCTTGGGC |
| 5′-GCTAGGAAGGCGATGGTAATCC | |||
| SREBP-1c | NM_011480 | 5′-GGCACTAAGTGCCCTCAACCT | 5′-TGCGCAGGAGATGCTATCTCCA |
| 5′-GCCACATAGATCTCTGCCAGTGT | |||
| aP2 | NM_024406 | 5′-GCGTGGAATTCGATGAAATCA | 5′-CT CTT CAC CTT CCT GTC GTC TGC G |
| 5′-CCCGCCATCTAGGGTTATGA | |||
| Pref-1 | NM_010052 | 5′-AATAGACGTTCGGGCTTGCA | 5′-TCC AGG TCC ACG CAA GTT CCA TTG TT |
| 5′-GGAGCATTCGTACTGGCCTTT | |||
| Insig-2* | AY156087 | 5′-CCGGGCAGAGCTCAGGAT | |
| 5′-GAAGCAGACCAATGTTTCAATGG | |||
| ChREBP* | NM_021455 | 5′-GTCCGATATCTCCGACACACTCTT | |
| 5′-CATTGCCAACATAAGCATCTTCTG | |||
| SCD1* | M21285 | 5′-CCGGAGACCCTTAGATCGA | |
| 5′-TAGCCTGTAAAAGATTTCTGCAAACC | |||
| 36B4 | NM_007475 | 5′-GGACCCGAGAAGACCTCCTT | 5′-TCCAGGCTTTGGGCATCACC |
| 5′-GGTGCCTCTGGAGATTTTCG |
SYBR primers
Plasmid Construction and Cell Culture. Mouse insig-1 cDNA was obtained by RT-PCR by using mouse liver RNA and the following primers: 5′-CTG GAC GCC GAT GCC CAG GC and 5′-GTC ACT GTG AGG CTT TTCCG (human insig-1, 5′-ATG CCC AGA TTG CAC GAC CA; reverse, ATC ACT ATG GGG CTT TTC AGG). The PCR product was cloned into pcDNA3.1v5 vector (Invitrogen) and the sequence was verified by DNA sequencing. The 3T3 L1 cells were maintained in culture as described above. To produce insig-1-overexpressing preadipocytes, 3T3-L1 cells were transfected with insig-1. Empty vector was transfected into other cells as a control. In brief, cells with 40–60% confluence were transfected with 1 μg of pcDNA3.1 v5 plasmid by using Effective Transfection Reagent (Qiagen, Valencia, CA) as recommended by the manufacturer. After 48 h, cells were subjected to 0.5 mg/ml G418 selection for 10 days. The cells from pooled clones were used for differentiation. V5-tagged insig-1 was detected by Western blotting by using anti-V5 antibody (Invitrogen). Total RNA was isolated at the indicated time point for analysis. After 9 days, the cells were stained by oil red O. Pictures were captured with Sony CCD-IRIS at ×40 magnification.
RIA for Leptin. Plasma leptin was measured by using the Linco mouse leptin RIA kit (Linco Research Immunoassay, St. Charles, MO).
Statistical Analysis. All results were expressed as mean ± SEM. The statistical significance of differences in mean values was assessed by one-way ANOVA and Newman–Keuls test.
Results
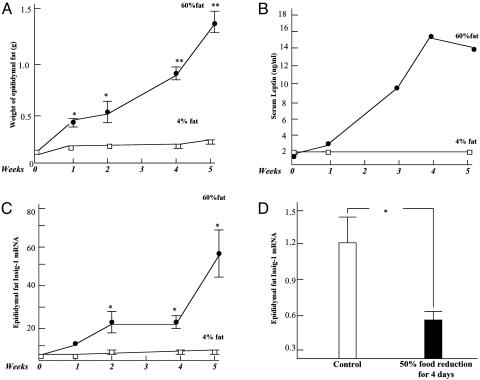
Insig Expression During Development of Obesity. We had previously reported an ≈4-fold increase of insig-1 mRNA in adipose tissue from rats fed a high-fat diet for 1 week (1). To obtain a more complete perspective of insig-1 gene expression during the development of obesity, we analyzed insig-1 mRNA longitudinally in the epididymal fat pads of mice fed a 60% fat diet for 5 weeks beginning at 4 weeks of age. Body weight rose ≈20% compared with controls on a 4% fat diet. As epididymal fat pad weight (Fig. 1A) and plasma leptin levels (Fig. 1B) rose progressively during the 5 weeks of the high-fat diet, insig-1 mRNA rose in parallel (Fig. 1C). Conversely, when food intake in normal rats was restricted by 50%, insig-1 mRNA declined significantly (P < 0.05) (Fig. 1D).
Fig. 1.
Changes in insig-1 expression during expansion and contraction of adipose tissue. (A) Weight of epididymal fat pad in mice on a 60% (•—•) or 4% (□—□) fat diet. n = 3 at 1 and 2 weeks; n = 4 at 4 and 5 weeks. (B) Plasma leptin levels in these mice. (C) Insig-1 mRNA/18S mRNA ratio of epididymal fat pad of mice on a 60% (•—•) or 4% (□—□) fat diet. (n = 3). (D) Insig-1 mRNA/18S mRNA ratio in the epididymal fat pad of rats on an unrestricted 4% fat diet (□) or after 4 days of 50% restriction (▪) (n = 4). *, P < 0.05; **, P < 0.01.
Yabe et al. (7) discovered insig-2, a second endoplasmic reticulum protein that binds SCAP and blocks the processing of the SREBPs. In normal fat from lean rats, insig-2 mRNA was expressed at only 5% of the level of insig-1; unlike insig-1, it did not increase during the development of diet-induced obesity in vivo (data not shown).
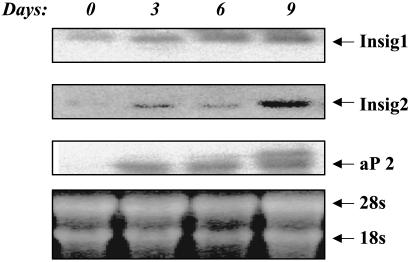
Insig Expression During Maturation of Preadipocytes. To determine the pattern of insig-1 and -2 expression during maturation of 3T3-L1 preadipocytes, we quantified their mRNAs at 3-day intervals during differentiation induced by insulin/dexamethasone/isobutyl-1-methylxanthine (Ins/Dex/IBMX) and 25 mM glucose. Northern blotting revealed a progressive augmentation of insig-1 mRNA during differentiation, in association with an increase in fatty acid binding protein, adipocyte fatty acid-binding protein 2 (aP2) (Fig. 2). Insig-2 mRNA was considerably lower than insig-1, but it also rose during differentiation.
Fig. 2.
Northern blots of 3T3-L1 cells for insig-1 and -2 mRNA and aP2 during 9 days of differentiation into mature adipocytes. Bottom shows equal amount of total RNA was loaded.
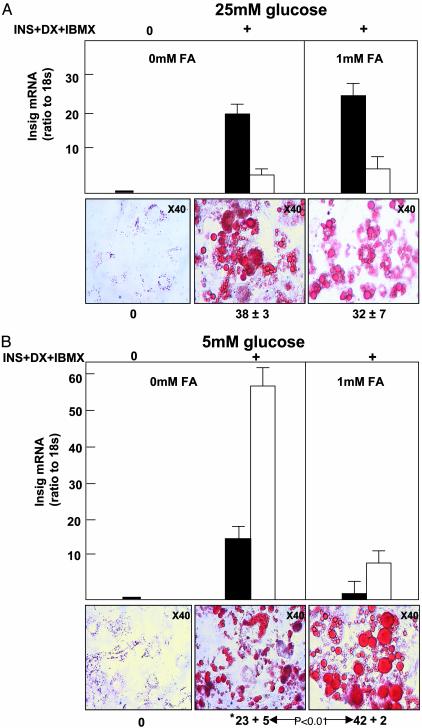
Effects of Glucose and Fatty Acids on Insig-1 and -2 Expression in Maturing Preadipocytes. To determine the influence of glucose and fatty acids on insig-1 and -2 expression, 3T3-L1 cells were cultured in 25 mM glucose with or without 1 mM 2:1 oleate/palmitate. On day 9, insig-1 and -2 mRNA had increased, respectively, 30-fold (P < 0.01) and 25-fold (P < 0.01) (Fig. 3A). The area of oil red O staining was 38 ± 3% at that time. The presence of 1 mM fatty acid mixture had no effect on either insig-1 or -2 mRNA or on the area of oil red O staining (Fig. 3A).
Fig. 3.
Insig-1 (▪) and -2 (□) mRNA/18S ratio and oil red O staining of 3T3-L1 cells. (A Lower Left) Undifferentiated 3T3-L1 cells. (Lower Center) 3T3-L1 cells cultured in standard medium (25 mM glucose, Ins/Dex/IBMX). (Lower Right) Cells cultured in the foregoing medium plus 1 mM of a 2:1 oleate/palmitate mixture. (B Lower Left) Undifferentiated 3T3-L1 cells. (Lower Center) Cells cultured with Ins/Dex/IBMX but only 5 mM glucose. (Lower Right) Cells were cultured in the foregoing medium plus 1 mM fatty acid mixture. Numbers below panels indicate the percent area of oil red O stain. *, Significant (P < 0.01) lowering of oil red O staining compared with A. FA, fatty acids.
When differentiation was carried out in a more physiologic 5 mM concentration of glucose, insig-1 and insig-2 mRNA rose, respectively, 36-fold (P < 0.01), and ≈58-fold (P < 0.01); oil red O staining was only 23 ± 5% (Fig. 3B), significantly (P < 0.01) below the cells cultured in 25 mM glucose (Fig. 3A). The presence of 1 mM fatty acids in the culture medium reduced insig-1 and insig-2 mRNA, respectively, by 93% (P < 0.01) and 81% (P < 0.05) below the levels observed without fatty acids; the area of oil red O staining rose significantly to 42 ± 2% (P < 0.01) (Fig. 3B). Thus, when fatty acids suppressed insig-1 and -2 expression, an increase in lipid staining was observed.
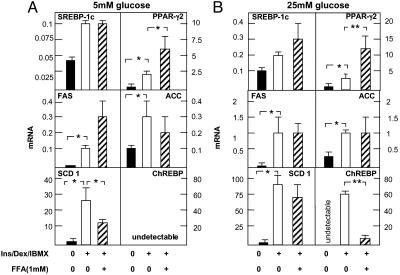
Effects of Glucose and Fatty Acids on Gene-Expression Profile in Maturing Preadipocytes. The foregoing differences in lipid accumulation could well have been the consequence of changes in expression of factors and enzymes that influence lipid homeostasis. Therefore, we quantified by real-time RT-PCR the mRNA of transcription factors and enzymes involved in fatty acid metabolism (Table 1). SCD-1 mRNA rose 21-fold (P < 0.05) in cells cultured in 25 mM glucose and 13-fold (P < 0.05) in 5 mM glucose (Fig. 4). Fatty acids lowered SCD-1 mRNA in 5 mM glucose (P < 0.05) but not in 25 mM glucose, whereas peroxisome proliferator-activated receptor γ2 (PPARγ2) mRNA was increased significantly by fatty acids at both glucose concentrations (P < 0.05) (Fig. 4). PPARγ-coactivator-1α, PPARα, and glycerol phosphate acyl transferase were not significantly changed (data not shown).
Fig. 4.
Expression in 3T3-L1 cells of genes involved in lipid metabolism before and
after differentiation in Ins/Dex/IBMX-containing medium with 5 mM glucose
(A) or 25 mM glucose (B). ▪, undifferentiated 3T3-L1
cells; □, 3T3-L1 cells cultured for 9 days in Ins/Dex/IBMX without added
fatty acids; , cells cultured in Ins/Dex/IBMX with added oleate/palmitate
(2:1). Data are mean ± SEM of the relative amount of mRNA of interest
calculated with 18S as standard. *, P < 0.05; **, P <
0.01 (n = 3). FAS, fatty acid synthase. ACC, acetyl CoA
carboxylase.
The most striking influence of glucose was on the expression of ChREBP (8), an important transcription factor for glucose-derived lipogenesis. ChREBP was undetectable in undifferentiated 3T3-L1 cells or during differentiation in 5 mM glucose but rose to extremely high levels during differentiation in 25 mM glucose. The presence of fatty acids reduced this increase by 89% (P < 0.01) (Fig. 4).
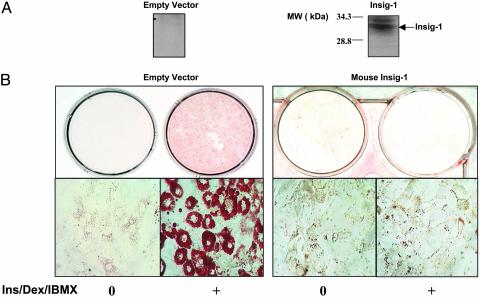
Effects of Insig-1 Expression on Preadipocyte Maturation and Gene Expression. To determine the effect of insig-1 on preadipocyte differentiation, we transfected 3T3-L1 preadipocytes with mouse (m) and human (h) insig-1 cDNA. Cells transfected with V5-tagged m-insig-1 exhibited on immunoblotting a single protein band corresponding in size to insig-1 (Fig. 5A). Cells transfected with m- or h-insig-1 and cultured in 25 mM glucose remained unstained by oil red O, whereas 49% of cells transfected with empty vector were stained (Fig. 5B). Thus, insig-1 overexpression prevented the accumulation of lipids in differentiating preadipocytes.
Fig. 5.
Effects of insig-1 transfection into 3T3-L1 cells on their differentiation. (A) Immunoblotting for V5-tagged insig-1 of 3T3-L1 cells transfected with vector (Left) or with insig-1 (Right). (B) Oil red O staining of cells transfected with empty vector (Left) or with insig-1 (Right) before and 9 days after culture Ins/Dex/IBMX and 25 mM glucose (Left).
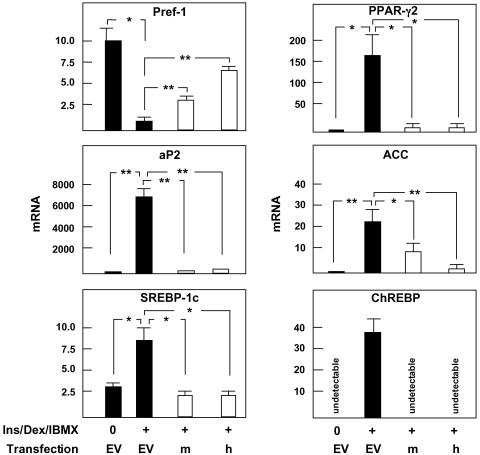
To determine the effect of insig-1 on expression of lipogenic genes, we compared the expression profile of 3T3-L1 cells transfected with m- or h-insig-1 with that of control cells transfected with empty vector. In the insig-1-overexpressing cells aP2, PPARγ2, and ChREBP mRNA were ≈95% below the controls (Fig. 6), whereas SREBP-1c mRNA was 60% below. Preadipocyte factor 1, a preadipocyte marker that normally disappears during adipocyte maturation (10), declined, but not as much as in the empty vector controls (Fig. 6).
Fig. 6.
Expression of relevant genes in 3T3-L1 cells transfected with insig-1. □, mouse insig-1 (m) or human insig-1 (h) transfection; ▪, transfection with empty vector (EV). All cells were cultured in 25 mM glucose with Ins/Dex/IBMX. Data are mean ± SEM of the relative amount of mRNA of interest calculated with 36B4 as standard. *, P < 0.05; **, P < 0.01 (n = 3). Pref-1, preadipocyte factor 1; ACC, acetyl CoA carboxylase.
Discussion
This study indicates that insig-1 mRNA increases progressively in the fat tissue of normal mice as they develop diet-induced obesity, and that insig-1 and -2 mRNA rise in differentiating 3T3-L1 preadipocytes. Given the ability of these endoplasmic reticulum proteins to block activation of SREBP-1c (3), a key determinant of adipocyte differentiation (5) and lipogenesis (11), it was predictable that they would inhibit both processes. The fact that the increase of insig-1 in vivo and in vitro occurs after adipocytes have become lipid-laden suggests a limiting, rather than a preventive, role for insig-1 in lipogenesis. Such a role would prevent overdistention of the adipocytes with fat and might also initiate the recruitment of neighboring preadipocytes to augment the fat-storage capacity to accommodate continuing overnutrition.
The fact that insig-2 mRNA was 12-fold higher at 5 mM glucose than at 25 mM glucose may have physiologic implications. Less glucose would be used for lipogenesis, thereby preserving it for use as a cerebral fuel. Indeed, the undetectable level of ChREBP mRNA in those cells at 5 mM glucose is consistent with this possibility. At 25 mM glucose, ChREBP mRNA was increased dramatically, which would promote lipogenesis from the surplus glucose (12). Fatty acids reduced it by 92% (P < 0.01) (Fig. 4), consistent with the idea that when fatty acids are abundant no need exists for ChREBP-induced fatty acid synthesis from glucose.
Although SREBP-1c was expressed at low levels in preadipocytes and increased slightly during differentiation, it seems likely that differences in processing of SREBP-1c, rather than in its expression, determined its influence on lipogenesis in 3T3-L1 cells. Consistent with this, several known target genes of SREBP-1c were found to be greatly up-regulated. SCD-1 was increased 21-fold (P < 0.05) during differentiation (P < 0.05) in 25 mM glucose and 13-fold in 5 mM glucose (P < 0.05). This enzyme is required for diet-induced obesity (13). Fatty acid synthase and acetyl CoA carboxylase were also increased.
Overexpression of insig-1 in 3T3-L1 cells before differentiation blocked lipogenesis and inhibited the differentiation program to a large degree. Key lipogenic enzymes were reduced by at least 95%, and oil red O staining was completely prevented; PPARγ2 increased very slightly (4-fold vs. 85-fold in controls), whereas preadipocyte factor 1 declined only 70% vs. 90% in the empty vector controls. This could mean that most of the insig-1-transfected cells were arrested at the preadipocyte stage, whereas some had undergone a degree of maturation but could not form triglycerides.
Taken together, these results are consistent with the hypothesis that a high level of insig-1 or -2 expression may limit triglyceride synthesis in an adipocyte, i.e., determine how large an adipocyte will become and prevent it from exceeding its storage capacity. “Capping” lipogenesis would not only protect adipocytes from overdifferentiation but might also set the stage for the release of factors that initiate differentiation of nearby preadipocytes to accommodate a continuing caloric surplus. Finally, regional differences in insig expression in adipocytes might mold the shape of the adipocyte compartment, determining which regions of the body become fat and which do not.
Acknowledgments
We thank Drs. Joyce Repa and Cai Li, for critical examination of the manuscript. We thank Christie Fisher for excellent secretarial work. This work was supported by National Institutes of Health Grants DK02700 and DK58398, Department of Veterans Affairs Merit Review, and the Jensen Diabetes Research Foundation.
Abbreviations: SREBP, sterol regulatory element-binding protein; SCAP, SREBP cleavage-activating protein; ChREBP, carbohydrate response element-binding protein; insig, insulin-induced gene; IBMX, 3-isobutyl-1-methylxanthine; Ins/Dex/IBMX, insulin/dexamethasone/isobutyl-1-methylxanthine; PPAR, peroxisome proliferator-activated receptor; SCD-1, stearoyl-coenzyme A desaturase 1; aP2, adipocyte fatty acid-binding protein 2.
References
- 1.Li, J., Yu, X., Pan, W. & Unger, R. H. (2002) Am. J. Physiol. 282, E1334-E1341. [DOI] [PubMed] [Google Scholar]
- 2.Peng, Y., Schwarz, E. J., Lazar, M. A., Genin, A., Spinner, N. B. & Taub, R. (1997) Genomics 43, 278-284. [DOI] [PubMed] [Google Scholar]
- 3.Yang, T., Espenshade, P. J., Wright, M. E., Yabe, D., Gong, Y., Aebersold, R., Goldstein, J. L. & Brown, M. S. (2002) Cell 110, 489-500. [DOI] [PubMed] [Google Scholar]
- 4.Horton, J. D., Goldstein, J. L. & Brown, M. S. (2002) J. Clin. Invest. 109, 1125-1131. [DOI] [PMC free article] [PubMed] [Google Scholar]
- 5.Tontonoz, P., Kim, J. B., Graves, R. A. & Spiegelman, B. M. (1993) Mol. Cell. Biol. 13, 4753-4759. [DOI] [PMC free article] [PubMed] [Google Scholar]
- 6.Hua, X., Nohturfft, A., Goldstein, J. L. & Brown, M. S. (1996) Cell 87, 415-426. [DOI] [PubMed] [Google Scholar]
- 7.Yabe, D., Brown, M. S. & Goldstein, J. L. (2002) Proc. Natl. Acad. Sci. USA 99, 12753-12758. [DOI] [PMC free article] [PubMed] [Google Scholar]
- 8.Yamashita, H., Takenoshita, M., Sakurai, M., Bruick, R. K., Henzel, W. J., Shillinglaw, W., Arnot, D. & Uyeda, K. (2001) Proc. Natl. Acad. Sci. USA 98, 9116-9121. [DOI] [PMC free article] [PubMed] [Google Scholar]
- 9.Shimomura, I., Bashmakov, Y., Ikemoto, S., Horton, J. D., Brown, M. S. & Goldstein, J. L. (1999) Proc. Natl. Acad. Sci. USA 96, 13656-13661. [DOI] [PMC free article] [PubMed] [Google Scholar]
- 10.Smas, C. M. & Sul, H. S. (1993) Cell 73, 725-734. [DOI] [PubMed] [Google Scholar]
- 11.Brown, M. S. & Goldstein, J. L. (1998) Nutr. Rev. 56, S1-S3. [DOI] [PubMed] [Google Scholar]
- 12.Uyeda, K., Yamashita, H. & Kawaguchi, T. (2002) Biochem. Pharmacol. 63, 2075-2080. [DOI] [PubMed] [Google Scholar]
- 13.Ntambi, J. M., Miyazaki, M., Stoehr, J. P., Lan, H., Kendziorski, C. M., Yandell, B. S., Song, Y., Cohen, P., Friedman, J. M. & Attie, A. D. (2002) Proc. Natl. Acad. Sci. USA 99, 11482-11486. [DOI] [PMC free article] [PubMed] [Google Scholar]


