Abstract
The cellular stress response can mediate cellular protection through expression of heat shock protein (Hsp70), which can interfere with the process of apoptotic cell death. Factors regulating renal epithelial cell apoptosis include angiotensin II. In the present study, we have examined the relationship between the Hsp70 expression and the apoptotic pathway in the kidneys from low-protein–fed rats (8% protein). The possible cytoprotective role of Hsp70 has been evaluated during low-protein feeding and after reincorporation of 24% protein in the diet. The effect of angiotensin II AT1 receptor inhibition has also been studied. Rats were fed with a low-protein (LP) diet (8% protein) for 14 days, and then the animals were recovered by means of a normal protein diet (24% protein) (RP) for 14, 21, and 30 days, and control rats received 24% protein (NP) in the diet. LP and NP rats treated with Losartan (10 mg/kg) were also evaluated. The following methods were performed on the kidneys: terminal deoxynucleotidyltransferase-mediated dUTP nick end labeling assay for apoptosis, reverse transcriptase-polymerase chain reaction assay for AT1, Bax, and Bcl-2 messenger ribonucleic acid (mRNA) expression, and immunohistochemical and Western blot for Hsp70 and caspase 3 protein expression and activity. In the LP group, the cells of the medullary ducts (MDs) showed increased apoptosis associated with weak immunoreaction for Hsp70 and decreased Hsp70 protein levels. In these animals, enhanced proapoptotic ratio Bax/Bcl-2 linked to decreased procaspase 3 protein levels with increased caspase 3 activation were demonstrated. A cytoprotection attributed to Hsp70 could be noted in the RP rats after 21 days of reincorporation of the normal diet, and in the LP-fed group treated with Losartan. In these cases, the MD cells displayed decreased apoptosis and increased Hsp70 expression in colocalization staining, and high Hsp70 levels in cytosolic fraction. A decreased proapoptotic ratio Bax/Bcl-2, associated with increased Bcl-2 mRNA, was also observed. Our results provide evidence for an antiapoptotic, cytoprotective effect of Hsp70 in kidney MD cells of rats with LP intake, when the animals were recovered with 24% protein in diet and after angiotensin II AT1 receptor inhibition. Angiotensin II seems to play a role in the pathogenesis of tubule epithelial cell apoptosis during LP feeding.
INTRODUCTION
Apoptosis of renal epithelial cells is characterized by mitochondrial injury, release of cytochrome c, and the subsequent activation of caspases (Liu et al 1996; Saikumar et al 1998); this form of cell death is increasingly recognized as an important mechanism that contributes to renal dysfunction (Schumer et al 1992). Apoptosis is initiated by a variety of stimuli including growth factor withdrawal, physical factors, and death receptor signals. Apoptosis is frequently observed during renal ischemic injury, being triggered by a complex series of events, including decrease in oxygen supply (hypoxia) and low cellular energy (adenosine triphosphate [ATP] depletion) (Lieberthal et al 1996). Among the factors regulating renal cell apoptosis induction is angiotensin II, which mediates its effects by the AT2 receptor. However, an apoptosis mechanism mediated by the AT1 receptor has been recently reported (Yamada et al 1996; Ding et al 2002). Excessive apoptosis can contribute to progressive chronic nephropathies by depletion of tubular cells (Zhang et al 1997; Cachat et al 2003).
Living cells respond to stress stimuli by triggering rapid changes in the protein profiles and one important change is characterized by induction of heat shock proteins (Morimoto et al 1994). The Hsp70 protein family, an abundant and highly conserved group of proteins in eukaryotic cells, contains members that are constitutively expressed and also inducible regulated (Kiang et al 1998). The HSPs have a cytoprotective role through their ability to restore the native conformation of chaperoned damaged protein (Agashe et al 2000). In addition, certain HSPs (including Hsp70) confer cellular protection by modulating the engagement and/or progression of apoptosis (Beere et al 2001). The prior heat stress has been shown to ameliorate apoptosis induction of renal cells exposed to metabolic inhibitors. Association of Hsp70 and Bcl-2 may be responsible, at least in part, for the protection afforded by prior heat stress against ATP depletion injury (Wang et al 1999).
In low-protein (LP) feeding, the study of the intrarenal renin–angiotensin system (RAS) gene expression stems from the previous observation that renal hemodynamic changes, including reduced renal blood flow and glomerular filtration rate as a result of increased renal vascular resistance, are analogous to states of enhanced production of local angiotensin II (Martinez-Maldonado et al 1993). Furthermore, reversal of renal vasoconstriction by angiotensin-converting enzyme (ACE) inhibition and by the specific type I AII receptor (AT1) inhibitors support the role of angiotensin II mediation of the adverse renal hemodynamic changes and renal ischemia in low-protein feeding (Benabe et al 1993, 1998). Evidence involving angiotensin II in altered renal non-hemodynamics, leading to the tubulointerstitial injury, has been reported. For these events, angiotensin II promotes the synthesis of several cytokines and growth factors that contribute to the progression of the renal injury (Kaneto et al 1994; Manucha et al 2004). Moreover, studies have recently shown that angiotensin II can stimulate oxidative stress (Pueyo et al 1998). In patients with low plasma albumin concentration, a significantly diminished plasma antioxidant capacity due to the decreased availability of thiol group scavengers of oxidants, has been reported (Dogra et al 2001). We have recently shown energy depletion, through the continued H+-ATPase activity inhibition in outer and inner medullary collecting duct segments (OMCDs and IMCDs) from low-protein–fed rat kidneys (Vallés et al 2005).
In the present study, we have evaluated the effects of LP feeding in the kidney of rats, to study the stress response mediated by the Hsp70 expression and the association of this response with apoptosis. Because the angiotensin II AT1 receptor has also been implicated in apoptosis, these receptors were also examined in this experimental model of LP feeding.
MATERIALS AND METHODS
Female Wistar rats weighing 60–70 g were used for all of the experiments. During a preliminary study, we estimated the minimum amount of food ingested by the rats in the metabolic cages, to be 10 g/d. During the experiments all rats had free access to deionized distilled water, and food consumption and body weight of the animals were measured daily. Two separate experiments were conducted.
The first protocol was designed to determine apoptosis induction in epithelial renal cells from LP and the possible temporal cytoprotective role of Hsp70 during protein recovery in the diet. The second experiment was conducted to examine the AT1 angiotensin II receptor inhibition effect on apoptosis induction and the Hsp70 expression in this cellular event during LP feeding.
The following five groups of animals were used for conducting both experimental protocols.
Group I (normal, NP): This group (n = 6) received an isocaloric 24% protein diet; this was the age-matched control group of the low-protein group. Control rats (n = 5 in each period) were also included with NP intake and aged-matched for the protein recovered groups for 14 (NP14), 21 (NP21), and 30 days (NP30). The diet was composed of casein (24%), cornstarch (36%), cellulose fiber (10%), sucrose (21.3%), choline (0.2%), mineral mix (2%), vitamin mix (0.5%), and corn oil (6%).
Group 2: Low-protein (LP) group of rats that received an isocaloric 8% protein diet for 14 days. The diet was composed of casein (8%), cornstarch (48.45%), cellulose fiber (10%), sucrose (24.3%), choline (0.2%), mineral mix (2%), vitamin mix (0.5%), and corn oil (6%). Each diet contained 0.069 mEq of Na+ and 0.16 mEq of K+ per gram. Rats (n = 6), were weighed daily for 14 days and were offered water ad libitum.
Group 3: Protein recovery group (RP), with readministration of 24% protein for 14, 21, and 30 days after being fed with 8% LP diet for 14 days (n = 5) for each time point of the recovery diet.
Group 4: LP rats that received isocaloric with 8% protein diet plus Losartan (10 mg/kg body weight) (LP+L) for 14 days (n = 5). The Losartan dose was adjusted over the course of the 14 days.
Group 5: Normal protein group that received isocaloric with 24% protein diet plus Losartan (10 mg/kg body weight) (NP+L) for 14 days (n = 5). The Losartan dose was again adjusted over the course of the 14 days.
Animals and tissue preparation
The kidneys were perfused through the abdominal aorta with ice-cold phosphate-buffered saline (PBS) solution to rinse all of the blood. Left kidney cortex and medulla from all groups were removed and placed in fresh PBS on ice. For tissue preparation of the cytosolic fraction, the cortical and medulla pieces were homogenized using a Dounce-style tissue homogenizer in a buffer solution containing 300 mmol/L sucrose, 18 mmol/L Tris-HCl, 5 mmol/L sodium ethylene-glycol-tetraacetic acid (Na EGTA), 4 μg/mL aprotinin, 4 μg/mL leupeptin, 2 μg/ mL chymostatin, 2 μg/mL pepstatin, and 100 μg/mL 4-2-aminoethyl-benzenesulfonyl fluoride (AEBSF), pH 7.4. The homogenate was centrifuged at 1000 × g for 10 minutes at 4°C to remove large debris, nuclei and unbroken cells. Supernatants were further centrifuged at 40 000 × g for 20 minutes at 4°C. The resulting supernatant was saved as the cytosolic extract.
Half of the right kidneys of each group were removed and placed on ice for isolation of ribonucleic acid (RNA) from cortex and medulla. Half of the right kidneys were fixed in 10% (v/v) phosphate-buffered formalin (pH 7.1) for 48 hours before transfer to 70% (v/v) ethanol.
Kidneys were then dehydrated, embedded in paraffin, and serially sectioned (3–4 μm) on a microtome (Leica, Nussloch, Germany). Thereafter, kidney sections were deparaffined in xylene and rehydrated through graded ethanols to water. Endogenous peroxidase activity was quenched by incubation with 2% (v/v) H2O2 in PBS for 5 minutes at room temperature (RT). Afterward, staining and immunohistochemical techniques were performed.
Identification of renal tubular cell apoptosis: terminal deoxynucleotidyltransferase-mediated dUTP nick end labeling technique
After the digesting and quenching steps, equilibration buffer was applied directly to the sections for 5 minutes and working strength terminal deoxynucleotidyltransferase (TdT) enzyme (at a concentration of 1:5 in reaction buffer) was then applied directly for 1 hour at 37°C. A biotin-conjugated anti-digoxigenin antibody (Sigma, St Louis, MO, USA) was used at 1:1500 dilution in PBS, pH 7.4, to incubate the tissue sections overnight at 4°C. Then, the sections were incubated with biotinylated anti-mouse IgG (DakoCytomation, Carpinteria, CA, USA) at 1:100 dilution for 45 minutes at RT and later with peroxidase-labeled streptavidin (strept AB Complex/HRP; DakoCytomation) at 1:100 dilution for 45 minutes at RT. After a brief wash, 3,3′-diaminobenzidine tetrahydrochloride (0.5 mg/mL)/H2O2 (0.01%), a chromogen substrate was incorporated. Tissue sections were lightly counterstained with 0.5% with hematoxylin to reveal nuclei, and the slides were observed with a Zeiss Axioskop 2 microscope. For positive control, we used paraffin sections from involuting prostates of castrated rats (n = 2).
For the quantification of apoptotic epithelial cells, 10 consecutive fields were randomly selected in each renal cortex and medulla and they were evaluated at 400×, on a 10 × 10 grid, by using an image analyzer (Image Pro-Plus 4.0, 1998, Media Cybernetics, Silver Spring, MD, USA). Results were expressed as the number of apoptotic cells per mm2.
Immunohistochemical studies
Kidney paraffin sections (5- to 6-μm thickness) were dewaxed in xylol, rehydrated, and incubated with 3% H2O2 for 30 minutes to quench endogenous peroxidase activity. After washing in Tris-buffered saline (0.05 M Tris, 0.15 M NaCl), pH 7.6, and nonspecific blocking with 10% bovine serum albumin for 30 minutes at room temperature, the sections were immunostained to reveal Hsp70. A commercial immunoperoxidase kit was used (Dako EnVision System; DakoCytomation). The antibody applied was a mouse monoclonal antibody (BRM-22), against the inducible and constitutive forms of Hsp70 (Sigma). The positive reaction was evaluated considering the specific location of immunostaining (renal structure, and cell compartment: nucleus, cytoplasm, membrane) and the intensity of the immunoreaction. Two observers recorded the scores in a blind form (without knowledge of the histological status of the kidneys). Negative controls included tissues unexposed to primary antibodies as well as tissues exposed to control immunoglobulin G. Positive controls were human breast cancer biopsy samples.
Reverse transcriptase-polymerase chain reaction and semiquantification of mRNA AT1 angiotensin II receptor, Bax, and Bcl-2
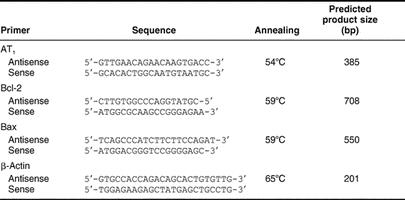
Total RNA was obtained from cortex and medulla kidneys by using Trizol reagent (Invitrogen Life Technologies, Gaithersburg, MD, USA). Two micrograms of RNA were denatured in the presence of 0.5 μg/50 μL oligo(dT)15 primer and 40 U of recombinant ribonuclease inhibitor Rnasin (Promega, Madison, WI, USA). Reverse transcription was performed in the presence of mixture by using 200 U of reverse transcriptase Moloney murine leukemia virus reverse transcriptase (M-MLV RT) in reaction buffer, 0.5 mM 2′-deoxynucleoside 5′-triphosphates (dNTPs) each, and incubated for 60 minutes at 42°C. The cDNA (10 L) was amplified by polymerase chain reaction (PCR) under standard conditions. Each sample was measured for AT1 angiotensin II receptor, Bcl-2, Bax, and β-actin, (primers designed; Table 1). The amplified products were electrophoresed using 2% agarose gel in TBE buffer. Gels were stained with 1 mg/mL ethidium bromide, visualized with an ultraviolet transluminator UV (Cole Parmer Instruments, Chicago, IL, USA) and photographed. The photograph was digitalized using a scanner (LACIE Silver Scanner for Macintosh) and the Desk Scan software (Adobe Photoshop). Densitometric analysis was performed using the NIH Image 1.6 software (Division of Computer Research and Technology, National Institutes of Health, Bethesda, MD, USA). The AT1 angiotensin II receptor, Bcl-2, and Bax signals were standardized against β-actin signal for each sample, and the results were expressed as a ratio.
Table 1.
Primers designed from rat sequences for RT-PCR
Western blot analysis for Hsp70 and procaspase 3
Tissues were homogenized and 100 μg of cytosol protein from cortex and medulla, quantified by Bradford assay (Bio-Rad Laboratories, Hertfordshire, UK), were used in each lane for electrophoresis in 0.1% sodium dodecyl sulfate (SDS) and 12% polyacrylamide gels with 4% stacking gel and then transferred to nitrocellulose. Immunoblotting was performed by incubating each membrane in blocking buffer (5% bovine serum albumin in PBS plus 0.1% [v/v] Tween), for 1 hour at RT and then incubated in the primary antibodies overnight with the antibody against Hsp70 (dilution, 1:2000) and caspase-3 p20 goat polyclonal IgG (1:7500) (Santa Cruz Biotechnology, Santa Cruz, CA, USA), respectively. The membranes were incubated overnight at 4°C with primary antibodies, washed for 5 minutes five times in PBS and then incubated at RT in horseradish peroxidase–conjugated anti-rabbit and anti-goat IgG biotin antibody (Sigma) at 1:2500 dilution, respectively. The bound antibody was then visualized by using enhanced chemiluminescence (ECL) detection (Amersham Biosciences, Piscataway, NJ, USA) and exposure to x-ray film.
For quantification of Hsp70 and procaspase 3 protein levels, the photographs were digitalized using a scanner (LACIE Silver Scanner for Macintosh) and the Desk Scan software (Adobe Photoshop) on a desktop computer. Densitometric analysis was performed by using the NIH Image 1.66 software. The magnitude of the immunosignal was given as a percentage of control renal tissue.
Caspase activity assay
The activity of caspases was determined by use of the CaspACE Assay System (Promega). In this assay, the CPP32-like proteases showed specificity for cleavage at the C-terminal side of the aspartate residue of the sequence DEVD (asp-Glu.Val-asp) and was inhibited by the tetrapeptide inhibitor Ac-DEVD-CHO. Proteins from cytosolic extracts were measured by a Bio-Rad Protein Assay kit (Bio-Rad, Hercules, CA, USA), with bovine serum albumin as standards. The caspase 3 assay was then performed as follows: aliquots of cytosolic homogenates (100 μL) were diluted in caspase assay buffer (312.5 mM N-2-hydroxyethylpiperazine-N′-2-ethane-sulfonic acid [HEPES], pH 7.5, 31.25% sucrose, 0.3125% 3-(3-cholamidopropyl)-dimethyl-ammonio)-1-propane-sulfonate [CHAPS] plus dimethyl sulfoxide [DMSO] (2 μL) plus dithiothreitol [DTT; 100 mM; 10 μL]) and incubated for 30 minutes at 37°C. After the addition of 2.5 mM of the substrate (CPP32 Substrate Ac-Asp-Glu-Val-Asp-7-amido-4-methyl coumarin) (Ac-DEVD-AMC), incubation was performed for 60 minutes at 37°C. Peptide cleavage was measured for over 1 hour at 30°C by using an spectrofluorometric fluorescent plate reader (Fluoro Count; AF10001; Cambers Company) at a wavelength of 360-nm excitation and 460-nm emission. Specific caspase 3 activity was expressed as picomoles of AMC liberated per minute per microgram of protein.
Statistical analysis
The results were assessed by 1-way analysis of variance for comparisons among groups. Significance of differences was estimated by the Bonferroni test. A value of P < 0.05 (*) was considered to be significant. Student's test was performed to compare the means when the experimental design consisted of 2 samples. Statistical significance was assessed by Student impaired t-test. A value of P < 0.05 was considered to be significant. Results are given as means ± SEM. Statistical tests were performed by using GraphPad In Stat, version 3.00, for Windows 95 (GraphPad Software, San Diego, CA, USA).
RESULTS
Food intake, animal body weight and blood pressure measurements
For the 14-day period of pair feeding, average daily food intakes were 14.26 ± 0.55 and 14.63 ± 0.47 g/(100 g of body weight per day, for rats fed with the 24% and 8% protein diets), respectively. For the 30-day period of the group with readministration of 24% protein in the diet, and age-matched control rats, average daily food intakes were 18.75 ± 0.52 and 18.96 ± 0.62 g/(100 g of body weight per day), respectively.
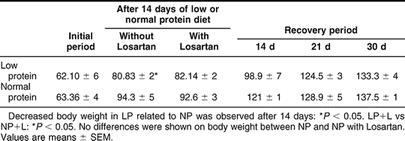
The body weight data in the LP group (8% protein diet) after 14 days, showed a significant decrease compared to NP (P < 0.05). No differences were shown on body weight after readministration of 24% protein in the diet for 14, 21, and 30 days compared to their controls (Table 2).
Table 2.
Effect of dietary protein on body weight from normal protein group (NP), low protein group of rats without Losartan (LP) and with Losartan administration (LP+L), and protein recovery group (RP) after readministration of protein (24%) for 14, 21, and 30 days
Rats fed on 24% protein and 8% protein, started with a mean systolic blood pressure (in mmHg), obtained by tail cuff, of 106 ± 2.10 and 107 ± 1.69, respectively. After 14 days of LP diet, the mean blood pressure was similar in the LP group compared to NP group: 107 ± 0.89 vs 108 ± 0.75 mmHg.
No differences were shown in blood pressure values (in mmHg) between LP with and without administration of Losartan (10 mg/kg) for 14 days: 108 ± 0.71 vs 102 ± 1.82.
Reverse transcriptase-polymerase chain reaction for angiotensin II AT1 receptor in low-protein–fed rats
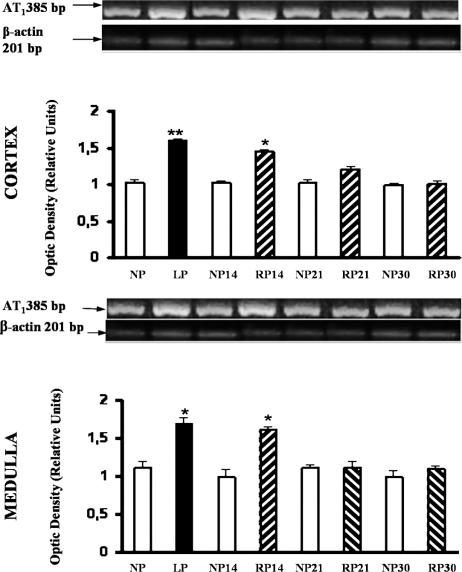
Under identical conditions, an equal amount of 2 μg of total RNA from each renal cortex and medulla of LP and NP was reverse transcribed. Figure 1 shows the integrated optical intensity of the reverse transcriptase-polymerase chain reaction (RT-PCR) product of AT1 receptor fluorescence in the ethidium bromide–stained gel for cortex and medulla of LP. The intensity of the amplified housekeeping gene β-actin was almost uniform in all tissues. Densitometric analysis of the AT1 angiotensin II receptor mRNA corrected for β-actin expression (relative densitometric units) showed a significant increase in the expression of AT1 mRNA in LP compared to NP cortex: 1.59 ± 0.03 vs 1.01 ± 0.05 (P < 0.01). In the medulla, an enhanced AT1 mRNA expression was shown in LP related to NP: 1.65 ± 0.09 vs 1.10 ± 0.11 (P < 0.05). A persistent increase in the medulla AT1 mRNA expression was demonstrated after protein recovery (24% protein), for 14 days compared with NP: 1.52 ± 0.05 vs 1.12 ± 0.10 (P < 0.05). The intensity of the message was similar to control, after readministration of 24% protein for 21 and 30 days (Fig 1).
Fig 1.
Expression of AT1 angiotensin II receptor in cortex and medulla from NP, LP, and RP fed rats. RT-PCR for AT1 receptor cDNA (385-bp product) was performed on RNA isolated from cortex and medulla of kidney homogenates. Representative gels of AT1 mRNA in cortex and medulla from controls (NP), LP, and RP after readministration of 24% protein for 14, 21, and 30 days are shown. Amplification of corresponding β-actin mRNA is shown. These results are typical of 5 independent observations. Semiquantitative PCR analysis of AT1 angiotensin II receptor. Top, Densitometric analysis of AT1 angiotensin II receptor and β-actin showed increased AT1 receptor/β-actin mRNA ratio in LP cortex related to NP cortex kidneys (**P < 0.01). Increased AT1 receptor/β-actin mRNA ratio incortex from RP after 14 days was shown, related to NP 14 days, (*P < 0.05). Bottom, Densitometric analysis. LP medulla related to NP medulla kidneys (*P < 0.05). Persistent increased AT1 receptor/β-actin mRNA ratio in medulla from RP after 14 days was shown, related to NP 14 days, (*P < 0.05). Values are means ± SEM
Effect of Losartan on AT1 angiotensin II receptor in low-protein–fed rats
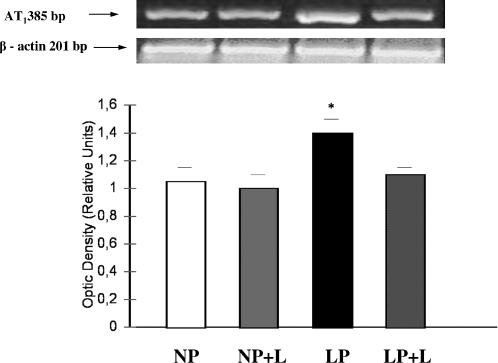
Using the AT1 mRNA to β-actin mRNA density ratio, AT1 mRNA angiotensin II receptor expression in LP with Losartan administration was similar to the one of NP for 14 days, 1.15 ± 0.10 vs 1.12 ± 0.05. However, a significant increase on the gene expression of the AT1 receptor was shown in medulla of LP compared to the one of LP with Losartan, 1.52 ± 0.10 vs 1.15 ± 0.05, P < 0.05. No differences were observed between NP without and with Losartan administration for 14 days, 1.12 ± 0.01 vs 1.11 ± 0.12 (Fig 2).
Fig 2.
Expression of AT1 angiotensin II receptor in kidney medullas from low protein without (LP) and with Losartan administration (LP+L) fed rats. Top, Representative gel of AT1 mRNA in medulla from NP, NP plus Losartan, LP without Losartan, and LP with Losartan. Housekeeping gene β-actin expression is shown in the line below. These results are typical of 5 independent observations. Bottom, Densitometric analysis of AT1 angiotensin II receptor and expression of β-actin showed increased AT1 receptor/β-actin mRNA ratio in LP kidney medullas related to NP and NP plus Losartan kidney medullas, *P < 0.05, both. Increased AT1 receptor/β-actin mRNA ratio in LP kidney medullas related to LP plus Losartan (*P < 0.05)
Colocalization of Hsp70 with apoptotic nuclei: inverse relationship in renal tubular epithelial cells from kidney medullas of LP
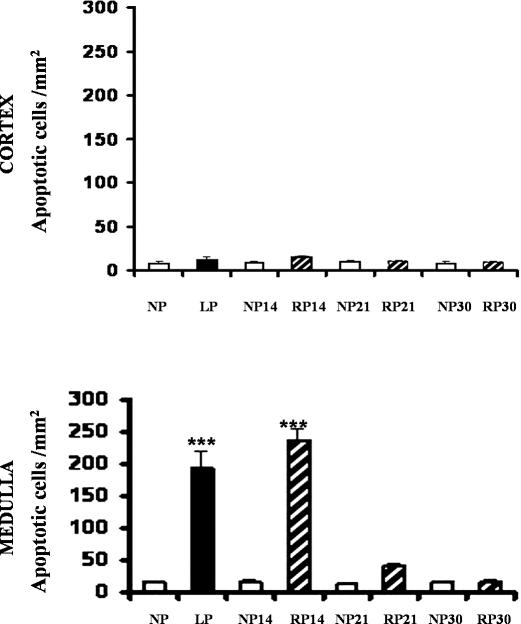
The same renal cortex and medulla sections from kidneys of LP fed rats and the corresponding control kidneys were stained for the presence of apoptotic nuclei and Hsp70 expression. Terminal deoxynucleotidyltransferase-mediated dUTP nick end labeling (TUNEL)-positive cells were rarely seen in control kidneys (24% protein-fed rats for 14 days). In the LP cortex, weak Hsp70 staining was present in the glomeruli and in epithelial cells from the cortical collecting ducts (CCDs) and proximal tubules (PTs). No significant increase in the number of apoptotic cells per square millimeter in cross-sections of the same epithelial cells from CCD and PT from kidney cortexes was shown in LP compared to control (Fig 3).
Fig 3.
Quantitation of apoptotic cells in medullary collecting tubules from kidneys of NP, LP, and RP fed rats. Ten consecutive fields were randomly selected in each renal cortex and medulla and were evaluated at 400× magnification. The number of apoptotic cells was expressed as apoptotic cells per square millimeter. Upper panel, Nonsignificant differences were observed in LP vs NP from kidney cortexes. Lower panel, Apoptosis peaked in cells from medullary collecting duct segments (OMCDs and IMCDs) in low-protein–fed rats for 14 days compared to that of NP, ***P < 0.001, n = 6. Persistent apoptotic nuclei in epithelial cells from medulla duct segments were shown after readministration of 24%protein in diet for 14 days. No significant increase of the apoptotic cell number was observed in medullary collecting ducts from kidneys after 21 and 30 days of protein recovery (RP)
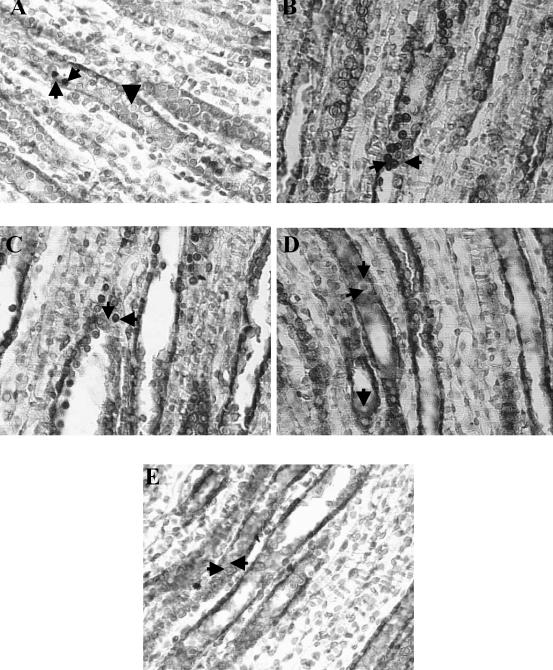
In contrast, a 10-fold increase in apoptotic nuclei characterized by apoptotic bodies or condensed nuclear chromatin was noted in epithelial cells from OMCDs and IMCDs of LP kidney medulla vs controls (Figs 3 and 4). Weak Hsp70 immunostaining was observed in the cytoplasm from epithelial cells of medullary collecting ducts (OMCDs and IMCDs) in LP kidney medulla. Presence of apoptotic cells and Hsp70 expression in the same epithelial duct segment (OMCDs and IMCDs) were demonstrated through colocalization staining (Fig 4).
Fig 4.
Histologic sections of kidney medulla from normal protein (NP), low protein (LP), and recovery protein (RP) fed rats. Through colocalization staining of apoptotic nuclei (TUNEL technique) with HSP70 expression, apoptotic nuclei appeared as intense brown-staining nuclei and cytoplasmic slight brown HSP70 expression in the same tubule epithelial cells from medullary collecting ducts. Light counterstaining with 0.5% with hematoxylin was performed to reveal nonapoptotic nuclei, nuclei appeared as blue staining. (A) NP: Apoptotic cells were rarely seen in OMCDs and IMCDs (left pointing arrow). Slight Hsp70 staining was shown (up arrow), nonapoptotic nuclei appeared as blue staining (down arrow). (B) LP: Increased number of apoptotic nuclei, as intense brown-staining nuclei (right pointing arrow), and weak HSP70 cytoplasm expression were shown in medullary collecting ducts (left pointing arrow). (C) RP after 14 days: Persistently increased number of apoptotic epithelial cells in OMCDs and IMCDs (left pointing arrows), in addition to weak Hsp70 immunoreaction in the cytoplasm of the same epithelial cells (down arrow), were shown. (D) RP after 21 days: Low number of positive TUNEL cells were shown in epithelial cells of medullary collecting ducts (right arrow) with strong Hsp70 immunoreaction in the same tubular cells (upper downward arrow), nonapoptotic nuclei appeared as blue staining (lower downward arrow). (E) RP after 30 days: Apoptosis was absent in epithelial cells from medullary duct segments, after 30 days with weak Hsp70 immunoreaction expression similar to the one of NP (left pointing arrow). Nonapoptotic nuclei appeared as blue staining (right pointing arrow). Magnification, 630×. The colors mentioned in the text refer to the original specimens
Late cytoprotective role of Hsp70 on medullary epithelial cells after protein recovery in diet
Through colocalization staining, a persistent increase in the number of apoptotic epithelial cells from OMCDs and IMCDs, in addition to a weak Hsp70 inmunoreaction in the cytoplasm and membrane of the same tubule cells, were observed after 14 days of 24% protein readministration (Fig 4).
When protein recovery (24% protein) was extended to 21 days, scarce positive TUNEL cells were observed in renal epithelial cells of medullary collecting ducts (OMCDs and IMCDs) with strong Hsp70 immunoreaction in the membrane and cytoplasm of the same tubular cells (Fig 4). Apoptosis was absent in epithelial cells of medullary duct segments after 30 days of 24% protein recovery, with Hsp70 immunoreaction near control levels.
The colocalization of apoptotic cells and Hsp70 expression staining in tubule epithelial cells showed that the induced increase on apoptotic cells was associated to weak immunoreaction for Hsp70 in the same tubule segments (OMCDs and IMCDs).
Low levels of apoptosis and Hsp70 immunoreaction similar to controls were observed after readministration of 24% protein in the cortex of LP in cytoplasm of epithelial cells from CCDs and PTs.
Effect of protein recovery on Hsp 70 expression, by Western blot analysis
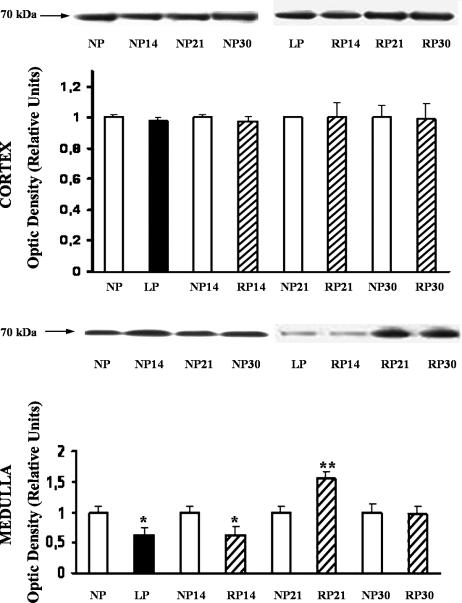
Figure 5 shows the bands immunostained to reveal levels of Hsp70 in the cortex and medulla from LP and NP kidney tissue lysates. Only the inducible form of Hsp70 was detected. In medulla, decreased Hsp70 protein levels were shown related to NP: LP, 68 ± 0.1%; n, 6; P < 0.05 (Fig 5). Persistent lower levels of Hsp70 protein were demonstrated until 14 days of protein recovery in the diet.
Fig 5.
Increased Hsp70 expression during late 24% protein recovery, in low-protein–fed rats. Western blot analysis of Hsp70 from cortex and medulla of NP, LP, and RP after readministration of 24% protein for 14, 21, and 30 days. Western blot results showing a representative animal of each group. Densitometric analysis immunoblots were quantified for Hsp70 expression. The relative amount of Hsp70 protein was determined after normalization of the level of Hsp70 protein of the appropriate control without treatment. Top, Cortex. Nonsignificant differences were observed in the protein level among groups. Data represent mean ± SEM of 5 separate experiments. Bottom, Medulla. Immunoblots reacted with anti-Hsp70 antibody revealed a single 70-kDa band. Densitometric analysis of Hsp70 protein abundance showed a significant decrease on Hsp70 expression in LP vs NP: *P < 0.05; and in RP for 14 days vs NP for 14 days: *P < 0.05. Increased Hsp70 expression at RP for 21 days vs LP, **P < 0.01, was demonstrated. Data represent mean ± SEM of 5 separate experiments
Conversely, overexpression of Hsp70 compared to control, as estimated by densitometric evaluation, was shown after 21 days of protein readministration. Thirty days after readministration of 24% protein in diet, Hsp70 levels were similar to those noted in NP (30 days). No differences in Hsp70 levels were found in cortex homogenates among the different groups (Fig 5).
Effect of angiotensin II AT1 receptor antagonist on epithelial cell apoptosis in medulla kidney from low-protein–fed rats
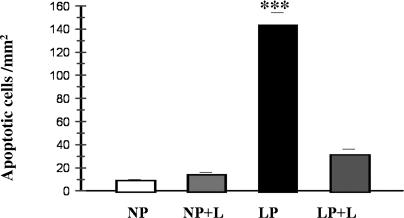
To determine whether AT1 receptor could be involved in the mediation of angiotensin II–induced apoptosis in medulla, administration of a selective AT1 receptor antagonist (Losartan; 10 mg/kg) plus 8% protein for 14 days, was performed. As shown in Figure 6, addition of Losartan significantly reduced apoptosis in medullary epithelial cells in LP when it was compared to LP without Losartan: 31 ± 5 vs 143 ± 11; P < 0.001.
Fig 6.
Apoptosis cell in medullary collecting ducts in LP plus Losartan treated rats. Addition of Losartan significantly decreased apoptosis induction in medullary epithelial cells in LP when it was compared to LP (8% protein) without Losartan, ***P < 0.001
No significant differences were demonstrated in the number of apoptotic cells between LP and NP, both groups with Losartan treatment (Fig 6).
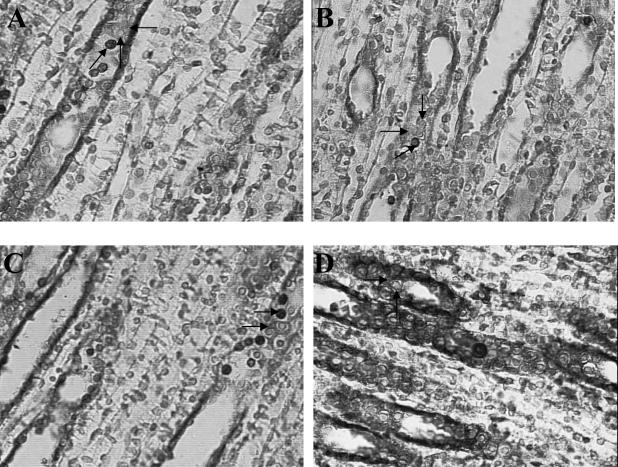
Through colocalization staining, increased Hsp70 immunoreaction was demonstrated in the cytoplasm of OMCD epithelial cells, associated with few apoptotic nuclei in the same epithelial cells, in LP with Losartan administration (Fig 7).
Fig 7.
Colocalization staining of apoptotic nuclei and Hsp70 expression in epithelial cells from medullary collecting ducts. Effect of Losartan on LP. Through colocalization staining of apoptotic nuclei (TUNEL technique) with HSP70 expression, apoptotic nuclei appeared as intense brown-staining nuclei and cytoplasmic slight brown HSP70 expression in the same tubule epithelial cells from medullary collecting ducts. Light counterstaining with 0.5% with hematoxylin was performed to reveal nonapoptotic nuclei, nuclei appeared as blue staining. Increased Hsp70 expression and decreased apoptosis induction after Losartan administration in LP. (A) Histological sections of kidney medulla from NP and NP plus Losartan fed rats: Lower number of apoptotic cells were seen in OMCDs and IMCDs (sloping arrow). Slight Hsp70 staining was shown (left pointing arrow). Non apoptotic nuclei appeared as blue staining (up arrow). (B) Histological sections of kidney medulla from NP and NP plus Losartan fed rats: Lower number of apoptotic cells were seen in OMCDs and IMCDs (right pointing arrow). Slight Hsp70 staining was shown (lower right pointing arrow). Nonapoptotic nuclei appeared as blue staining (down arrow). (C) Histological section of kidney medulla from LP fed rats. Higher number of apoptotic nuclei (upper arrow), with weak Hsp70 immunoreaction (lower arrow) were shown in the same epithelial cells from MCDs. (D) Histological section of kidney medulla from LP plus Losartan fed rats: Through colocalization staining, few apoptotic nuclei associated with increased cytoplasm immunoreaction for Hsp70 (right pointing arrow) was demonstrated in cytoplasm of OMCD in the same epithelial cells. Nonapoptotic nuclei appeared as blue staining (up arrow). Magnification, 630×. The colors mentioned in the text refer to the original specimens
Effect of angiotensin II AT1 receptor antagonist on Hsp70 expression, by immunohistochemical and Western blot analysis
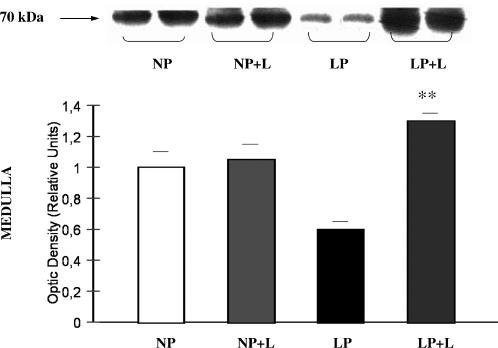
We next investigated whether the decreased apoptosis after angiotensin II receptor antagonist was associated with Hsp70 expression. The administration of Losartan to LP rats caused increased levels of Hsp70 when compared to LP without Losartan: 1.30 ± 0.05 vs 0.6 ± 0.05; P < 0.01 (Fig 8). Furthermore, linked to these results, increased Hsp70 immunoreaction was demonstrated in cytoplasm of OMCD epithelial cells in the LP plus Losartan group (Fig 7).
Fig 8.
Increased Hsp70 protein expression after AT1 receptor antagonist administration in LP. Western blot analysis of Hsp70 from medulla of NP, NP plus Losartan, LP, and LP plus Losartan. Blot represents 2 of 5 separate experiments. Densitometric analysis of Hsp70 abundance showed increased expression of Hsp70 in LP with Losartan related to LP without Losartan, **P < 0.01
Role of caspase 3 in apoptosis induction in low-protein–fed rats
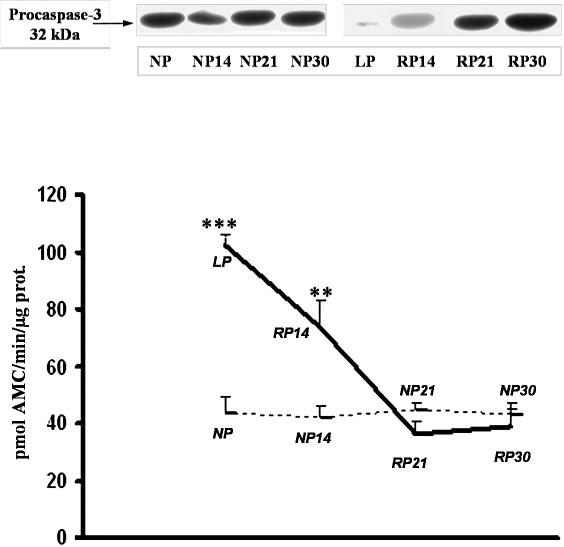
Caspase 3 protein levels were measured to determine whether LP-induced apoptosis in epithelial tubule cells occurred via the caspase cascade, which is the central protease in the cell death pathway. Western blot analysis demonstrated that 32-kDa caspase 3 protein was down-regulated due to its cleavage to an active protein, as determined by an increase on caspase 3 activity compared to control: LP, 102.3 ± 4, vs NP, 43.1 ± 5; P < 0.001. Increased appearance of apoptotic cells in medullary duct segments was shown after 14 days of protein recovery, associated with decreased procaspase protein levels, and increased activity of caspase 3 (Fig 9).
Fig 9.
Western Blot analysis for 32-kDa procaspase 3 protein and caspase 3 activity in kidney medulla from NP, LP, and RP for 14, 21, and 30 days. Top, Total protein (50 μg) was extracted from cytosol, and equal amounts of protein were loaded and separated by molecular weight on 12% SDS-polyacrylamide gel electrophoresis (PAGE). Blot represents 1 of 5 separate experiments. Bottom, Caspase 3 activity was assessed by level of Ac-DEVD-AMC cleavage release of fluorescence AMC tag. Activity is expressed as picomoles of AMC/minute/microgram of protein. LP compared with NP (***P < 0.001), RP for 14 days vs NP 14 days (**P < 0.01). Caspase 3 activity and procaspase 3 protein assay data were obtained from the same 5 independent samples
Protein recovery for 21 days caused absence of caspase activity, caspase 3 protein expression was similar to controls, with no significant positive TUNEL cells in tubule segments from medulla.
A return to control caspase activity values was noted after 30 days of protein recovery: 38.9 ± 6 vs 43.1 ± 5 (Fig 9).
Effect of angiotensin II AT1 receptor antagonist on caspase 3
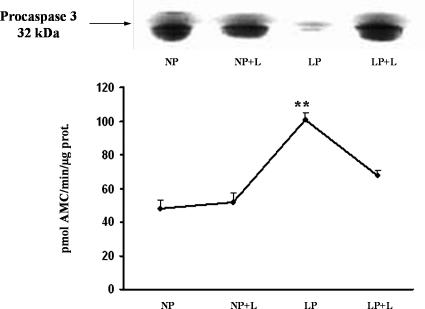
Absence of increased activity on caspase 3 and persistent levels of procaspase 3 protein levels after Losartan administration in LP allowed us to suggest a role of angiotensin II on the apoptosis induction in kidney medulla from LP (Fig 10).
Fig 10.
Procaspase 3 protein and caspase 3 activity in low protein with Losartan administration fed rats. Top, On immunoblot for caspase 3, expression of the proform (32 kDa) in LP plus Losartan was similar to controls. Intense decrease of the procaspase 3 was demonstrated in the LP without Losartan group. Representative immunoblot of 5 separate experiments. Bottom, Increased caspase activity expressed as picomoles of AMC/minute/microgram of protein is shown in LP without Losartan vs LP plus Losartan, **P < 0.01; n, 5; and when LP without Losartan was compared to NP, **P < 0.01. Caspase 3 activity and procaspase 3 protein assay data were obtained from the same 5 independent samples
mRNA levels of apoptosis regulatory genes: the Ratio Bax/Bcl-2
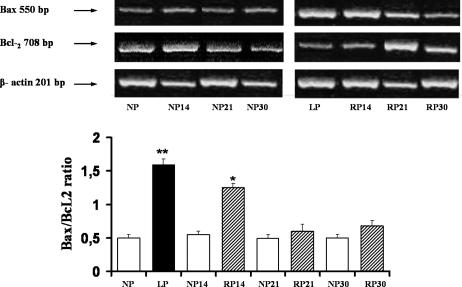
We next analyzed the pathways of apoptotic signaling in LP rats. To further the hypothesis that LP initiates the intrinsic pathway of apoptosis, we looked for the gene expression of Bax and Bcl-2. The antiapoptotic gene Bcl-2 expression was significantly decreased after LP rats compared with NP: 127 ± 6 vs 187 ± 0.5; P < 0.05. These changes result in a 3-fold increase in the proapoptotic ratio Bax/Bcl-2: 1.53 ± 0.09 vs 0.50 ± 0.05, P < 0.01, which reflects a change in the balance between cell life- and death-promoting genes (Fig 11).
Fig 11.
Induction of mRNA expression for Bcl-2 and Bax and the ratio of mRNA Bax/mRNA Bcl-2 in kidney medulla from LP, RP, and NP (control pair feeding of each group). RNA for Bcl-2 and Bax were measured by RT-PCR. Top, Gel electrophoresis of RT-PCR amplification products of specific mRNA encoding Bax, Bcl-2, and the housekeeping β-actin. The intensities of PCR products were determined by densitometric analysis. Bottom, Histograms showed the ratio for Bax/Bcl-2 mRNA to β-actin mRNA. Kidney medullas from LP compared with NP, **P < 0.01. Kidney medullas from RP for 14 days compared with NP 14 days, * P < 0.05. Data represent the means ± SEM of 5 independent experiments
Fourteen days after readministration of 24% protein, in medullary duct segments, the proapoptotic Bax/Bcl-2 ratio content increased, promoting enhanced cell apoptosis, as we have demonstrated. After 21 days of recovery, compared with NP, non-proapoptotic (Bax/Bcl-2 ratio) changes were observed (0.58 ± 0.10 vs 0.50 ± 0.05).
Increased Bcl-2 gene expression (206 ± 7 vs 127 ± 6; n = 5; P < 0.01), leading to a 2.5-fold decrease on the proapoptotic ratio Bax/Bcl-2, was demonstrated after 21 days of protein recovery, compared with LP.
Mitochondrial pathway of apoptosis: effect of angiotensin II AT1 receptor antagonist on Bax and Bcl-2 genes
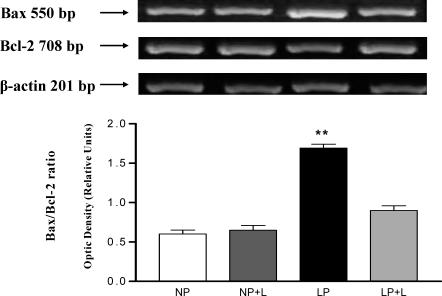
The expression of cell death and cell survival genes was studied in LP rats with angiotensin II receptor antagonist administration. In the presence of Losartan, decreased Bax mRNA expression was noted. Apoptosis inhibition associated with the increase in Bcl-2 mRNA expression was observed in medulla from the group of LP with Losartan related to the one of LP without Losartan: 213 ± 0.12 vs 131 ± 0.10, P < 0.01 (Fig 12).
Fig 12.
Effect of angiotensin II receptor antagonist on Bcl-2 and Bax gene expression. Top, Representative gels from mRNA Bax and Bcl-2 in lanes: NP, NP+L, LP, and LP+L. Housekeeping gene β-actin expression is shown in the line below. Bottom, Cotreatment with Losartan in LP inhibits Bax gene expression and increased Bcl-2 mRNA expression. Increased proapoptotic Bax/Bcl-2 ratio in kidney medullas from LP vs LP+L, **P < 0.01. Data represent the means ± SEM of 5 independent experiments
DISCUSSION
Apoptosis causes death in renal epithelial cells exposed to metabolic inhibitors (Lieberthal et al 1998; Feldenberg et al 1999) and contributes to the renal dysfunction that accompanies the ischemic insult (Schumer et al 1992; Lieberthal et al 1996). At the cellular basis, renal ischemia results in a remarkably heterogeneous injury, ranging from cellular dysfunction in nonlethally injured cells to cell death. Stress protein induction is an early survival signal elaborated by stressed cells to counter cellular damage and hasten recovery (Gething et al 1992; Li et al 2002).
There are limited studies describing induction of stress protein, taking into account its role in cytoprotection, by its ability to inhibit apoptotic cell death (Samali et al 1998; Jaatela et al 1999). Understanding of the renal cellular and molecular events that occur during LP feeding is incomplete and few studies have been conducted thereon.
Our results have demonstrated increased apoptosis induction in renal epithelial cells from medullary duct segments associated with decreased levels in Hsp70 protein expression during LP. Mitochondrial signaling pathway has been shown to regulate apoptosis induction in this experimental model through the increased proapoptotic ratio Bax/Bcl-2 and, consequently, increased caspase 3 activity. An interesting feature of our findings was the apoptosis resistance exhibited by the medullary epithelial cells, which express high levels of Hsp70 after Losartan administration, similar to the results of late protein recovery, suggesting angiotensin II AT1 receptor role in apoptosis induction and a cytoprotective effect by Hsp70 in LP feeding.
Dietary protein is an important modulator of the intrarenal actions of angiotensin II. Here, we showed the increased renal gene expression of AT1 receptor in LP. In addition, previous reports by other authors (Benabe et al 1993) and by us (Vallés et al 2005) have shown enhanced RAS components demonstrated in LP fed rats. Involvement of local angiotensin II on renal hemodynamics owing to increased vascular resistance and reduced prostaglandin synthesis contributing to renal ischemia, has been previously reported in LP feeding (Ichikawa et al 1980; Kapoor et al 1991). In addition, angiotensin-converting enzyme reversed the glomerular hypoperfusion and the hypofiltration induced by low-protein diet (Fernandez-Repollet et al 1987).
Renal ischemic injury events in LP feeding include hypoxia and ATP depletion on epithelial cells from duct segments (Seney et al 1989), both stimuli that might be involved in our results of cell apoptosis induction. Furthermore, a non-hemodynamic effect of angiotensin II as a profibrotic cytokine, contributing to renal injury, can be included in LP as demonstrated in other experimental models (Klahr et al 1988; Ishidoya et al 1995; Manucha et al 2004). Besides its effect on cell proliferation and growth, angiotensin II has been shown to induce apoptosis (Ding et al 2002).
Herein, we demonstrated increased apoptosis induction in epithelial cells from outer and lesser inner medullary collecting duct segments (OMCDs and IMCDs) in LP. The importance of apoptosis as a cause of death in LP epithelial cells from medulla segments was also supported by the down-regulation of procaspase 3 linked to increased activity of caspase 3, leading to a joint final execution pathway. In support of a role of the mitochondrial pathway of apoptosis in LP, we showed a reduction of Bcl-2 mRNA, an antiapoptotic factor, coupled with an increase of the Bax/Bcl-2 proapoptotic ratio in kidney medulla from LP.
Conversely, nonsignificant apoptosis induction was demonstrated in proximal duct segments and cortical collecting ducts from cortex in LP.
A possible explanation for these results may include differences in oxygen tension between the cortex and medulla, due to the participation of renal ischemia on apoptosis induction in LP feeding. Cells in the outer medulla suffer more extreme oxygen deprivation than cells in the cortex with a falling gradient of oxygen tension in the cells of the deepest zone of the outer medulla, the latter being more susceptible to ischemic injury (Breziz et al 1995). Previously, we have demonstrated intense compromise of medullary epithelial cell duct segments in LP due to the decreased H+-ATPase activity in OMCDs and IMCDs (Vallés et al, 2005).
During low-protein feeding, the relationship between decreased contents of renal medullary organic osmolytes and urine concentrating defect has been examined (Nakanishi et al, 1996).
In our results, the reduced medullary interstitial urea might be involved in the Hsp70 down-regulation during the prolonged period of low-protein diet. This suggestion may be inferred from the previous demonstration of accumulation of compatible organic osmolytes and enhanced synthesis of Hsp70 having relation to the protection process against high interstitial urea concentration in medulla (Neuhofer et al 2005). Moreover, the functional significance of Hsp70 for cells of the collecting duct has been demonstrated recently, because expression of Hsp70 protects epithelial cells by counteracting the urea-mediated decrease in the activity of several enzymes and preventing the execution of the apoptotic pathway (Neuhofer and Beck 2005).
Under stress, the protective function of heat shock proteins has been described by their ability to reversibly interact with damaged proteins in the cells (Hartl et al 2002). Furthermore, a novel role of these stress proteins includes the inhibitory effect of Hsp70 on the apoptotic cell death (Garrido et al 2001). Previous studies have shown that prior heat exposure (Mosser et al 1992) and/ or the selective overexpression of Hsp72, decreased apoptosis (Li et al 1996; Buzzard et al 1998). Interaction between Hsp70 and Bcl-2 has been shown to be responsible, at least in part, for the protection afforded by prior Hsp70 against ATP depletion injury in renal epithelial cells (Wang et al 1999). Consistent with these observations, we showed a significant 5-fold reduction of positive TUNEL cells associated with increased Hsp70 expression in cytoplasm of the same epithelial cells from medullary duct segments and, in addition, higher Hsp70 protein levels compared to LP, after 21 days of recovery. Moreover, involvement of mitochondrial pathway of apoptosis through the increased antiapoptotic mRNA Bcl-2 in this phase of protein recovery was shown.
Presence of procaspase 3 by immunoblotting and nondetectable caspase 3 activity, prompted the suggestion of an antiapoptotic Hsp70 action upstream of procaspase activation. On the other hand, after LP and in the recovery of 24% protein in diet, surprisingly, persistent down-regulation of Hsp70 protein levels with nearly 10-fold increased apoptotic nuclei in epithelial cell from medullary duct segments, similar to the LP period, was lengthened for 14 days.
The role of caspase 3 in the promotion of apoptotic cell death was shown, involving the intrinsic mitochondrial pathway of apoptosis. Absence of apoptotic cell death inhibition with down-regulation of Hsp70 expression was also demonstrated in the early protein recovery (3 and 7 days) (data not shown).
From our results, we infer an inverse association between Hsp70 and apoptosis induction, suggesting a cytoprotective effect by Hsp70 during late recovery from LP. The antiapoptotic factor Bcl-2 was involved in the resistance to cell death at this time period. Given its Bcl-2 localization within mitochondria and its role in preventing cytochrome c release, preservation of Bcl-2 by Hsp70 could account for the protection of epithelial cells (Borkan et al 1993). Nevertheless, Hsp70 may intervene at several points to halt progression of the apoptotic cascade. Other studies have indicated that at least some of the antiapoptotic activity of Hsp70 can be attributed to its ability to suppress the activity of Jun kinase (Gabai et al 1997; Kumar et al 2003). Alternatively, Hsp70 may also act by preventing cell death by interfering with the ability of cytochrome c and Apaf-1 to recruit procaspase 9. Hsp70 therefore suppresses apoptosis by directly associating with Apaf-1 and blocking the assembly of a functional apoptosome (Beere et al 2000).
We further studied the intrarenal angiotensin II participation on apoptosis induction in this experimental model of enhanced expression of genes that encode for components of RAS. It is interesting to point out that angiotensin II has been demonstrated to induce apoptosis, depending on the cell type and receptor subtype binding. Recently, it has been demonstrated that angiotensin II induces apoptosis in glomerular visceral cells in a dose- and time-dependent manner, and the proapoptotic effects are mediated by both AT1 and AT2 receptors (Ding et al 2002). In our study, administration of a non-hypotensive dose of the AT1 angiotensin II receptor inhibitor, Losartan plus 8% protein in diet, for 14 days, produced a protection similar to control against apoptosis in tubular epithelial cells from kidney medullas. After Losartan treatment, tubular epithelial cell apoptosis induction was hindered by increased Hsp70 expression linked to a significant increase in Bcl-2, and decreased Bax mRNA expression, as we have shown in LP after 21 days of protein (24%) recovery.
Similar to our results, angiotensin II has been shown to induce renal tubular cell apoptosis, mediated via both AT1 and AT2 receptors, through the transcription of cell death genes as Fas, Fas l, and Bax, and later activation of caspase 3 (Bhaskaran et al 2003). Recently, we have reported that Losartan in a non-hypotensive dose, increased Hsp70 expression and reversed the oxidative stress state, thus getting involved in ameliorating the progression of tubulointerstitial fibrosis in obstructive nephropathy (Manucha et al 2005).
Our present results suggest that both mechanisms— cell stress response by Hsp70 expression and apoptosis development—are engaged in response to stress, albeit the former is protective and the latter is potentially lethal. We provided evidence for the apoptosis induction in epithelial cells from medullary collecting duct segments in LP and for the antiapoptotic, cytoprotective mechanism of Hsp70 during protein recovery. An association between AT1 receptor inhibition and increased Hsp70 expression as a cytoprotector effector on apoptosis in this experimental model of LP could be suggested.
Late protein recovery abolished apoptosis induction in LP fed rats, restoring the kidney histology to an almost normal situation.
Acknowledgments
This work was performed with financial support from CONICET, PICT/2002 N 05-12620, and from the Research and Technology Council of Cuyo University (CIUNC) Mendoza, Argentina, N: 1143/04 (P.G.V.).
REFERENCES
- Agashe VR, Hartl FU. Role of molecular chaperones in cytoplasmic protein folding. Semin Cell Dev Biol. 2000;11:15–25. doi: 10.1006/scdb.1999.0347.1084-9521(2000)011[0015:ROMCIC]2.0.CO;2 [DOI] [PubMed] [Google Scholar]
- Beere HM, Green DR. Stress management—heat shock protein-70 and the regulation of apoptosis. Trends Cell Biol. 2001;11:6–10. doi: 10.1016/s0962-8924(00)01874-2.0962-8924(2001)011[0006:SMSPAT]2.0.CO;2 [DOI] [PubMed] [Google Scholar]
- Beere HM, Wolf BB, Cain K, Tailor P, Morimoto RI, Cohen GM, Green DR. Heat-shock protein 70 inhibits apoptosis by preventing recruitment of procaspase-9 to the Apaf-1 apoptosome. Nat Cell Biol. 2000;2:469–475. doi: 10.1038/35019501.1465-7392(2000)002[0469:HPIABP]2.0.CO;2 [DOI] [PubMed] [Google Scholar]
- Benabe J, Wang S, Wilcox J, Martinez-Maldonado M. Modulation of ANG II receptor and mRNA in normal rat low-protein feeding. Am J Physiol. 1993;265:F660–F669. doi: 10.1152/ajprenal.1993.265.5.F660.0002-9513(1993)265[F660:MOAIRA]2.0.CO;2 [DOI] [PubMed] [Google Scholar]
- Benabe JE, Martinez-Maldonado M. The impact of malnutrition on kidney function. Miner Electrolyte Metab. 1998;24:20–26. doi: 10.1159/000057346.0378-0392(1998)024[0020:TIOMOK]2.0.CO;2 [DOI] [PubMed] [Google Scholar]
- Bhaskaran M, Reddy K, Radhakrishanan N, Franki N, Ding G, Singhal PC. Angiotensin II induces apoptosis in renal proximal tubular cells. Am J Physiol. 2003;284:F955–F965. doi: 10.1152/ajprenal.00246.2002.0002-9513(2003)284[F955:AIIAIR]2.0.CO;2 [DOI] [PubMed] [Google Scholar]
- Borkan SC, Emami A, Schwartz JH. Heat stress protein-associated cytoprotection in inner medullary collecting duct cells from rat kidney. Am J Physiol. 1993;265:F333–F341. doi: 10.1152/ajprenal.1993.265.3.F333.0002-9513(1993)265[F333:HSPCII]2.0.CO;2 [DOI] [PubMed] [Google Scholar]
- Breziz M, Rosen S. Hypoxia of the renal medulla; its implications for disease. N Engl J Med. 1995;332:647–655. doi: 10.1056/NEJM199503093321006.1533-4406(1995)332[0647:HOTRII]2.0.CO;2 [DOI] [PubMed] [Google Scholar]
- Buzzard KA, Giaccia AJ, Killender M, Anderson RL. Heat shock protein 72 modulates pathways of stress-induced apoptosis. J Biol Chem. 1998;273:17147–17153. doi: 10.1074/jbc.273.27.17147.0021-9258(1998)273[17147:HSPMPO]2.0.CO;2 [DOI] [PubMed] [Google Scholar]
- Cachat F, Lange-Sperandio B, Chang AY, Kiley SC, Thornhill BA, Forbes MS, Chevalier RL. Ureteral obstruction in neonatal mice elicits segment-specific tubular cell responses leading to nephron loss. Kidney Int. 2003;63:564–575. doi: 10.1046/j.1523-1755.2003.00775.x.0085-2538(2003)063[0564:UOINME]2.0.CO;2 [DOI] [PubMed] [Google Scholar]
- Ding G, Reddy K, Kapasi A, Kasinath BS, Singhal PC. Angiotensin II induces apoptosis in rat glomerular epithelial cells. Am J Physiol. 2002;283:F173–F180. doi: 10.1152/ajprenal.00240.2001.0002-9513(2002)283[F173:AIIAIR]2.0.CO;2 [DOI] [PubMed] [Google Scholar]
- Dogra G, Ward N, Croft KD. Oxidant stress in nephrotic syndrome. Comparison of F(2)-isoprostanes and plasma antioxidant potential. Nephrol Dial Transplant. 2001;16:1626–1630. doi: 10.1093/ndt/16.8.1626.1460-2385(2001)016[1626:OSINSC]2.0.CO;2 [DOI] [PubMed] [Google Scholar]
- Feldenberg LR, Thevananther S, del Rio M, de Leon M, Devarajan P. Partial ATP depletion induces Fas and caspase mediated apoptosis in MDCK cells. Am J Physiol. 1999;276:F837–F846. doi: 10.1152/ajprenal.1999.276.6.F837.0002-9513(1999)276[F837:PADIFA]2.0.CO;2 [DOI] [PubMed] [Google Scholar]
- Fernandez-Repollet E, Tapia E, Martinez Maldonado M. Effects of angiotensin-converting enzyme inhibition on altered renal hemodynamics induced by low protein diet in the rat. J Clin Invest. 1987;80:1045–1049. doi: 10.1172/JCI113158.0021-9738(1987)080[1045:EOAEIO]2.0.CO;2 [DOI] [PMC free article] [PubMed] [Google Scholar]
- Gabai VL, Meriin AB, Mosser DD, Caron AW, Rits S, Shifrin VI, Sherman MY. Hsp70 prevents activation of stress kinases. A novel pathway of cellular thermotolerance. J Biol Chem. 1997;272:18033–18037. doi: 10.1074/jbc.272.29.18033.0021-9258(1997)272[18033:HPAOSK]2.0.CO;2 [DOI] [PubMed] [Google Scholar]
- Garrido C, Gurbuxani S, Ravagnan L, Kroemer G. Heat shock proteins: endogenous modulators of apoptotic cell death. Biochem Biophys Res Commun. 2001;286:433–442. doi: 10.1006/bbrc.2001.5427.0006-291X(2001)286[0433:HSPEMO]2.0.CO;2 [DOI] [PubMed] [Google Scholar]
- Gething MJ, Sambrook J. Protein folding in the cell. Nature. 1992;355:33–45. doi: 10.1038/355033a0.1476-4687(1992)355[0033:PFITC]2.0.CO;2 [DOI] [PubMed] [Google Scholar]
- Hartl FU, Hayer-Hartl M. Molecular chaperones in the cytosol: from nascent chain to folded protein. Science. 2002;295:1852–1858. doi: 10.1126/science.1068408.0193-4511(2002)295[1852:MCITCF]2.0.CO;2 [DOI] [PubMed] [Google Scholar]
- Ichikawa I, Pukerson ML, Klahr S, Troy IL, Martinez-Maldonado M, Brenner BM. Mechanism of reduced glomerular filtration rate in chronic malnutrition. J Clin Invest. 1980;65:982–988. doi: 10.1172/JCI109784.0021-9738(1980)065[0982:MORGFR]2.0.CO;2 [DOI] [PMC free article] [PubMed] [Google Scholar]
- Ishidoya S, Morrissey J, McCracken R, Reyes A, Klahr S. Angiotensin II receptor antagonist ameliorates renal tubulointerstitial fibrosis caused by unilateral ureteral obstruction. Kidney Int. 1995;47:1285–1294. doi: 10.1038/ki.1995.183.0085-2538(1995)047[1285:AIRAAR]2.0.CO;2 [DOI] [PubMed] [Google Scholar]
- Jaatela M. Escaping cell death: survival protein in cancer. Exp Cell Res. 1999;248:30–43. doi: 10.1006/excr.1999.4455.0014-4827(1999)248[0030:ECDSPI]2.0.CO;2 [DOI] [PubMed] [Google Scholar]
- Kaneto H, Morrissey J, McCracken R, Reyes A, Klahr S. Enalapril reduces collagen type IV synthesis and expansion of the interstitium in the obstructed rat kidney. Kidney Int. 1994;45:1637–1647. doi: 10.1038/ki.1994.215.0085-2538(1994)045[1637:ERCTIS]2.0.CO;2 [DOI] [PubMed] [Google Scholar]
- Kapoor SC, Krishna GG. Protein-induced modulation of renin secretion is mediated by prostaglandins. Am J Physiol. 1991;260:F688–F694. doi: 10.1152/ajprenal.1991.260.5.F688.0002-9513(1991)260[F688:PMORSI]2.0.CO;2 [DOI] [PubMed] [Google Scholar]
- Kiang JG, Tsokos GC. Heat shock protein 70 kDa: molecular biology, biochemistry and physiology. Pharmacol Ther. 1998;80:183–201. doi: 10.1016/s0163-7258(98)00028-x.0163-7258(1998)080[0183:HSPKMB]2.0.CO;2 [DOI] [PubMed] [Google Scholar]
- Klahr S, Schreiner G, Ichikawa I. The progression of renal disease. N Engl J Med. 1988;318:1657–1666. doi: 10.1056/NEJM198806233182505.1533-4406(1988)318[1657:TPORD]2.0.CO;2 [DOI] [PubMed] [Google Scholar]
- Kumar Y, Tatu U. Stress protein flux during recovery from simulated ischemia: induced heat shock protein 70 confers cytoprotection by suppressing JNK activation and inhibiting apoptotic cell death. Proteomics. 2003;3:513–526. doi: 10.1002/pmic.200390065.1615-9861(2003)003[0513:SPFDRF]2.0.CO;2 [DOI] [PubMed] [Google Scholar]
- Li F, Mao HP, Ruchalski KL, Wang YH, Choy W, Schwartz JH, Borkan SC. Heat stress prevents mitochondrial injury in ATP-depleted renal epithelial cells. Am J Physiol. 2002;283:C917–C926. doi: 10.1152/ajpcell.00517.2001.0002-9513(2002)283[C917:HSPMII]2.0.CO;2 [DOI] [PubMed] [Google Scholar]
- Li YW, Chen CH, Ling CC, Li GC. Apoptosis in heat-induced cell killing: the protective role of hsp70 and the sensitization effect of the c-myc gene. Radiat Res. 1996;145:324–330.0033-7587(1996)145[0324:AIHCKT]2.0.CO;2 [PubMed] [Google Scholar]
- Lieberthal W, Levine JS. Mechanisms of apoptosis and its potential role in renal tubular epithelial cell injury. Am J Physiol. 1996;271:F477–F488. doi: 10.1152/ajprenal.1996.271.3.F477.0002-9513(1996)271[F477:MOAAIP]2.0.CO;2 [DOI] [PubMed] [Google Scholar]
- Lieberthal W, Menza SA, Levine JS. Graded ATP depletion can cause necrosis or apoptosis of cultured mouse proximal tubular cells. Am J Physiol. 1998;274:F315–F327. doi: 10.1152/ajprenal.1998.274.2.F315.0002-9513(1998)274[F315:GADCCN]2.0.CO;2 [DOI] [PubMed] [Google Scholar]
- Liu X, Kin CN, Yang J, Jemmerson R, Wang X. Induction of apoptotic program in cell-free extracts: requirement for dATP and cytochrome c. Cell. 1996;85:147–157. doi: 10.1016/s0092-8674(00)80085-9.0092-8674(1996)085[0147:IOAPIC]2.0.CO;2 [DOI] [PubMed] [Google Scholar]
- Manucha W, Carrizo L, Oliveros L, Seltzer A, Vallés P. Unilateral ureteral obstruction: Losartan modulation on NOS isoforms and COX-2 expression in early renal fibrogenesis. Kidney Int. 2004;65:1–17. doi: 10.1111/j.1523-1755.2004.00643.x.0085-2538(2004)065[0001:UUOLMO]2.0.CO;2 [DOI] [PubMed] [Google Scholar]
- Manucha W, Ruete C, Carrizo L, Vallés P. Angiotensin II type I antagonist on oxidative stress and heat shock protein 70 (Hsp 70) expression in obstructive nephropathy. Cell Mol Biol. 2005;51:547–555.0145-5680(2005)051[0547:AITIAO]2.0.CO;2 [PubMed] [Google Scholar]
- Martinez-Maldonado M, Bernabe JE, Wilcox J, Wang S, Luo C. Renal renin, Angiotensinogen, and ANG I-converting-enzyme gene expression: influence of dietary protein. Am J Physiol. 1993;264:F981–F988. doi: 10.1152/ajprenal.1993.264.6.F981.0002-9513(1993)264[F981:RRAAAI]2.0.CO;2 [DOI] [PubMed] [Google Scholar]
- Morimoto RI, Tissieres A, and Georgopoulos C 1994. Progress and perspectives on the biology of heat shock proteins and molecular chaperones. In: The Biology of Heat Shock Proteins and Molecular Chaperones, ed Morimoto RI, Tissieres A, Georgopoulos C. Cold Spring Harbor Laboratory Press, Cold Spring Harbor, NY, 395– 416. [Google Scholar]
- Mosser DD, Martin LH. Induced thermotolerance to apoptosis in a human T lymphocyte cell line. J Cell Physiol. 1992;151:561–570. doi: 10.1002/jcp.1041510316.0021-9541(1992)151[0561:ITTAIA]2.0.CO;2 [DOI] [PubMed] [Google Scholar]
- Nakanishi T, Nishihara F, Yamauchi A, Yamamoto S, Sugita M, Takamitsu Y. NaCl and/or urea infusion fails to increase renal inner medullary myo-inositol in protein-deprived rats. Am J Physiol. 1996;271:F1255–F1263. doi: 10.1152/ajprenal.1996.271.6.F1255.0002-9513(1996)271[F1255:NOUIFT]2.0.CO;2 [DOI] [PubMed] [Google Scholar]
- Neuhofer W, Beck FX. Cell survival in the hostile environment of the renal medulla. Annu Rev Physiol. 2005;67:531–555. doi: 10.1146/annurev.physiol.67.031103.154456.0066-4278(2005)067[0531:CSITHE]2.0.CO;2 [DOI] [PubMed] [Google Scholar]
- Neuhofer W, Fraek ML, Ouyang N, Beck FX. Differential expression of heat shock protein 27 and 70 in renal papillary collecting duct and interstitial cells—implications for urea resistance. J Physiol. 2005;564:715–722. doi: 10.1113/jphysiol.2004.081463.0022-3751(2005)564[0715:DEOHSP]2.0.CO;2 [DOI] [PMC free article] [PubMed] [Google Scholar]
- Pueyo ME, Arnal JF, Rami J, Michel JB. Angiotensin II stimulates the production of NO and peroxynitrite in endothelial cells. Am J Physiol. 1998;274:C214–C220. doi: 10.1152/ajpcell.1998.274.1.C214.0002-9513(1998)274[C214:AISTPO]2.0.CO;2 [DOI] [PubMed] [Google Scholar]
- Saikumar P, Dong Z, Patel Y, Hall K, Hopfer U, Weinberg JM, Venkatachalam MA. Role of hypoxia-induced Bax translocation and cytochrome c release in reoxygenation injury. Oncogene. 1998;17:3401–3415. doi: 10.1038/sj.onc.1202590.0950-9232(1998)017[3401:ROHBTA]2.0.CO;2 [DOI] [PubMed] [Google Scholar]
- Samali A, Orrenius S. Heat shock proteins: regulators of stress response and apoptosis. Cell Stress Chaperones. 1998;3:228–236. doi: 10.1379/1466-1268(1998)003<0228:hspros>2.3.co;2.1466-1268(1998)003[0228:HSPROS]2.0.CO;2 [DOI] [PMC free article] [PubMed] [Google Scholar]
- Schumer M, Colombel MC, and Sawczuk IS. et al. 1992 Morphologic, biochemical and molecular evidence of apoptosis during the reperfusion phase after brief periods of renal ischemia. Am J Pathol. 140:831–838. [PMC free article] [PubMed] [Google Scholar]
- Seney FD, Marver D. Protein intake and cation transport in the loop of Henle. J Lab Clin Med. 1989;114:587–599.0022-2143(1989)114[0587:PIACTI]2.0.CO;2 [PubMed] [Google Scholar]
- Vallés PG, Carrizo L, Seltzer A, Manucha W. H+-ATPase activity in collecting duct segments in protein-deprived rats. Role of angiotensin II on its regulation. Nephron Physiol. 2005;99:90–100. doi: 10.1159/000083765.1660-2137(2005)099[0090:HAICDS]2.0.CO;2 [DOI] [PubMed] [Google Scholar]
- Wang Y, Knowiton AA, Christensen TG. Prior heat stress inhibits apoptosis in adenosine triphosphate-depleted renal tubular cells. Kidney Int. 1999;55:2224–2235. doi: 10.1046/j.1523-1755.1999.00476.x.0085-2538(1999)055[2224:PHSIAI]2.0.CO;2 [DOI] [PubMed] [Google Scholar]
- Yamada T, Horiuchi M, Dzau VJ. Angiotensin II Type 2 receptor mediates programmed cell death. Proc Natl Acad Sci USA. 1996;93:156–160. doi: 10.1073/pnas.93.1.156.1091-6490(1996)093[0156:AITRMP]2.0.CO;2 [DOI] [PMC free article] [PubMed] [Google Scholar]
- Zhang W, Khanna P, Chan LL, Campbell G, Ansari NH. Diabetes-induced apoptosis in rat kidney. Biochem Mol Med. 1997;61:58–62. doi: 10.1006/bmme.1997.2592.1077-3150(1997)061[0058:DAIRK]2.0.CO;2 [DOI] [PubMed] [Google Scholar]


