

Abstract
Research Objective
The financial savings from the Balanced Budget Act (BBA) are attractive to policy makers, but such savings come at a cost. We measure changes in nurse staffing at hospitals related to potential declines in reimbursement through the BBA.
Study Design
Following Hadley, Zuckerman, and Feder (1989), we define a fiscal pressure index (FPI) to measure the differential effect of the BBA. We estimate the effect of the FPI on the number of full-time equivalent registered nurses (RN) and licensed practical nurses (LPN) per adjusted patient day using American Hospital Association (AHA) data of a panel of hospitals from 1996 to 2001. The AHA data are combined with the Area Resource Files and health maintenance organizations penetration data. We control for hospital heterogeneity using fixed effects.
Population Studied
All urban short-term general hospitals that responded to the staffing and uncompensated care questions in the AHA survey between 1996 and 2001. We define safety net hospitals as those with a high ratio of uncompensated costs to total hospital expenses (see, e.g., Zuckerman et al. 2001).
Principal Findings
We find that the nonsafety net hospitals that were most susceptible to the provisions of the BBA experienced a decline in RN staffing ratios about twice the rate of the nonsafety net hospitals that were least susceptible to the BBA. We are unable to detect an effect of the BBA on staffing at safety net hospitals.
Conclusions
RN and LPN staffing levels per adjusted patient day declined, on average, between 1996 and 2001. Within the context of the general decline, we find that RN staffing per adjusted patient day declined even more at nonsafety net hospitals that were most susceptible to lower reimbursement related to the BBA. Thus, there was a small but statistically significant incremental effect of potential BBA losses on RN staffing at hospitals that were expected to be affected most. This incremental decline represented about a 6 percent increase in nurse workload that in isolation might not affect quality. Nevertheless, the BBA contributed to the contemporaneous trends toward higher nurse workloads that could have deleterious effects on quality. In contrast, safety net hospitals did not respond to the provisions of the BBA by reducing staffing ratios. This conclusion is tempered by the fact that we have few safety net hospitals in the sample.
Keywords: Hospital nurse staffing, saftey net
The Balanced Budget Act of 1997 (BBA) led to the largest change in hospital Medicare payments since the implementation of the Prospective Payment System of 1983. The Congressional Budget Office (CBO) originally forecasted a reduction of $115 billion in Medicare expenditures owing to the BBA (Ernst & Young and HCIA-Sachs 2000). However, soon after the implementation, the CBO increased its original forecast of cost reductions to $227 billion between 1998 and 2002. The cost reductions in the first year were substantial; clearly there was an immediate effect on hospital finances. However, various provisions of the BBA were relaxed and delayed in subsequent years, leading to a gradual increase in expenditures.
We measure how the potential changes in BBA-related reimbursement affect hospital nurse staffing decisions at urban short-term general hospitals. We identify the incremental effect of the BBA on nurse staffing by comparing hospitals that were most likely to be affected by the BBA with hospitals that were least likely to be affected. We focus on nurse staffing because, while the reduction in Medicare expenditure was substantial, such reductions may have deleterious effects on quality. A primary mechanism by which quality would be affected is nurse staffing levels.
Our study is in the spirit of the Buerhaus and Staiger studies in that we seek to establish a link between payers and staffing levels. Buerhaus and Staiger (1996, 1999) found that the growth of managed care led to a decline in nurse staffing and wages. Further, Aiken et al. (2002) found that higher caseloads were a significant determinant of burnout and decreased job satisfaction, which can lead to nurses leaving the hospital workforce. Spetz (1999) found managed care was associated with fewer LPNs and aides. Provisions, such as the BBA, may affect staffing levels if lowered reimbursement makes hospitals unable to continue staffing at levels commensurate with the number of patients days or admissions.1
Several recent studies have shown that nurse staffing has important implications for the quality of hospital care. Needleman et al. (2002) found that the proportion of registered nurses (RNs) providing nursing care and the number of hours provided by RNs was positively associated with quality of care. They also found that the level of staffing by RNs was not associated with the rate of in-hospital mortality. Kovner et al. (2002) found that a reduction in nurse hours per adjusted patient day was associated with an increase in pneumonia for routine and emergency admissions. Aiken et al. (2002) reported that each additional patient per nurse led to a 7 percent increase in the probability of dying within 30 days of admission and a 7 percent increase in the probability of failure-to-rescue. These results are generally consistent with other studies that found that patient quality and outcomes of care are positively associated with increases in nurse-to-patient staffing levels, increased RN proportions in total nursing staff, and reduced nursing workloads (Manheim et al. 1992; Taunton et al. 1994; Silber and Rosenbaum 1995; Blegen and Vaughan 1998; Blegen, Goode, and Reed 1998; Kovner and Gergen 1998; McCloskey 1998; Schultz et al. 1998, 1999; Lichtig, Knauf, and Miholland 1999; Pronovost et al. 1999; van Servellen and Schultz 1999; Mark et al. 2004). In this article, we look at RN and licensed practical nurse (LPN) staffing ratios separately. We do so because most of the literature cited above either focuses on the number of RNs or the ratio of RNs to LPNs as an indicator of quality. RNs are, by far, the most common type of nurses in inpatient care settings. We include LPNs because LPN positions are often the first to get cut when financial conditions worsen because they require less training and acquire fewer firm-specific skills.
In this analysis, we also test whether safety net hospitals react differently to the BBA than nonsafety net hospitals. Hoerger (1991), using data from the mid- to late-1980s, found that nonprofit hospitals and, to a lesser extent, publicly owned hospitals have less volatile net income (or loss)2 than for-profit hospitals. Hoerger tied this result to utility (as opposed to profit) maximization and suggested that a “hospital may reduce its quality or cut back on its provision of free care”3 if there is an exogenous reduction in payments in order to satisfy its profit constraint. Clearly, nurse staffing is one mechanism by which hospitals might cut back on quality. The other is uncompensated care. However, a nonsafety net hospital, by definition, does not provide a large amount of uncompensated care either in terms of market share or as a proportion of its total revenue. Thus, lowering uncompensated care in response to changes in reimbursement is unlikely to have a significant effect on a nonsafety net hospital's income statement. Thus, staffing ratios are one of the main tools administrators at nonsafety net hospitals have to cut costs. In contrast, the effect of the BBA on staffing ratios may be lower at safety net hospitals because uncompensated care may also adjust in response to changes in reimbursement.
In the next section, we describe the BBA and its subsequent revisions, and we describe how the brunt of the reductions occurred during the first year and were relaxed subsequently. This is followed by an explanation of our methods and results.
The BBA and the Revisions
Hospital Medicare revenues were affected by the BBA through reductions in the annual update factors for diagnosis-related groups (DRGs) and capital payments, immediate reductions in outpatient payments for selected services and subsequent implementation of an outpatient prospective payment system, reductions in Medicare Disproportionate Share Hospital (DSH) payments, and reductions in direct and indirect graduate medical education payments. Hospital Medicaid payments were also indirectly affected because the BBA included reductions in the growth of state DSH payments and the repeal of the Boren Amendment, which had set a floor for reimbursement levels. The initial provisions of BBA took effect on the first day of Federal Fiscal Year (FFY) 1998 and were originally expected to reduce Medicare program reimbursement of hospitals by $72 billion for the period 1998–2002 and $119 billion for the period 1998–2004 (Heiber-White 1997; American Hospital Association 2001).
Larger than anticipated BBA effects on Medicare expenditures led the U.S. Congress to enact the Medicare Balanced Budget Refinement Act of 1999 (BBRA). The bulk of restored Medicare funds for BBRA were earmarked to offset projected outpatient payment shortfalls. The BBRA also lengthened the transition period for permanent reductions in indirect medical education payments by a year and reduced cuts in planned DSH payments, calling for a 3 percent reduction in FFY 2001 versus 4 percent and a 4 percent reduction in FFY 2002 rather than 5 percent. The following year the Benefits Improvement and Protection Act further relaxed or delayed several original BBA provisions. However, the time period of our study is 1996–2001, and we do not expect to measure any direct effects of the Benefits Improvement and Protection Act. Overall, the BBA revisions were expected to restore about $21 billion of hospital payment savings for the period 1998–2004 (American Hospital Association 2001).
METHODS
We model nurse staffing ratios, defined as nurse full-time equivalents (FTEs) divided by adjusted patient days, as a function of hospital case mix (Case mix), a hospital fixed effect (yi), and a market year fixed effect (mmt):
| (1) |
where i denotes hospital, m denotes market, and t denotes time. Case mix includes Medicare case mix and several visit-mix variables described below. The hospital fixed effect is included to control for all fixed hospital hospitals characteristics that may affect staffing ratios, such as efficiency, productivity, working environment, and so forth. The market fixed effect controls for market-specific factors that affect the supply and demand for nurses in each time period. We also include the results from a specification where we replace the market-time fixed effect with the market-level variables described below.
The denominator of the dependent variable is total adjusted patient days. Adjusted patient days are calculated by the American Hospital Association (AHA) by taking the weighted sum of inpatient days and outpatient visits. The weights are the proportion of revenue derived from inpatient and outpatient activities, respectively. We use adjusted patient days because the nurse FTE variables are not separately reported on an inpatient and outpatient basis. Adjusted admissions are measured in an identical manner, except admissions are used instead of days. Below we define Medicare-adjusted admissions, which are calculated using only Medicare patients.
We posit that declines in reimbursement associated with BBA will lead to lower employment of nurses than what would occur without the BBA. We identify this effect by defining hospitals that are particularly affected by changing Medicare revenues as those that have high fiscal pressure based on an index defined below, which we will call a fiscal pressure index (FPI). If our hypothesis is true, we would expect hospitals with a high FPI to have a lower nurse staffing level after BBA than hospitals with a low FPI. Equation (2) can be written to take into account the FPI level (High FPI) as follows:
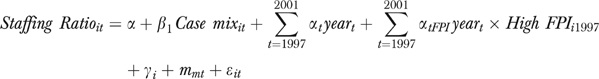 |
(2) |
where  measure differential trends at high FPI hospitals and year is a dummy variable for each year to take into account annual trends.
A test of whether BBA affected hospital nurse staffing in all 4 years post-BBA is then
| (3) |
However, if we estimate a different pattern, such as
| (4) |
we would be unable to conclude that BBA had a significant effect on nurse staffing. More generally, if the αFPI in post-BBA years is not significantly different from the αFPI pre-BBA, then we fail to reject the null hypothesis that the BBA did not affect nurse staffing.
Furthermore, we can test whether there is a differential response to a high FPI at safety net hospitals by interacting both year and High FPI with a variable that indicates whether the hospital is a safety net hospital. Thus, the effect of the BBA on nurse staffing at safety net hospitals would be to examine whether 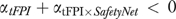 for t = 1998–2001.
There are two potential sources of bias in our approach. First, there may be nonmarket level unmeasured shocks that disproportionately affect high FPI hospitals. The existence of such shocks may bias our results upwards or downwards depending upon its nature. However, since we measure the effect relative to other hospitals in a given market, we control away most other sources of potential bias. Second, there may be selection bias in that some hospitals do not report FTEs. We believe that nonreporting bias is adequately controlled for in the hospital fixed effect, though it is possible that high-pressure hospitals are less likely to report later in the period. This would cause us to underestimate the effect of reporting. However, as we describe in more detail below, the response rate of high FPI hospitals was actually higher in the post-BBA period. Thus, we do not expect the effect of nonrandom response to be serious. Nevertheless, we include the results of an unbalanced panel in the sensitivity analysis.
Standard Errors
The data used to estimate equation (2) are panel data. Bertrand, Duflo, and Mullainathan (2004) showed that the standard errors could be underestimated (and thus the significance of the policy effect overestimated) if there is no correction for the fact that serial correlation is likely to be a problem in the data. We calculate our standard errors using a bootstrap method where we draw the entire time series of hospital observations, rather than each individual observation, during each iteration. In other words, the method takes into account the fact that the hospital has repeated observations over time.
Definition of the Safety Net
Our definition of the safety net follows Zuckerman et al. (2001). A hospital is defined as a safety net hospital if its ratio of uncompensated care costs to total hospital expenses is in the top decile nationwide. Thus, a safety net hospital is one that provides a significant amount of uncompensated care relative to its total care. In contrast to Zuckerman et al. (2001) we do not include the community-specific measure that would take into account the market share of uncompensated care in the community. We do so because we focus only on those hospitals for which changes in uncompensated care in response to change in reimbursement will have a meaningful effect on hospital finances. Thus, these hospitals have another tool at their disposal to counteract declines in reimbursement besides staffing changes.
Definition of the FPI
Following Hadley, Zuckerman, and Feder (1989), we calculate the FPI to categorize hospitals. The FPI is calculated using the following equation:
| (6) |
where MRPCi,1998 is hospital i's total Medicare revenue per Medicare-adjusted admission in 1998 and MCPCi,1997 is total Medicare costs per Medicare-adjusted admission in 1997. MADJ is Medicare-adjusted admissions, and TOTEXP is the hospital's total patient expenses. The year 1997 is chosen because this is the last full year before the implementation of BBA, and 1998 is chosen because it is the year BBA was implemented. The index is constructed to measure potential losses owing to the BBA rather than actual or realized losses.
The first term of the numerator of equation (6) is post-BBA revenue per case minus pre-BBA cost per case. This measures the profit or loss per case assuming the costs (and the operations) were at the 1997 levels. As the difference becomes larger (smaller), the better (worse) off hospitals are with regard to BBA-induced changes to Medicare revenues. The second term measures the number of Medicare-adjusted admissions, and the denominator is total hospital expenditure. If Medicare patients are a large share of the hospital's patient mix, then the ratio of these two terms will be larger. For example, consider a hospital losing money on Medicare patients: as the share of Medicare patients at the hospital increases, the hospital will be likely to experience more fiscal pressure as a result of Medicare. Similarly, if a hospital is still making money on Medicare patients after the reduction of revenues associated with the BBA, then the hospital will experience less fiscal pressure as the share of Medicare patients increases. We define high fiscal pressure hospitals as the hospitals with the highest potential losses owing to the BBA. It follows directly that these hospitals are most likely to react to the reductions associated with the BBA. In contrast, the low fiscal pressure hospitals are the hospitals with the lowest potential losses, and thus these hospitals are less likely to react to the BBA.
We adapted Hadley, Zuckerman, and Feder's FPI measure by using Medicare-adjusted admissions rather than inpatient admissions, because outpatient admissions have become a larger portion of a hospital's output mix since the early 1980s. In addition, the BBA includes provisions that affect outpatient reimbursement in addition to inpatient reimbursement. We define high FPI hospitals as those in the bottom quartile of the FPI distribution (i.e., the quartile dominated by hospitals with large negative FPIs). We compare high FPI hospitals to low FPI hospitals in our primary analysis and perform a sensitivity analysis using high FPI versus medium FPI (those hospitals in the middle two quartiles). This index enables us to measure the effect of potential losses a hospital would experience owing to the BBA on hospital staffing decisions by comparing hospitals with high versus low potential losses. This measure was most recently used by Bazzoli et al. (2004) who studied the short-term effect of the BBA on hospital operations.
A more direct measure of the effect of BBA is MRPCi,1998–MRPCi,1997. This measure does not take into account the importance of Medicare patients to a hospital and whether a hospital has room in its Medicare margins to absorb cuts in reimbursement. However, hospitals may react directly to changes in revenue per case regardless of whether their Medicare costs are greater than or less than actual reimbursement. We performed a sensitivity analysis using this measure and report the results below.
DATA
The primary data set in our analysis is the 1996–2001 AHA Annual Survey. We limit our sample to urban, short-term general hospitals that respond to the AHA survey in every year. Thus, we eliminate hospitals that do not respond to the full-time and part-time nurse staffing question in any of the years. An unbalanced sample, where hospitals responded to the nurse staffing questions in at least one year, contains 1,376 hospitals. The balanced sample consists of 854 hospitals, or about a 38 percent reduction in the number of hospitals. We report results using the balanced and unbalanced samples (Table 4).
Table 4.
Sensitivity Analysis of Nonsafety Net Hospitals: FTE RNs per Adjusted Day
| Sample | High versus Low FPI Balanced Panel (Table 2, Column 2) | High versus Low FPI Unbalanced Panel | High versus Low Change in Revenue per Case | High versus Low FPI Excludes For-Profit Hospitals | High versus Medium FPI |
|---|---|---|---|---|---|
| 1997 | 0.021 (0.048) | 0.025 (0.051) | 0.031 (0.036) | 0.001 (0.052) | −0.025 (0.026) |
| 1998 | 0.084 (0.055) | 0.058 (0.064) | 0.078* (0.041) | 0.061 (0.059) | −0.033 (0.027) |
| 1999 | 0.132** (0.059) | 0.057 (0.075) | 0.094** (0.046) | 0.102* (0.061) | −0.053 (0.034) |
| 2000 | 0.136** (0.059) | 0.152** (0.073) | 0.105** (0.045) | 0.099 (0.065) | −0.050 (0.034) |
| 2001 | 0.089 (0.058) | 0.125 (0.085) | 0.095** (0.044) | 0.029 (0.056) | −0.049 (0.033) |
| 1997 × High | −0.018 (0.070) | 0.017 (0.074) | −0.070 (0.088) | −0.005 (0.071) | 0.027 (0.054) |
| 1998 × High | −0.135* (0.072) | −0.049 (0.086) | −0.231*** (0.083) | −0.115 (0.077) | −0.028 (0.053) |
| 1999 × High | −0.194** (0.080) | −0.124 (0.093) | −0.221** (0.094) | −0.148* (0.084) | −0.018 (0.057) |
| 2000 × High | −0.192** (0.082) | −0.213** (0.093) | −0.242*** (0.088) | −0.158* (0.083) | −0.015 (0.060) |
| 2001 × High | −0.115 (0.081) | −0.101 (0.106) | −0.241** (0.100) | −0.052 (0.081) | 0.018 (0.063) |
*, **, *** indicates a p-value less than .10, .05, and .01, respectively. Block bootstrapped standard errors in parentheses, 500 repetitions.
Within market specification including hospital case-mix variables.
Hospital case mix include: Medicare case mix and share, Medicaid share, ER share, outpatient share, inpatient share, SNF share, and average LOS.
FPI, fiscal pressure index; FTE RNs, full-time equivalent registered nurses; ER, emergency room; SNF, skilled nursing facility.
Our staffing variables, which include FTE RNs and LPNs, are all measured per adjusted patient day. As described above, adjusted patients days are calculated by the AHA by summing together inpatient days and outpatient visits using revenue as weights. Thus, because the revenue per inpatient day is substantially higher than that of an outpatient visit, inpatient days are weighted more heavily. We use this measure because the AHA does not report inpatient and outpatient nurse FTEs separately. The AHA calculates the FTE based on responses in the survey for full-time and part-time personnel. If the hospital did not respond to these questions, we replaced the survey value imputed by the AHA with missing.
The vector Case mix includes the Medicare case-mix index obtained from the Centers for Medicare and Medicaid Services (CMS) and the ratios of inpatient admissions, outpatient visits, and emergency department visits to adjusted admissions. We also control for the ratios of skilled nursing facility (SNF) admissions, Medicare discharges, and Medicaid discharges to total inpatient admissions as well as average length of stay. Hospital net Medicare revenues are used in the calculation of the FPI. Medicare net revenues include all the components of Medicare reimbursement: prospective payments for inpatient discharges, Medicare payments for outpatient services, skilled nursing facility services, home health, capital costs, medical education, DSH. We supplement the AHA data with the Area Resource File variables: population density, unemployment rates, and percent of population older than age 65. These variables are calculated at the MSA level. Health maintenance organizations (HMO) penetration rates are from Interstudy in 1999 and 2000 and in 1996–1998 are calculated based on allocating managed care enrollment to counties based on the managed care service area, using approaches developed by Wholey et al. (1997). HMO market penetration rate is the number of HMO enrollees divided by the population of the market.
We estimate the model using a balanced panel of hospitals. Thus, a hospital that does not report data in any of the years is excluded from the analysis. A balanced panel makes the base case of the within market transformation stable over time. In most cases, it is reasonable to assume that fixed hospital characteristics are the reason for nonrandom response. For example, the response rate for the AHA survey tends to be significantly lower at for-profit hospitals than at nonprofit hospitals. In this case, the hospital fixed effect will control for selection bias that is owing to any characteristic (observable or unobservable) that is fixed over time. However, if nonresponse is more likely when hospitals are in acute financial distress, then response would not be correlated solely with fixed hospital characteristics, and our results would be biased. In the example above, they would be biased downward because hospitals most affected by the BBA would be excluded from our survey. Nevertheless, the difference between the proportion of hospitals that respond in every post-BBA year of high FPI hospitals (80.7 percent) and other hospitals (82.5 percent) is not significantly different from zero. However, when we include the preperiod (6 years of data total), the proportion of high FPI hospitals that respond in every year is lower than all other hospitals and the difference is statistically significant, although there is no significant difference between the high and low FPI hospitals. As a result, we present the results from the unbalanced sample as part of a sensitivity analysis.
The summary statistics are presented in Table 1. Safety net hospitals tend to have larger inpatient populations but fewer outpatient visits. Safety net hospitals have higher levels of LPN staffing, but only the low- or medium-pressure hospitals have higher levels of RN staffing. High-pressure hospitals within either safety net category tend to be smaller than the low-pressure hospitals. This difference is likely because of the fact that larger hospitals have a broader patient base and would therefore be less susceptible to changes in payment from one payer.
Table 1.
Summary Statistics, 1996–2001
| Nonsafety Net | Safety Net | ||||
|---|---|---|---|---|---|
| All Hospitals | High Pressure | Low/Medium Pressure | High Pressure | Low/Medium Pressure | |
| FTE RNs | 334.439 (333.071) | 247.773 (251.903) | 349.526 (336.598) | 214.250 (121.973) | 461.262 (442.323) |
| FTE LPNs | 38.513 (45.124) | 28.978 (33.166) | 37.666 (41.253) | 81.433 (129.222) | 65.882 (64.300) |
| Adjusted patient days | 95,695.250 (77,294.920) | 75,057.040 (65,172.010) | 99,400.830 (77,059.330) | 77,550.230 (54,049.050) | 123,379.800 (97,171.820) |
| Adjusted admissions | 17,349.450 (13,050.390) | 13,193.960 (10,314.530) | 18,341.840 (13,374.060) | 12,106.350 (5,340.899) | 21,027.960 (14,866.010) |
| Admissions | 11,100.340 (9,371.867) | 8,038.150 (7,340.524) | 11,766.620 (9,540.748) | 8,062.950 (4,249.569) | 14,251.720 (11,125.110) |
| SNF admissions | 191.928 (486.874) | 175.407 (291.345) | 206.183 (466.501) | 119.100 (193.896) | 125.056 (921.733) |
| Medicaid discharges | 1,673.916 (2,246.253) | 929.096 (1,117.573) | 1,601.168 (1,819.605) | 1,494.300 (1,107.985) | 4,388.417 (4,712.010) |
| Medicare discharges | 4,402.998 (3,535.929) | 3,538.125 (2,937.100) | 4,785.112 (3,717.561) | 3,317.317 (2,154.289) | 3,649.620 (2,994.923) |
| Outpatient visits | 134,157.300 (167,425.600) | 101,757.100 (112,732.400) | 138,809.500 (177,616.100) | 88,799.400 (67,178.150) | 190,176.800 (192,509.800) |
| ER visits | 32,762.350 (23,852.550) | 25,620.670 (18,242.640) | 33,041.670 (22,319.690) | 35,789.620 (19,587.430) | 49,646.510 (37,921.980) |
| Case-mix index | 1.410 (0.362) | 1.351 (0.253) | 1.431 (0.400) | 1.314 (0.264) | 1.413 (0.255) |
| Population density | 699.444 (1,155.998) | 496.121 (544.581) | 699.893 (1,093.646) | 442.097 (394.686) | 1,295.544 (2,265.277) |
| Unemployment rate | 4.291 (1.865) | 3.989 (1.421) | 4.341 (1.921) | 4.519 (1.410) | 4.657 (2.348) |
| Population >65 | 0.122 (0.029) | 0.122 (0.025) | 0.123 (0.030) | 0.116 (0.017) | 0.111 (0.024) |
| HMO penetration | 0.272 (0.141) | 0.260 (0.136) | 0.283 (0.141) | 0.185 (0.105) | 0.228 (0.140) |
| N | 5,124 | 1,128 | 3,528 | 60 | 408 |
| Number of hospitals | 854 | 188 | 588 | 10 | 68 |
Standard deviations are in parentheses.
FTE RNs, full-time equivalent registered nurses; FTE LPNs, full-time equivalent licensed practical nurses; SNF, skilled nursing facility; ER, emergency room; HMO, health maintenance organization.
We also examined the unconditional mean staffing ratios at safety net and nonsafety net hospitals. In 1996 and 1997, both high and low FPI nonsafety net hospitals had similar FTE RNs per day. However, the ratios diverged during the first 2 years of the BBA, 1998 and 1999, and the ratio at high FPI hospitals were substantially lower than the ratios at low FPI hospitals. Nevertheless, as of 2000, the ratios were quite similar and the similarity remained in 2001. There was a similar trend for FTE RNs at high FPI and low FPI safety net hospitals. However, the trend is much noisier for safety net hospitals owing to the fact that there are fewer observations.
In contrast to RNs, there was a downward trend in LPN ratios throughout the time period. In addition, the high-pressure hospitals started a steeper decline as early as after 1997, 1 year before the BBA went into effect. As with RNs, the trend of LPNs at safety net hospitals is very volatile. The unconditional trends suggest an incremental effect of the BBA on RN staffing ratios, but these data alone are not conclusive. In order to identify whether there is truly an incremental effect from the BBA, we need to control for changes in case mix and visit mix, as well as differences in the market environment by estimating equation (6).
RESULTS
Table 2 presents the results from the specification that compares low- and high FPI hospitals for RNs per adjusted day. Note that the results for the safety net hospitals are calculated using interactions in the same regression. The results in column 1 include market and hospital case-mix variables to control for the demand for nurses. The results in column 2 are based on a specification of the within market-time transformation which controls for all unmeasured differences between markets in each time period (equation [6]). The results in the first pair of columns are for nonsafety net hospitals and the results in the latter pair of columns include only safety net hospitals. The last five rows indicate the sum of the year coefficient and the interaction; thus, these results represent the total effect. For the safety net hospitals, this is the sum of all the year and interaction coefficients.
Table 2.
Hospital Fixed Effect Analysis of the Effect of High FPI versus Low FPI on FTE RNs per Adjusted Day
| Sample: | Nonsafety Net | Safety Net | ||
|---|---|---|---|---|
| 1997 | 0.075 (0.054) | 0.021 (0.048) | −0.143 (0.110) | 0.049 (0.111) |
| 1998 | 0.182***(0.069) | 0.084 (0.055) | −0.347*(0.178) | −0.260** (0.121) |
| 1999 | 0.213*** (0.077) | 0.132** (0.059) | −0.233 (0.160) | −0.205 (0.140) |
| 2000 | 0.117 (0.084) | 0.136** (0.059) | −0.372** (0.187) | −0.292* (0.160) |
| 2001 | 0.043 (0.084) | 0.089 (0.058) | −0.180 (0.162) | −0.139 (0.143) |
| 1997 × High | −0.086 (0.077) | −0.018 (0.070) | −0.005 (0.386) | −0.188 (0.203) |
| 1998 × High | −0.248*** (0.089) | −0.135* (0.072) | 0.546* (0.292) | 0.456 (0.299) |
| 1999 × High | −0.280*** (0.093) | −0.194** (0.080) | 0.110 (0.419) | 0.206 (0.406) |
| 2000 × High | −0.204** (0.094) | −0.192** (0.082) | 0.435 (0.351) | 0.447 (0.317) |
| 2001 × High | −0.190* (0.104) | −0.115 (0.081) | 0.214 (0.338) | 0.132 (0.361) |
| 1997+1997 × High | −0.011 (0.058) | 0.003 (0.050) | −0.159 (0.359) | −0.135 (0.151) |
| 1998+1998 × High | −0.066 (0.066) | −0.051 (0.049) | 0.133 (0.220) | 0.145 (0.271) |
| 1999+1999 × High | −0.067 (0.073) | −0.063 (0.055) | −0.190 (0.391) | −0.062 (0.380) |
| 2000+2000 × High | −0.087 (0.079) | −0.056 (0.056) | −0.024 (0.303) | 0.099 (0.265) |
| 2001+2001 × High | −0.147 (0.091) | −0.027 (0.058) | −0.113 (0.294) | −0.033 (0.320) |
| Market variables | Yes | N/A | Yes | N/A |
| Hospital case-mix variables | Yes | Yes | Yes | Yes |
| Within market | No | Yes | No | Yes |
indicates a p-value less than .10, .05, and .01, respectively. Block bootstrapped standard errors in parentheses, 500 repetitions.
Market-level variables include: HMO penetration, percentage of population over 65, population density, and unemployment rate.
Hospital case mix include: Medicare case mix and share, Medicaid share, ER share, outpatient share, inpatient share, SNF share, and average LOS.
FPI, fiscal pressure index; FTE RNs, full-time equivalent registered nurses; ER, emergency room; HMO, health maintenance organization.
The specification with the market variables (columns 1 and 3) reveals that there was a significant increase in RN staffing rations at low FPI nonsafety net hospitals. This increase was offset by a relative decrease at high FPI nonsafety net hospitals and low FPI safety net hospitals. Overall, the significant increase at low FPI hospitals was not experienced at other hospitals. However, this specification does not control for unobserved market conditions.
The results in columns 2 and 4 include the market-time fixed effects and thus control for unobserved differences in market conditions. These within market results are generally consistent with the other results, although the coefficients are smaller and less significant. We base our conclusions on the within-market results because they control for local market conditions. We find that the staffing ratios at high FPI hospital were significantly different than low FPI hospitals in 1998–2001. A coefficient of −0.20 translates into about a 6.0 percent decline in FTE RNs per patient day. The low FPI hospitals actually experienced an increase in their RN staffing ratio in 1999–2000. With the exception of 1998, there is a significant decline at safety net hospitals, although high FPI hospitals are not significantly different than low FPI hospitals.
Table 3 is identical to Table 2, except that the dependent variable is FTE LPNs per adjusted day. Here we see a consistent decline in FTE LPNs throughout the time period at nonsafety net hospitals, though the decline is only significant in 1998 and 2000. The fall in LPNs is not significant when we control for market conditions. At safety net hospitals there is no significant trend. The results largely echo the unconditional means.
Table 3.
Hospital Fixed Effect Analysis of the Effect of High FPI versus Low FPI on FTE LPNs per Adjusted Day
| Sample | Nonsafety Net | Safety Net | ||
|---|---|---|---|---|
| 1997 | −0.004 (0.016) | −0.003 (0.012) | −0.088 (0.087) | −0.133 (0.291) |
| 1998 | −0.033* (0.019) | 0.005 (0.013) | −0.059 (0.092) | −0.018 (0.064) |
| 1999 | −0.049* (0.025) | −0.002 (0.031) | −0.032 (0.098) | 0.015 (0.069) |
| 2000 | −0.054* (0.028) | 0.003 (0.018) | −0.034 (0.102) | 0.022 (0.061) |
| 2001 | −0.036 (0.034) | 0.007 (0.018) | −0.133 (0.103) | −0.007 (0.064) |
| 1997 × High | 0.025 (0.034) | 0.026 (0.030) | 1.258 (1.279) | 0.718 (0.683) |
| 1998 × High | −0.027 (0.029) | −0.024 (0.022) | 0.026 (0.138) | 0.176 (0.135) |
| 1999 × High | −0.023 (0.034) | −0.019 (0.038) | 0.828 (0.942) | 0.455 (0.515) |
| 2000 × High | −0.024 (0.035) | −0.020 (0.026) | −0.091 (0.191) | −0.018 (0.152) |
| 2001 × High | −0.038 (0.037) | −0.021 (0.024) | −0.093 (0.225) | −0.165 (0.144) |
| 1997+1997 × High | 0.021 (0.033) | 0.024 (0.027) | 1.191 (1.289) | 0.609 (0.617) |
| 1998+1998 × High | −0.059** (0.029) | −0.019 (0.017) | −0.091 (0.100) | 0.140 (0.115) |
| 1999+1999 × High | −0.072** (0.032) | −0.022 (0.019) | 0.724 (0.934) | 0.448 (0.510) |
| 2000+2000 × High | −0.078** (0.036) | −0.018 (0.019) | −0.202 (0.174) | −0.014 (0.135) |
| 2001+2001 × High | −0.074** (0.036) | −0.014 (0.018) | −0.30 (0.214) | −0.186 (0.128) |
| Market variables | Yes | N/A | Yes | N/A |
| Hospital case mix variables | Yes | Yes | Yes | Yes |
| Within market | No | Yes | No | Yes |
*, **, *** indicates a p-value less than .10, .05, and .01, respectively. Block bootstrapped standard errors in parentheses, 500 repetitions.
Market-level variables include: HMO penetration, percentage of population 65 and over, population density, and unemployment rate.
Hospital case mix include: Medicare case mix and share, Medicaid share, ER share, outpatient share, inpatient share, SNF share, and average LOS.
FPI, fiscal pressure index; FTE LPNs, full-time equivalent licensed practical nurses; ER, emergency room; SNF, skilled nursing facility; HMO, health maintenance organization.
Table 4 contains a sensitivity analysis based on different assumptions regarding the data set and the measure used to gauge fiscal pressure. All specifications are within market. Column 1 includes the results from column 2 of Table 2 for reference. Column 2 of Table 4 lists the results using an unbalanced panel. The significance of the coefficient estimates declines although the signs are about the same. Column 3 uses an alternative definition of fiscal pressure described in the Methods section above. The effect on high-pressure hospitals is larger and more significant if this measure is used. Using this measure we get an upper bound of the effect of BBA as about −6.5 percent decline in the RN staffing ratio. Column 4 has the same sample and measure as column 1, but excludes for-profit hospitals. The coefficient estimates are somewhat smaller in magnitude and less significant. Here, the effect of the BBA is about a 4 percent decline in RN staffing ratios of marginal significance. Finally, column 5 compares the high FPI hospital to the medium FPI hospitals; the latter is defined as the middle two quartiles. We find that there is not any difference between high and medium FPI hospitals. In summary, we find that the incremental effect of the BBA on RN nurse staffing ratios is between −4.0 percent and −6.5 percent at high FPI hospitals vis-á-vis low FPI hospitals.
DISCUSSION
The potential losses that a hospital could have experienced through the BBA did have a small differential effect on nurse staffing levels at nonsafety net hospitals. The effect was largely felt in the first three years of the BBA. By 2001, high FPI hospitals were generally not significantly different from low FPI hospitals. Consistent with unadjusted means, there was a slight increase in staffing ratios at low Medicare pressure hospitals. This increase was not detected at medium-pressure hospitals as we showed in column 5 of Table 4. Thus while hospitals with low Medicare pressure increased ratios during this time period, overall staffing ratios declined.
Safety net hospitals reacted differently to the potential losses of the BBA than did nonsafety net hospitals. First, there was not a statistically significant differential response at high versus low Medicare pressure safety net hospitals. This may be owing to the fact that revenues also declined at low Medicare pressure safety net hospitals due to the Medicaid or graduate medical education (GME) provisions of the BBA. Overall, the cuts in reimbursement related to Medicaid and GME were significantly smaller than the Medicare-related provisions. However, at a single hospital, the Medicaid/GME provisions alone may have been large enough to cause a response. Note that close to half of the safety net hospitals in our sample are public hospitals versus 12 percent in the nonsafety net sample. Furthermore, 22 percent of the safety net hospitals are teaching hospitals versus 12 percent in the nonsafety net sample. Unfortunately our sample is too small to definitively test whether our safety net results are due to ownership, Medicaid pressure, or teaching mission.
The BBA may have exacerbated the nursing shortage, because nurse workload increased at high and medium Medicare pressure hospitals and, thus, likely increased nurse dissatisfaction and burnout. The BBA may have resulted in slower growth of nurse wages, and existing nurses were unlikely to be compensated for the additional workload. In addition, slower growth in wages makes the field less attractive to new entrants and may have accelerated the use of temporary nurses in hospital settings. This is especially evident when we compare columns 1 and 2 in Tables 2. The effect was lower in the within-market specification, implying that market-wide trends led to lower staffing levels.
The implications of our nurse staffing results on quality are consistent with Seshamani and Volpp (2004) and Volpp et al. (2005), who found little, if any, effect of the BBA on hospital quality. We find that the BBA may have contributed to about a 4–6.5 percent decline in total nurses per adjusted patient day. Given the results of Needleman et al. (2002), Mark et al. (2004), and Aiken et al. (2002), it is unlikely that this incremental decline, in isolation, is associated with a significant effect on quality. A caveat of our study is that it is only possible to measure the incremental effect at high versus low FPI hospitals and not the total effect. The total effect is not possible to identify separately from secular trends, because the BBA did not occur in isolation of other phenomena that could have affected nurse staffing. Regardless, we can conclude that the BBA contributed to the general trends toward higher nurse workloads at hospitals reliant on Medicare reimbursement that, in the aggregate, could have deleterious effects on quality.
Acknowledgments
This study was supported by a grant from the Robert Wood Johnson Foundation's Health Care Financing and Organization Program (# 042596). Ray Kang of Health Research and Educational Trust provided valuable research assistance in the development of the data set used in this paper. We thank David Gray for comments and editorial support. Two anonymous referees and seminar participants at Columbia University and the Medical University of South Carolina provided very helpful comments. An earlier draft of this paper was presented at the AcademyHealth Annual Meetings and the International Health Economic Association Biannual Meeting.
NOTES
During the time period of our study (1996–2001), there were several reports of a nurse shortage. A study by the General Accounting Office (GAO 2001) found that RNs/100,000 population declined 2 percent from 1996 to 2000. The study documented the fact that providers had difficulty recruiting and retaining nurses. Another report noted that there were 126,000 unfilled hospital-nursing positions throughout the country (JCAHO Report 2000). Buerhaus, Staiger, and Auerbach (2000) found that the aging nurse workforce was primarily owing to a decline of young women choosing a career in nursing over the past two decades. The shortage appeared to ease slightly by 2002. Buerhaus and Staiger (2003) note that the reprieve of the nurse staffing shortage by 2002, was primarily due to an increase in RNs over age 50 and foreign-born RNs back into the labor force. While our study is in the context of a staffing shortage, we do not seek to explain why the shortage occurred. Rather, our goal is to assess whether the BBA had an incremental effect on staffing levels.
Net income (loss) is defined as net patient revenue plus total nonpatient revenue minus total operating costs and total other expenses.
Hoerger (1991, p. 287).
REFERENCES
- Aiken LH, Clarke SP, Sloane DM, Sochalski J, Silber JH. “Hospital Nurse Staffing and Patient Mortality, Nurse Burnout, and Job Dissatisfaction.”. Journal of the American Medical Association. 2002;288(16):1987–93. doi: 10.1001/jama.288.16.1987. [DOI] [PubMed] [Google Scholar]
- American Hospital Association. “The Financial Status of Hospitals. A Study Conducted by the Lewin Group for the American Hospital Association.”. [July 10, 2002];2001 Available at http://www.aha.org/grassroots/lewinreport.asp.
- Bazzoli GJ, Lindrooth RC, Hasnain-Wynia R, Needleman J. “The Balanced Budget Act of 1997 and US Hospital Operations.”. Inquiry. 2004;41:401–17. doi: 10.5034/inquiryjrnl_41.4.401. [DOI] [PubMed] [Google Scholar]
- Bertrand M, Duflo E, Mullainathan S. “How Much Should We Trust Difference-in-Differences Estimates.”. Quarterly Journal of Econometrics. 2004;119(1):249–75. [Google Scholar]
- Blegen MA, Goode CJ, Reed L. “Nurse Staffing and Patient Outcomes.”. Nursing Research. 1998;47(1):43–50. doi: 10.1097/00006199-199801000-00008. [DOI] [PubMed] [Google Scholar]
- Blegen MA, Vaughan T. “A Multi-Site Study of Nurse Staffing and Patient Occurrences.”. Nursing Economics. 1998;16(4):196–203. [PubMed] [Google Scholar]
- Buerhaus P, Staiger D. “Managed Care and the Nurse Workforce.”. Journal of the American Medical Association. 1996;276(18):1487–93. [PubMed] [Google Scholar]
- Buerhaus P, Staiger D. “Trouble in the Nurse Labor Market?”. Health Affairs. 1999;18(1):214–22. doi: 10.1377/hlthaff.18.1.214. [DOI] [PubMed] [Google Scholar]
- Buerhaus P, Staiger D. “Is the Current Shortage of Hospital Nurses Ending?”. Health Affairs. 2003;22(6):191–8. doi: 10.1377/hlthaff.22.6.191. [DOI] [PubMed] [Google Scholar]
- Buerhaus P, Staiger D, Auerbach D. “Implications of an Aging Registered Nurse Workforce.”. Journal of the American Medical Association. 2000;283(22):2948–54. doi: 10.1001/jama.283.22.2948. [DOI] [PubMed] [Google Scholar]
- Ernst & Young and HCIA-Sachs. The Financial State of Hospitals: Post-BBA and Post-BBRA. 2000. [Google Scholar]
- General Accounting Office. Nursing Workforce: Emerging Nurse Shortage Due to Multiple Factors. Washington, DC: General Accounting Office; 2001. [Google Scholar]
- Hadley J, Zuckerman S, Feder J. “Profits and Fiscal Pressure in the Prospective Payment System: Their Impacts on Hospitals.”. Inquiry. 1989;26(3):354–65. [PubMed] [Google Scholar]
- Heiber-White J. “Medicare Reforms Cut Hospital Payments, Add PSO Option.”. Health Progress. 1997;78(6):10–6. [PubMed] [Google Scholar]
- Hoerger TJ. “‘Profit’ Variability in for-Profit and Not-for-Profit Hospitals.”. Journal of Health Economics. 1991;10(3):259–89. doi: 10.1016/0167-6296(91)90030-q. [DOI] [PubMed] [Google Scholar]
- JCAHO. Health at the Crossroads: Strategies for Addressing the Evolving Nursing Crisis. Chicago: JCAHO; 2000. [Google Scholar]
- Kovner C, Gergen PJ. “Nurse Staffing Levels and Adverse Events Following Surgery in US Hospitals.”. Image—Journal of Nursing Scholarship. 1998;30(4):315–21. [PubMed] [Google Scholar]
- Kovner C, Jones C, Zhan C, Gergen PJ, Basu J. “Nurse Staffing and Postsurgical Adverse Events: An Analysis of Administrative Data from a Sample of U.S. Hospitals, 1990–1996.”. Health Services Research. 2002;37(3):611–29. doi: 10.1111/1475-6773.00040. [DOI] [PMC free article] [PubMed] [Google Scholar]
- Lichtig LK, Knauf RA, Miholland DK. “Some Impacts of Nursing on Acute Care Hospital Outcomes.”. Journal of Nursing Administration. 1999;29(2):25–33. doi: 10.1097/00005110-199902000-00008. [DOI] [PubMed] [Google Scholar]
- Manheim LM, Feinglass J, Shortell SM, Hughes EFX. “Regional Variation in Medicare Hospital Mortality.”. Inquiry. 1992;29(1):55–66. [PubMed] [Google Scholar]
- Mark BA, Harless DW, McCue M, Xu Y. “A Longitudinal Examination of Hospital Registered Nurse Staffing and Quality of Care.”. Health Services Research. 2004;39(2):279–300. doi: 10.1111/j.1475-6773.2004.00228.x. [DOI] [PMC free article] [PubMed] [Google Scholar]
- McCloskey JM. “Nurse Staffing and Patient Outcomes.”. Nursing Outlook. 1998;46(5):199–200. doi: 10.1016/s0029-6554(98)90047-1. [DOI] [PubMed] [Google Scholar]
- Needleman J, Buerhaus P, Mattke S, Stewart M, Zelevinsky K. “Nurse-Staffing Levels and Quality of Care in Hospitals.”. New England Journal of Medicine. 2002;346(22):1715–22. doi: 10.1056/NEJMsa012247. [DOI] [PubMed] [Google Scholar]
- Pronovost P, Dorman T, Jenckes M, Garret E, Breslow M, Rosenfield B, Lipsett P, Bass E. “Organizational Characteristics of Intensive Care Units Related to Outcomes of Abdominal Aortic Surgery.”. Journal of the American Medical Association. 1999;281(14):1310–7. doi: 10.1001/jama.281.14.1310. [DOI] [PubMed] [Google Scholar]
- Schultz MA, van Servellen G, Litwin MS, McLaughlin EJ, Uman GC. “Can Hospital Structural and Financial Characteristics Explain Variations in Mortality Caused by Acute Myocardial Infarction?”. Applied Nursing Research. 1999;12(4):210–4. doi: 10.1016/s0897-1897(99)80285-7. [DOI] [PubMed] [Google Scholar]
- Seshamani M, Volpp K. University of Pennsylvania; 2004. “The Effect of the Medicare Balanced Budget Act on Mortality for 4 Conditions.”. Working Paper. [Google Scholar]
- Silber JH, Rosenbaum PR. “Measuring Quality of Hospital Care.”. Journal of the American Medical Association. 1995;273(1):21–2. doi: 10.1001/jama.273.1.21b. [DOI] [PubMed] [Google Scholar]
- Spetz J. “The Effects of Managed Care and Prospective Payment on the Demand for Hospital Nurses: Evidence from California.”. Health Services Research. 1999;34(5):993–1010. [PMC free article] [PubMed] [Google Scholar]
- Taunton RL, Kleinbeck SV, Stafford R, Woods CQ, Bott MJ. “Patient Outcomes: Are They Linked to Registered Nurse Absenteeism, Separation, or Work Load?”. Journal of Nursing Administration. 1994;24(4 suppl):48–55. [PubMed] [Google Scholar]
- van Servellen G, Schultz MA. “Demystifying the Influence of Hospital Characteristics on Inpatient Mortality Rates.”. Journal of Nursing Administration. 1999;29(4):39–47. doi: 10.1097/00005110-199904000-00012. [DOI] [PubMed] [Google Scholar]
- Volpp K, Konetzka RT, Zhu J, Parsons L, Peterson E. “Effects of Cuts in Medicare Reimbursement on Process and Outcomes of Care for Acute Myocardial Infarction Patients.”. Circulation. 2005;112(15):2268–75. doi: 10.1161/CIRCULATIONAHA.105.534164. [DOI] [PubMed] [Google Scholar]
- Wholey DR, Christianson JB, Engberg J, Bryce C. “HMO Market Structure and Performance: 1985–1995.”. Health Affairs. 1997;16(6):75–84. doi: 10.1377/hlthaff.16.6.75. [DOI] [PubMed] [Google Scholar]
- Zuckerman S, Bazzoli GJ, Davidoff A, LoSasso A. “How Did Safety-Net Hospitals Cope in the 1990s?”. Health Affairs. 2001;20(4):159–68. doi: 10.1377/hlthaff.20.4.159. [DOI] [PubMed] [Google Scholar]