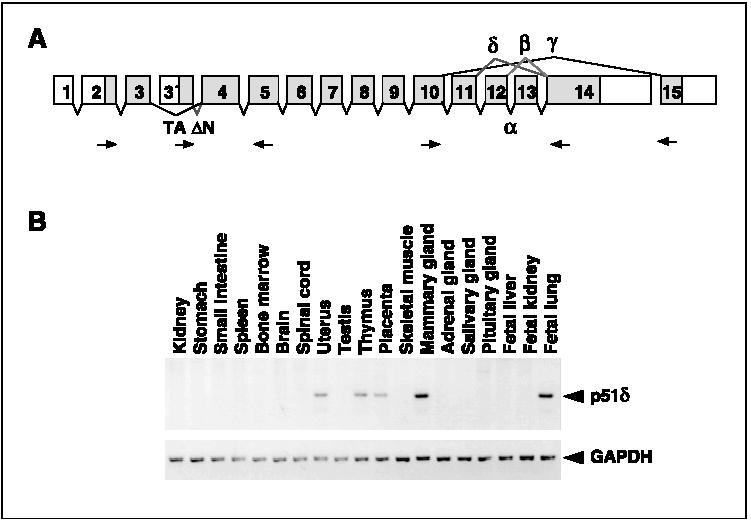
Figure 4.

(A) Schematic representation of the isotypes of p51 transcripts. The positions of primers for RT-PCR analysis are indicated by arrows. (B) Tissue distribution of the p51δ isotype. Expression of the δ isotype in normal human tissues analyzed by RT-PCR is also shown.
