

Abstract
Objectives. We studied trends of hypertensive disorders of pregnancy by residential socioeconomic status (SES) and racial/ethnic subgroups in New York State over a 10-year period.
Methods. We merged New York State discharge data for 2.5 million women hospitalized with delivery from 1993 through 2002 with 2000 US Census data.
Results. Rates of diagnoses for all hypertensive disorders combined and for preeclampsia individually were highest among Black women across all regions and neighborhood poverty levels. Although hospitalization rates for preeclampsia decreased over time for most groups, differences in rates between White and Black women increased over the 10-year period. The proportion of women living in poor areas remained relatively constant over the same period. Black and Hispanic women were more likely than White women to have a form of diabetes and were at higher risk of preeclampsia; preeclampsia rates were higher in these groups both with and without diabetes than in corresponding groups of White women.
Conclusions. An increasing trend of racial/ethnic disparity in maternal hypertension rates occurred in New York State during the past decade. This trend was persistent after stratification according to SES and other risk factors. Additional research is needed to understand the factors contributing to this growing disparity.
Hypertensive diseases of pregnancy are serious maternal morbidities, occurring in 6%–8% of all pregnancies.1–3 Gestational hypertension and preeclampsia are risk factors for other forms of maternal morbidities (as well as neonatal morbidity and mortality), making these diseases of reproductive-aged women a particularly important public health problem.1,2,4,5 Women with gestational hypertension risk progression to severe hypertension, preeclampsia, or eclampsia.6,7 Women with preeclampsia are predisposed to convulsions, abruptio placentae, disseminated intravascular coagulation, cerebral hemorrhage, pulmonary edema, renal failure, and liver hemorrhage.2,5,8 Hypertensive disorders in pregnancy are also known to be associated with an increased risk of developing hypertension and stroke later in life.9 The risks posed by preeclampsia to the fetus include severe growth retardation, hypoxemia, acidosis, premature birth, and death.1,6 The many risk factors for hypertensive disorders of pregnancy include nulliparity; multifetal gestation; Black race; extremes of reproductive age; obesity; family history of preeclampsia or eclampsia; preeclampsia in a previous pregnancy; presence of diabetes, thrombophilias, essential hypertension, or renal disease1,8,10–22; and other contextual factors (e.g., residential poverty).20–22
Few population-based studies of maternal morbidities exist. Recent studies have provided insight into risks of pregnancy-induced hypertensive disorders, but large subsets of the population were excluded in evaluations of socioeconomic status (SES), body mass index (BMI), gestational diabetes, or maternal health as cofactors.10,21,23,24
We investigated the associations between contextual socioeconomic variables and hypertensive disorders at the time of labor and delivery for a large state population over a 10-year period. Having 10 years of discharge data for New York State (NYS) gave us the opportunity to study the relation between maternal morbidity—specifically hypertension—and factors related to residential poverty and race/ethnicity. We separated New York City (NYC) from the rest of NYS for all analyses, because these regions differ in terms of racial/ethnic structure, population density, economics, geographic characteristics, and health care delivery systems. This study provides insight into how SES and race/ethnicity may each contribute to the risk for hypertension.
METHODS
Data Sources
The NYS hospital discharge database, Statewide Planning and Research Cooperative System (SPARCS), was formed in 1979 for the purpose of monitoring and fiscally managing inpatient and ambulatory hospitalization services in NYS.25 The statistical variables we chose for this study included International Classification of Disease, Ninth Revision, Clinical Modification (ICD-9-CM )26 codes for up to 8 discharge diagnoses (or 15 diagnoses if the patient was discharged in 1994 or later), demographic information (e.g., race, ethnicity, age), type of medical insurance, and zip code of residence.
From the US Census Bureau we obtained 2000 US Census data at the Zip code tabulation area– (ZCTA) level from Summary File 3.27 ZCTAs are geographic units meant to approximate the boundaries of postal zip codes and comprise groups of census blocks.
Cases
Between 1993 and 2002, 3 120 329 acute care hospital discharges in NYS had a pregnancy-related diagnostic, procedure, or diagnostic-related grouping ICD-9-CM code.25 We selected records with codes for a delivery, excluding 417279 hospitalizations of pregnant women for reasons other than delivery.
We excluded hospitalizations if we could not obtain residential information because the woman resided outside NYS (n = 50 892) or was incarcerated (n = 2145), the zip code was changed or removed by the post office during the study period (n = 5020) or was otherwise unmatched with 2000 US Census data (n = 1385), or no poverty information was available for the zip code (n = 131). We also excluded hospitalizations if the woman was younger than 15 or older than 54, or if age was missing (n = 34 673). Finally, we excluded those hospitalizations where the woman had a pregnancy terminated by miscarriage or spontaneous or induced abortion (n = 29 467), had a diagnosis of HIV or AIDS (n = 8242), or had a diagnosis of both type 1 and type 2 diabetes (n = 26). The final study sample consisted of 2 571 069 (95% of total records with codes for a delivery) hospitalizations with delivery.
We assessed 5 hypertensive outcomes: essential hypertension (preexisting hypertension), gestational hypertension, preeclampsia, severe preeclampsia and eclampsia, and preeclampsia or eclampsia superimposed on preexisting hypertension. Severe preeclampsia and eclampsia had similar risk distributions and were combined into 1 group to stabilize estimates. Case definitions for hypertension were based on the ICD-9-CM codes recorded as discharge diagnoses: essential hypertension (642.0, 642.1, 642.2, 642.9, 401), gestational hypertension (642.3), preeclampsia (642.4), severe preeclampsia and eclampsia (642.5, 642.6), and preeclampsia or eclampsia superimposed on preexisting hypertension (642.7).
When multiple diagnoses for preeclampsia, severe preeclampsia, or eclampsia were listed, we categorized the hospitalization as the most severe form recorded. For other combinations of hypertension, we counted the hospitalization in each applicable category.
Race/Ethnicity and Residential Poverty
Hospital discharge records contained information on the patient’s race and ethnicity (i.e., Hispanic or non-Hispanic). If Hispanic ethnicity was identified, it was maintained as the race/ethnicity of the patient. If a patient was identified as non-Hispanic, her race was categorized as non-Hispanic Black (Black), non-Hispanic White (White), or non-Hispanic other race (other).
Neighborhood poverty level was measured as the percentage of residents within each ZCTA living below the federal poverty line. This exposure was initially categorized into 6 groups: <2.5%, 2.5%–4.99%, 5%–9.99%, 10%–14.99%, 15%–19.99%, and ≥ 20% (i.e., federally defined poverty area).28,29 Because of the small number of hypertensive hospitalizations in some subsets of race/ethnicity and neighborhood poverty, these 6 categories were condensed into 3 groups for the analyses: < 10%, 10%–19.99%, and ≥ 20%.29 Bias assessment identified no substantive residual confounding.
Potential Confounders and Effect Modifiers
Diabetes, considered a likely effect modifier, was categorized into 4 groups: type 1 diabetes, type 2 diabetes, gestational diabetes, and no diabetes. We further investigated the combination of gestational and type 2 diabetes, because diabetes diagnosed during pregnancy is often thought to be type 2 diabetes that is identified through prenatal testing.30 Definitions for diabetes were based on ICD-9-CM codes as follows: type 1 diabetes (250, 250.0, 250.1, 250.2, 250.3, 250.4, 250.5, 250.6, 250.7, 250.8, 250.9, 250.01, 250.03, 250.11, 250.13, 250.21, 250.23, 250.31, 250.33, 250.41, 250.43, 250.51, 250.53, 250.61, 250.63, 250.71, 250.73, 250.81, 250.83, 250.91, 250.93), type 2 diabetes (250.00, 250.02, 250.10, 250.12, 250.20, 250.22, 250.30, 250.32, 250.40, 250.42, 250.50, 250.52, 250.60, 250.62, 250.70, 250.72, 250.80, 250.82, 250.90, 250.92), and gestational diabetes (648.8).
We obtained information about each patient’s age and type of medical insurance from hospital discharge records. Age was categorized into 5 groups: 15 to 17, 18 to 19, 20 to 34, 35 to 44, and 45 to 54. Medicaid status was defined as being insured by Medicaid or enrolled in a Medicaid health maintenance organization. Because having no health insurance usually indicates both low income and delayed application to Medicaid for pregnant women,31 we combined women whose discharge records indicated self-pay as the method of payment (< 5%) with women whose services were covered by Medicaid for our analyses.
Finally, we stratified all analyses in the study by the geographic region of residence as indicated by the county of residence on the hospital discharge record. NYC included the city’s 5 counties: Bronx, Kings (Brooklyn), New York (Manhattan), Queens, and Richmond (Staten Island). NYS included all other counties grouped together.
Data Management and Statistical Analysis
We conducted all data management and statistical analyses using SAS software version 8.2 (SAS Institute Inc, Cary, NC). We linked hospitalization record zip code data with US Census ZCTA data. We calculated hospitalization rates for each of the 5 hypertension outcomes by combinations of race/ethnicity and residential poverty level and by diabetes and demographic factors. We assessed the 10-year trends of hospitalization rates with hypertensive disorders overall and separately for combinations of age group, region, racial/ethnic group, and diabetes status. We conducted stratified analyses for rates of hospitalizations with delivery by diabetes status, region, racial/ethnic group, age group, and residential poverty level. We calculated rate ratios for combinations of exposure factors and effect modifiers using both stratified analysis and logistic regression. Hereafter, the term “rate” refers to number of events per 100 hospitalizations with delivery unless otherwise stated.
RESULTS
The rates of gestational hypertension, preeclampsia, and eclampsia were highest in both the youngest (15 to 17) and the oldest (45 to 54) women, whereas increased age was positively associated with the rate of essential hypertension (Table 1 ▶). Women with a diagnosis of diabetes (gestational, type 1, or type 2) had increased rates of diagnoses for all forms of hypertension studied compared with those without diabetes diagnoses. Women with a diagnosis of type 1 diabetes were most likely to have diagnoses of all forms of hypertension except essential hypertension (Table 1 ▶).
TABLE 1—
Rates of Hypertensive Disorders During Pregnancy: New York State, 1993–2002
| N | Essential Hypertension | Gestational Hypertension | Preeclampsia | Preeclampsia Superimposed on Pre-Existing Hypertension | Severe Preeclampsia and Eclampsia | Total | |
| Incidence | 2 571 069 | 1.2 | 1.5 | 2.4 | 0.3 | 0.8 | 6.1 |
| Age, y | |||||||
| 15–17 | 80 550 | 0.6 | 1.8 | 4.3 | 0.2 | 1.3 | 7.9 |
| 18–19 | 143 128 | 0.6 | 1.6 | 3.5 | 0.2 | 1.1 | 6.6 |
| 20–34 | 1 915 272 | 1.0 | 1.5 | 2.2 | 0.3 | 0.8 | 5.6 |
| 35–44 | 427 932 | 2.4 | 1.8 | 2.4 | 0.7 | 1.0 | 7.9 |
| 45–54 | 4187 | 5.6 | 3.1 | 5.0 | 2.0 | 2.1 | 17.2 |
| Race/ethnicity | |||||||
| White | 1 297 460 | 1.1 | 1.8 | 2.0 | 0.2 | 0.7 | 5.5 |
| Other | 512 653 | 1.1 | 1.2 | 2.3 | 0.3 | 0.9 | 5.5 |
| Hispanic | 310 858 | 0.9 | 1.2 | 3.0 | 0.3 | 1.0 | 6.2 |
| Black | 450 098 | 2.1 | 1.5 | 3.3 | 0.7 | 1.2 | 8.5 |
| Location | |||||||
| NYC | 1 206 454 | 1.3 | 1.1 | 2.8 | 0.4 | 0.9 | 6.3 |
| NYS | 1 364 615 | 1.2 | 2.0 | 2.0 | 0.2 | 0.8 | 6.0 |
| Medicaid recipient | |||||||
| No | 1 054 022 | 1.2 | 1.8 | 2.0 | 0.3 | 0.8 | 5.9 |
| Yes | 1 517 047 | 1.2 | 1.4 | 2.6 | 0.3 | 0.9 | 6.3 |
| Percentage below poverty in residential zip code | |||||||
| 0–9.99 | 981 708 | 1.1 | 1.8 | 2.0 | 0.2 | 0.7 | 5.6 |
| 10–19.99 | 778 799 | 1.2 | 1.6 | 2.4 | 0.3 | 0.8 | 6.2 |
| ≥ 20 | 810 562 | 1.3 | 1.2 | 2.9 | 0.4 | 1.0 | 6.6 |
| Diabetes status | |||||||
| No diabetes | 2 458 303 | 1.1 | 1.5 | 2.3 | 0.3 | 0.8 | 5.8 |
| Gestational diabetes | 102 485 | 3.8 | 3.1 | 4.1 | 0.9 | 1.2 | 12.7 |
| Type 2 diabetes | 3509 | 9.6 | 2.7 | 5.4 | 2.7 | 2.1 | 21.2 |
| Gestational and/or type 2 diabetes | 105 994 | 4.0 | 3.1 | 4.2 | 0.9 | 1.3 | 13.0 |
| Type 1 diabetes | 6772 | 8.1 | 3.5 | 7.9 | 2.6 | 3.6 | 24.5 |
Note. NYC = New York City; NYS = New York State, excluding NYC. “Rate” refers to the number of events per 100 hospitalizations with delivery.
Analyses assessing associations between race/ethnicity and residential poverty with hypertension hospitalization showed similar results for preeclampsia and for all hypertension combined. For simplicity and clarity, we have chosen to present results focused on preeclampsia rates and will state when results varied for other hypertensive diagnoses.
Among nondiabetics, differences in preeclampsia rates by race/ethnicity were pronounced in NYC, with higher rates among Black women (3.2) and Hispanic women (2.9) than among White women (1.8), regardless of neighborhood poverty level (Figure 1a ▶). Only among Hispanic women did a clear association exist between neighborhood poverty level and preeclampsia rates; in residential areas with poverty < 10%, 10%–19.99%, and ≥ 20%, the preeclampsia rates were 2.5, 2.8, and 3.0, respectively. Outside NYC, smaller differences in preeclampsia rates by race/ethnicity occurred across all residential poverty levels. The association between residential poverty and preeclampsia rates among Hispanic women was not evident (Figure 1b ▶); however, small sample sizes limited precision.
FIGURE 1—
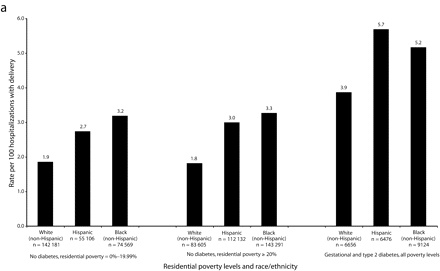
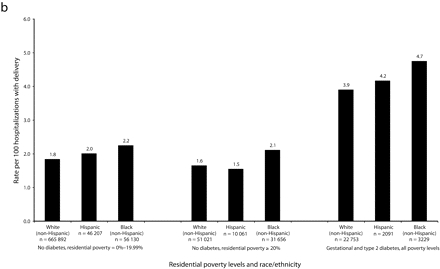
Rates of preeclampsia for women aged 20–34 years, by race/ethnicity, residential poverty, and diabetes status, in New York City (a) and New York State excluding New York City (b): 1993–2002.
Note. Similar patterns were seen in other age groups. Rates of diabetics per 100 hospitalizations with delivery in New York City were: Whites = 2.9; Hispanics = 3.9; Blacks = 4.2. Rates of diabetics per 100 hospitalizations with delivery in New York State excluding New York City were: Whites = 3.2; Hispanics = 3.7; Blacks = 3.7.
Black and Hispanic women who lived outside NYC resided largely in urban counties (87% of hospitalizations with delivery for Black women and 91% for Hispanic women), whereas White women lived in both urban (61%) and rural (39%) areas. The rates for preeclampsia among women residing in urban cities outside NYC (1.9 for White women, 2.4 for Black women, and 1.8 for Hispanic women) were similar to those among women in less densely populated areas outside NYC (1.9, 2.4, and 1.8, respectively, in suburban areas, and 2.2, 2.1, and 2.1, respectively, in rural areas). These preeclampsia rates were lower than the preeclampsia rates in NYC for all groups except White women.
Not only were the rates of preeclampsia among Black women substantially higher than the rates among White women across all urban areas of NYS, but the racial disparity increased over the decade. For the years 1993 through 1996, the average difference in preeclampsia rates in NYC for nondiabetics aged 20–34 was 1.2; the rate for Black women was 3.2, whereas the rate for White women was 2.0. For 1999 through 2002, the average difference increased to 1.7; the rate for Black women was 3.4, whereas the rate for White women was 1.7 (Figure 2a ▶). Smaller but substantial differences between hypertension rates of Hispanic and White women were identified over time in NYC.
FIGURE 2—
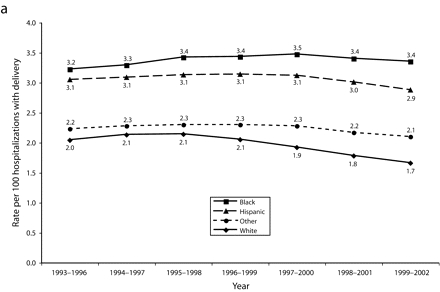
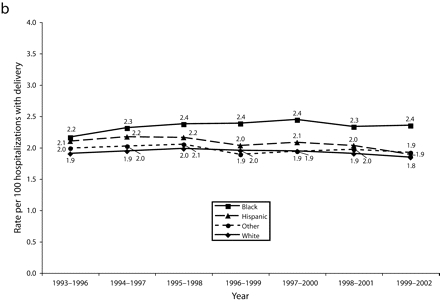
Rolling average rates of preeclampsia by race/ethnicity among nondiabetic women aged 20–34 years, New York City (a) and New York State excluding New York City (b): 1993–2002.
Similar trends occurred in the rest of NYS, though the disparities were less dramatic. Outside NYC, preeclampsia rates for Hispanic women decreased to the level for White women outside NYC by the end of the decade (Figure 2b ▶). These patterns were also seen when all hypertensive disorders were combined and when diabetics were evaluated (data not shown). We assessed trends of hypertension rates in large hospitals to determine if the observed racial disparities were because of a change in diagnostic pattern; no change in diagnostic pattern was evident (data not shown).
Diagnoses of diabetes were more common among Black and Hispanic women than among White women across NYS, putting these 2 groups at higher risk of preeclampsia. Among hospitalizations with diagnoses of diabetes in NYC, Hispanic women had a notably higher rate of preeclampsia, followed by Black women, then White women (Figure 1a ▶). In the rest of NYS, the differences in preeclampsia rates among diabetics by race/ethnicity were smaller (Figure 1b ▶).
Application of a multivariate logistic regression model similar to those previously reported21,24 showed that the model poorly fit NYS data. Thus, we used stratified analyses for calculation of rates and rate ratios of preeclampsia. The relation between race/ethnicity and preeclampsia occurred in diabetics as well as nondiabetics in NYC, although small numbers limited interpretation (data not shown).
DISCUSSION
We found increasing racial disparities in maternal hypertension rates over the past decade in NYS. This finding was strengthened when further analyses focused specifically on preeclampsia hospitalizations among nondiabetic women aged 20 to 34 to remove potential confounding associated with age, diabetes status, and mixed forms of hypertension. Not only did higher rates of preeclampsia exist among Black women hospitalized with delivery than among White women, but this difference appeared to be increasing. Over the same time period, the rate of hospitalization with delivery for women living in poor areas remained relatively constant within racial/ethnic groups and geographic regions (data not shown); this partially removes changes in SES as a cause of the increasing disparity.
Preeclampsia rates were much higher in NYC than in the rest of NYS for Black and Hispanic women, but not for White women. Our study could not fully explain the greater racial/ethnic disparities in rates of preeclampsia and all hypertensions combined in NYC by the maternal characteristics we studied.
One possible explanation may be that disparities across social gradients are greater in major urban areas.32,33 Our assessment of the association between preeclampsia rates in urban areas outside NYC showed relatively similar rates in rural and urban regions. No clear trends among Black and Hispanic women across rural areas could be assessed because of the small population sizes outside cities. Evaluation of differences in diagnostic rates for the largest hospitals in each region ruled out a second possible explanation: variations in diagnosis and recording procedures.
A third potential reason for the differences between NYC and the rest of NYS is differences in the cost of living. The cost of living in NYC is more than 50% greater than it is upstate34; it may be that in NYC we identified predominately minority residential areas with substantially lower poverty levels than areas in the remainder of the state. Percentage below the federal poverty level is considered a strong measure of residential SES in population-based research.35 However, because federal poverty computations are not adjusted for cost of living, the effect of poverty level on hypertension rates may vary by region. Although longitudinal findings within NYC and outside NYC likely are reasonable, comparisons of NYC with the rest of NYS without cost-of-living adjustments should be performed cautiously.
Preeclampsia rates among Hispanic women are somewhat complex, potentially because of the distribution of Puerto Rican and other Hispanic women living across NYS, because a disproportionate number reside in NYC compared with NYS; regional variation of lifestyles; environmental factors; or other factors. In NYC, Hispanic women had preeclampsia rates approaching those of Black women among nondiabetics and exceeding those of both White and Black women among diabetics. This finding held regardless of poverty level. In the rest of NYS, Hispanic women had preeclampsia rates similar to those of White women. In national studies, Hispanic women have been found to have higher rates of obesity, insulin resistance, gestational diabetes, and type 2 diabetes compared with White women.36,37 Additionally, Hispanic women appear to be more susceptible than Black women to gestational diabetes with both increasing maternal age and increasing BMI.38 Hispanic women also have shown faster progression from the first manifestation of gestational hypertension to preeclampsia compared with White women.7,39 Additional studies that focus on the experiences of Hispanic women are needed.
Hospitalization for delivery with a diagnosis of diabetes was more common among Black and Hispanic women than among White women. Associations between gestational diabetes and hypertension in pregnancy seen in this study have been previously identified in both population-based10,21,23,24 and clinical1,40 studies. When we controlled for age and residential poverty, gestational diabetes approximately doubled the risk of preeclampsia across racial/ethnic groups. This finding was similar to some previous studies10,21,23 but different from a population-based study conducted among Washington State residents with driver’s licenses, which found that gestational diabetes increased the risk of preeclampsia among Black women more substantially than among White women.24 Important differences in study designs, including sample selection and available information on confounders, make it difficult to directly compare the results.
Maternal obesity has been treated as a confounder in several studies of gestational diabetes and preeclampsia.10,23,24,41 Although our study does not have a measure of BMI, we do not consider this a substantial limitation. We contend that obesity and diabetes are both partially on the causal pathway and may operate as effect modifiers between poverty and race/ethnicity–related experiences (e.g., racism) and pregnancy-related hypertension.
Among nondiabetics and particularly in NYC, we saw an increase over time in the disparity between Black and White women in rates of preeclampsia and overall hypertension. Reviewing the potential causes for these trends, we suggest that obesity may be partially related. Although the etiology of preeclampsia is not clearly established,2 clinical studies suggest that increased insulin resistance, more common among the obese, may be a mechanism for increased risk of preeclampsia and hypertension among nondiabetics.42–47 Obesity was found to be an independent risk factor for preeclampsia in several studies that controlled for diabetes.48–51 The prevalence of obesity in the United States in 2000 was higher among Black women (49.7%) than among White women (30.1%) or Hispanic women (39.7%).52 Trends in obesity over the past decade have shown a larger percentage increase from 1988 to 2000 among Black women (11.5%) than among White women (4.4%) or Hispanic women (7.2%).52
To support our assertion that obesity was increasing in NYS, we reviewed data from the Pregnancy Risk Assessment Monitoring System (PRAMS) for NYS excluding NYC.53 The proportion of prepregnancy obesity (BMI>29 kg/m2) was higher in Black women (19%) than White women (11%) in the period from 1993 to 1994. The racial disparity in prepregnancy obesity became greater by the period 2000 through 2002 in NYS (obese Blacks=25%; obese Whites=14%; New York State Department of Health, written communication, February 2005). Recent research suggests that contextual factors, such as the distribution of fast-food establishments, may contribute to differences in obesity by race/ethnicity.54
Differences in entry into prenatal care may partially explain the racial differences in hypertension seen in this study. Although more than 95% of women had insurance by the time of delivery, data from PRAMS suggest they may not have had this coverage early in pregnancy, an important distinction seen in other US studies.31,53,55 For women living in NYS excluding NYC, 88.4% of White women reported receiving prenatal care initially in the first trimester, whereas only 74.8% of Black women and 69.3% of Hispanic women did so (New York State Department of Health, written communication, February 2005). Given that 76.6% of hospitalizations with delivery in NYC were covered by Medicaid or were self-paid, as opposed to 43.5% outside NYC, it may be that lack of early prenatal care was greater in the city. With early identification, gestational hypertension may be managed to reduce the risk of preeclampsia and eclampsia.
Limitations
Several caveats are noteworthy. This study lacks individual-level risk factors not contained in the hospital discharge database. Second, misclassification of race/ethnicity on hospital records is likely. However, this misclassification probably created a bias toward the null value; thus, the true relations are likely larger than presented. Third, validation studies of pregnancy-related hypertension are limited;6 it is likely that some misclassification occurred. Because of the seriousness of preeclampsia, it is unlikely that underdiagnosis and underrecording are substantial. Study of the validity of hypertension recorded in discharge databases is needed. Fourth, we did not consider births that occurred outside hospitals. In 2002, the percentages of births outside hospitals in NYS were 0.8%, 0.7%, and 0.5% for Whites, Blacks, and Hispanics, respectively, suggesting minimal effect on the estimates presented.56 Fifth, we excluded hospital records with pregnancy loss or spontaneous or induced abortion (0.9%). Sixth, incorporation of Medicaid insurance status did not substantively improve insight based on the analyses presented. Because pregnant women with an income of less than 200% of the federal poverty level qualify for Medicaid in NYS, this dichotomous poverty measure obscures the true gradient of poverty. Our study partially overcame this problem by implementing a gradient based on the percentage of a zip code’s population with income lower than the poverty level.35
Earlier research noted methodological issues related to using zip codes to approximate neighborhood SES.57 Discrepancies of boundaries between patients’ zip codes in hospital data and ZCTAs in the US Census may lead to bias in determining the residential poverty levels for some areas. Also, there is a potential misclassification of poverty level within zip code areas, because neighborhood poverty levels are not necessarily homogeneous within them.58 These limitations likely lead to a bias toward the null.
Conclusions
Our study complements previous population studies of hypertension in pregnancy by including about 99% of deliveries in NYS. Using more than 2.5 million records over a decade created stable results in most instances and allowed us to assess associations between race/ethnicity, poverty, and pregnancy-related hypertension simultaneously. Understanding the growing trends in racial disparities seen in this study is worthy of further investigation.
Acknowledgments
This study was a result of a class project. No funding was sought or received.
Human Participant Protection We analyzed a secondary data set without key identifiers available to the general public.
Peer Reviewed
Contributors M. Tanaka, G. Jaamaa, M. Kaiser, E. Hills, A. Soim, M. Zhu, and I. Y. Shcherbatykh completed the analyses. R. Samelson provided clinical advice in the area of maternal health. E. Bell and L.-A. McNutt supervised all aspects of this study and its implementation. M. Zdeb provided technical assistance with data preparation. All authors helped to conceptualize ideas and interpret findings, contributed to writing, and reviewed drafts of the article.
References
- 1.ACOG technical bulletin. Hypertension in pregnancy. Number 219–January 1996 (replaces no. 91, February 1986). Committee on Technical Bulletins of the American College of Obstetricians and Gynecologists. Int J Gynaecol Obstet. 1996;53(2):175–183. [PubMed] [Google Scholar]
- 2.Report of the National High Blood Pressure Education Program Working Group on High Blood Pressure in Pregnancy. Am J Obstet Gynecol. 2000;183: S1–S22. [PubMed] [Google Scholar]
- 3.Samadi AR, Mayberry RM, Zaidi AA, Pleasant JC, McGhee N Jr, Rice RJ. Maternal hypertension and associated pregnancy complications among African-American and other women in the United States. Obstet Gynecol. 1996;87:557–563. [DOI] [PubMed] [Google Scholar]
- 4.Peters RM, Flack JM. Hypertensive disorders of pregnancy. J Obstet Gynecol Neonatal Nurs. 2004;33: 209–220. [DOI] [PubMed] [Google Scholar]
- 5.Sibai BM. Treatment of hypertension in pregnant women. N Engl J Med. 1996;335:257–265. [DOI] [PubMed] [Google Scholar]
- 6.Saudan P, Brown MA, Buddle ML, Jones M. Does gestational hypertension become preeclampsia? Br J Obstet Gynaecol. 1998;105:1177–1184. [DOI] [PubMed] [Google Scholar]
- 7.Barton CB, Barton JR, O’Brien JM, Bergauer NK, Sibai BM. Mild gestational hypertension: differences in ethnicity are associated with altered outcomes in women who undergo outpatient treatment. Am J Obstet Gynecol. 2002;186:896–898. [DOI] [PubMed] [Google Scholar]
- 8.Sibai BM. Diagnosis and management of gestational hypertension and preeclampsia. Obstet Gynecol. 2003;102:181–192. [DOI] [PubMed] [Google Scholar]
- 9.Wilson BJ, Watson MS, Prescott GJ, et al. Hypertensive diseases of pregnancy and risk of hypertension and stroke in later life: results from cohort study. BMJ. 2003;326:845. [DOI] [PMC free article] [PubMed] [Google Scholar]
- 10.Ostlund I, Haglund B, Hanson U. Gestational diabetes and preeclampsia. Eur J Obstet Gynecol Reprod Biol. 2004;113:12–16. [DOI] [PubMed] [Google Scholar]
- 11.Campbell DM, MacGillivray I. Preeclampsia in twin pregnancies: incidence and outcome. Hypertens Pregnancy. 1999;18:197–207. [DOI] [PubMed] [Google Scholar]
- 12.Sibai BM, Hauth J, Caritis S, et al. Hypertensive disorders in twin versus singleton gestations. National Institute of Child Health and Human Development Network of Maternal-Fetal Medicine Units. Am J Obstet Gynecol. 2000;182:938–942. [DOI] [PubMed] [Google Scholar]
- 13.Dekker GA, de Vries JI, Doelitzsch PM, et al. Underlying disorders associated with severe early-onset preeclampsia. Am J Obstet Gynecol. 1995;173: 1042–1048. [DOI] [PubMed] [Google Scholar]
- 14.Dizon-Townson DS, Nelson LM, Easton K, Ward K. The factor V Leiden mutation may predispose women to severe preeclampsia. Am J Obstet Gynecol. 1996; 175(4 pt 1):902–905. [DOI] [PubMed] [Google Scholar]
- 15.Kupferminc MJ, Eldor A, Steinman N, et al. Increased frequency of genetic thrombophilia in women with complications of pregnancy [published correction appears in N Engl J Med. 1999;341:384]. N Engl J Med. 1999;340:9–13. [DOI] [PubMed] [Google Scholar]
- 16.Powers RW, Minich LA, Lykins DL, Ness RB, Crombleholme WR, Roberts JM. Methylenetetrahydrofolate reductase polymorphism, folate, and susceptibility to preeclampsia. J Soc Gynecol Investig. 1999;6: 74–79. [DOI] [PubMed] [Google Scholar]
- 17.O’Shaughnessy KM, Fu B, Ferraro F, Lewis I, Downing S, Morris NH. Factor V Leiden and thermolabile methylenetetrahydrofolate reductase gene variants in an East Anglian preeclampsia cohort. Hypertension. 1999;33:1338–1341. [DOI] [PubMed] [Google Scholar]
- 18.Sibai BM. Thrombophilias and adverse outcomes of pregnancy—what should a clinician do? N Engl J Med. 1999;340:50–52. [DOI] [PubMed] [Google Scholar]
- 19.Yogev Y, Xenakis EM, Langer O. The association between preeclampsia and the severity of gestational diabetes: the impact of glycemic control. Am J Obstet Gynecol. 2004;191:1655–1660. [DOI] [PubMed] [Google Scholar]
- 20.Rosenberg TJ, Garbers S, Chavkin W, Chiasson MA. Prepregnancy weight and adverse perinatal outcomes in an ethnically diverse population. Obstet Gynecol. 2003;102(5 pt 1):1022–1027. [DOI] [PubMed] [Google Scholar]
- 21.Conde-Agudelo A, Belizan JM. Risk factors for preeclampsia in a large cohort of Latin American and Caribbean women. BJOG. 2000;107:75–83. [DOI] [PubMed] [Google Scholar]
- 22.Steinfeld JD, Valentine S, Lerer T, Ingardia CJ, Wax JR, Curry SL. Obesity-related complications of pregnancy vary by race. J Matern Fetal Med. 2000;9: 238–241. [DOI] [PubMed] [Google Scholar]
- 23.Ros HS, Cnattingius S, Lipworth L. Comparison of risk factors for preeclampsia and gestational hypertension in a population-based cohort study. Am J Epidemiol. 1998;147:1062–1070. [DOI] [PubMed] [Google Scholar]
- 24.Bryson CL, Ioannou GN, Rulyak SJ, Critchlow C. Association between gestational diabetes and pregnancy-induced hypertension. Am J Epidemiol. 2003; 158:1148–1153. [DOI] [PubMed] [Google Scholar]
- 25.New York State Department of Health. Statewide Planning and Research Cooperative System (SPARCS) Web site. Available at: http://www.health.state.ny.us/statistics/sparcs. Accessed September 25, 2006.
- 26.International Classification of Diseases, Ninth Revision, Clinical Modification. Hyattsville, Md: National Center for Health Statistics; 1980. DHHS publication PHS 80-1260.
- 27.Census 2000 Summary File 3 (SF 3) Technical Documentation. Washington, DC: US Census Bureau; 2002.
- 28.Krieger N, Chen JT, Waterman PD, Rehkopf DH, Subramanian SV. Race/ethnicity, gender, and monitoring socioeconomic gradients in health: a comparison of area-based socioeconomic measures—the Public Health Disparities Geocoding Project. Am J Public Health. 2003; 93:1655–1671. [DOI] [PMC free article] [PubMed] [Google Scholar]
- 29.US Census Bureau. How the Census Bureau measures poverty (official measure). Available at: http://www.census.gov/hhes/www/poverty/povdef.html. Accessed September 25, 2006.
- 30.Ben-Haroush A, Yogev Y, Hod M. Epidemiology of gestational diabetes mellitus and its association with type 2 diabetes. Diabet Med. 2004;21:103–113. [DOI] [PubMed] [Google Scholar]
- 31.Perloff JD, Jaffee KD. Late entry into prenatal care: the neighborhood context. Soc Work. 1999;44: 116–128. [DOI] [PubMed] [Google Scholar]
- 32.Luo ZC, Kierans WJ, Wilkins R, Liston RM, Mohamed J, Kramer MS; British Columbia Vital Statistics Agency. Disparities in birth outcomes by neighborhood income: temporal trends in rural and urban areas, British Columbia. Epidemiology. 2004;15:679–686. [DOI] [PubMed] [Google Scholar]
- 33.O’Campo P, Xue X, Wang MC, Caughy M. Neighborhood risk factors for low birthweight in Baltimore: a multilevel analysis. Am J Public Health. 1997;87: 1113–1118. [DOI] [PMC free article] [PubMed] [Google Scholar]
- 34.National Association of Realtors. The salary calculator. Available at: http://www.homefair.com/homefair/calc/salcalc.html. Accessed September 25, 2006.
- 35.Krieger N, Williams DR, Moss NE. Measuring social class in US public health research: concepts, methodologies, and guidelines. Annu Rev Public Health. 1997;18:341–378. [DOI] [PubMed] [Google Scholar]
- 36.Buchanan TA, Xiang AH, Peters RK, et al. Preservation of pancreatic β-cell function and prevention of type 2 diabetes by pharmacological treatment of insulin resistance in high-risk Hispanic women. Diabetes. 2002;51:2796–2803. [DOI] [PubMed] [Google Scholar]
- 37.Solomon CG, Willett WC, Carey VJ, et al. A prospective study of pregravid determinants of gestational diabetes mellitus. JAMA. 1997;278:1078–1083. [PubMed] [Google Scholar]
- 38.Kieffer EC, Carman WJ, Gillespie BW, Nolan GH, Worley SE, Guzman JR. Obesity and gestational diabetes among African-American women and Latinas in Detroit: implications for disparities in women’s health. J Am Med Womens Assoc. 2001;56:181–187, 196. [PubMed] [Google Scholar]
- 39.Wolf M, Shah A, Jimenez-Kimble R, Sauk J, Ecker JL, Thadhani R. Differential risk of hypertensive disorders of pregnancy among Hispanic women. J Am Soc Nephrol. 2004;15:1330–1338. [DOI] [PubMed] [Google Scholar]
- 40.ACOG Committee on Practice Bulletins—Obstetrics. ACOG practice bulletin. Diagnosis and management of preeclampsia and eclampsia. Number 33, January 2002. Obstet Gynecol. 2002;99:159–167. [DOI] [PubMed] [Google Scholar]
- 41.Wolf M, Kettyle E, Sandler L, Ecker JL, Roberts J, Thadhani R. Obesity and preeclampsia: the potential role of inflammation. Obstet Gynecol. 2001;98(5 pt 1): 757–762. [DOI] [PubMed] [Google Scholar]
- 42.Kaaja R, Laivuori H, Laakso M, Tikkanen MJ, Ylikorkala O. Evidence of a state of increased insulin resistance in preeclampsia. Metabolism. 1999;48: 892–896. [DOI] [PubMed] [Google Scholar]
- 43.Innes KE, Wimsatt JH. Pregnancy-induced hypertension and insulin resistance: evidence for a connection. Acta Obstet Gynecol Scand. 1999;78:263–284. [PubMed] [Google Scholar]
- 44.Fuh MM, Yin CS, Pei D, et al. Resistance to insulin-mediated glucose uptake and hyperinsulinemia in women who had preeclampsia during pregnancy. Am J Hypertens. 1995;8:768–771. [DOI] [PubMed] [Google Scholar]
- 45.Lorentzen B, Birkeland KI, Endresen MJ, Henriksen T. Glucose intolerance in women with preeclampsia. Acta Obstet Gynecol Scand. 1998;77: 22–27. [PubMed] [Google Scholar]
- 46.Seely EW, Solomon CG. Insulin resistance and its potential role in pregnancy-induced hypertension. J Clin Endocrinol Metab. 2003;88:2393–2398. [DOI] [PubMed] [Google Scholar]
- 47.Wolf M, Sandler L, Munoz K, Hsu K, Ecker JL, Thadhani R. First trimester insulin resistance and subsequent preeclampsia: a prospective study. J Clin Endocrinol Metab. 2002;87:1563–1568. [DOI] [PubMed] [Google Scholar]
- 48.Knuist M, Bonsel GJ, Zondervan HA, Treffers PE. Risk factors for preeclampsia in nulliparous women in distinct ethnic groups: a prospective cohort study. Obstet Gynecol. 1998;92:174–178. [DOI] [PubMed] [Google Scholar]
- 49.Bowers D, Cohen WR. Obesity and related pregnancy complications in an inner-city clinic. J Perinatol. 1999;19:216–219. [DOI] [PubMed] [Google Scholar]
- 50.Sibai BM, Ewell M, Levine RJ, et al. Risk factors associated with preeclampsia in healthy nulliparous women. The Calcium for Preeclampsia Prevention (CPEP) Study Group. Am J Obstet Gynecol. 1997;177: 1003–1010. [DOI] [PubMed] [Google Scholar]
- 51.Thadhani R, Stampfer MJ, Hunter DJ, Manson JE, Solomon CG, Curhan GC. High body mass index and hypercholesterolemia: risk of hypertensive disorders of pregnancy. Obstet Gynecol. 1999;94:543–550. [DOI] [PubMed] [Google Scholar]
- 52.Flegal KM, Carroll MD, Ogden CL, Johnson CL. Prevalence and trends in obesity among US adults, 1999–2000. JAMA. 2002;288:1723–1727. [DOI] [PubMed] [Google Scholar]
- 53.Centers for Disease Control and Prevention. Pregnancy Risk Assessment Monitoring System (PRAMS) Web site. Available at: http://www.cdc.gov/PRAMS/index.htm. Accessed September 25, 2006.
- 54.Block JP, Scribner RA, DeSalvo KB. Fast food, race/ethnicity, and income: a geographic analysis. Am J Prev Med. 2004;27:211–217. [DOI] [PubMed] [Google Scholar]
- 55.Bacak SJ, Callaghan WM, Dietz PM, Crouse C. Pregnancy-associated hospitalizations in the United States, 1999–2000. Am J Obstet Gynecol. 2005;192: 592–597. [DOI] [PubMed] [Google Scholar]
- 56.New York State Department of Health Department. Vital statistics—2002 annual report. Table 4: resident live birth summary by race/ethnicity, New York State—2002. Available at: http://www.health.state.ny.us/nysdoh/vital_statistics/2002/table04.htm. Accessed September 25, 2006.
- 57.Pickett KE, Ahern JE, Selvin S, Abrams B. Neighborhood socioeconomic status, maternal race and pre-term delivery: a case–control study. Ann Epidemiol. 2002;12:410–418. [DOI] [PubMed] [Google Scholar]
- 58.Krieger N, Waterman P, Chen JT, Soobader MJ, Subramanian SV, Carson R. Zip code caveat: bias due to spatiotemporal mismatches between zip codes and US census-defined geographic areas—the Public Health Disparities Geocoding Project. Am J Public Health. 2002; 92:1100–1102. [DOI] [PMC free article] [PubMed] [Google Scholar]