Abstract
It has been suggested that insertions and deletions (indels) have contributed to the sequence divergence between the human and chimpanzee genomes more than do nucleotide changes (3% vs. 1.2%). However, although there have been studies of large indels between the two genomes, no systematic analysis of small indels (i.e., indels ≤ 100 bp) has been published. In this study, we first estimated that the false-positive rate of small indels inferred from human–chimpanzee pairwise sequence alignments is quite high, suggesting that the chimpanzee genome draft is not sufficiently accurate for our purpose. We have therefore inferred only human-specific indels using multiple sequence alignments of mammalian genomes. We identified >840,000 “small” indels, which affect >7000 UCSC-annotated human genes (>11,000 transcripts). These indels, however, amount to only ∼0.21% sequence change in the human lineage for the regions compared, whereas in pseudogenes indels contribute to a sequence divergence of 1.40%, suggesting that most of the indels that occurred in genic regions have been eliminated. Functional analysis reveals that the genes whose coding exons have been affected by human-specific indels are enriched in transcription and translation regulatory activities but are underrepresented in catalytic and transporter activities, cellular and physiological processes, and extracellular region/matrix. This functional bias suggests that human-specific indels might have contributed to human unique traits by causing changes at the RNA and protein level.
The recent publication of the chimpanzee genome draft (The Chimpanzee Genome Sequencing and Analysis Consortium [TCGSAC] 2005) has brought unprecedented opportunities for investigating the genetic basis of the morphological and behavior differences between human and chimpanzee, human’s closest relative. Three molecular mechanisms have been proposed to explain human-specific traits: amino acid substitutions, exon deletions, and substitutions in regulatory regions (Li and Saunders 2005). The TCGSAC draft confirmed the previously estimated ∼1.2% Homo–Pan divergence due to nucleotide substitution (Chen and Li 2001; Ebersberger et al. 2002; Clark et al. 2003; Frazer et al. 2003; Watanabe et al. 2004). The nucleotide substitutions in coding exons result in an average of two amino acid substitutions, one per lineage, between Homo–Pan orthologous genes. Although recent studies (Clark et al. 2003; Nielsen et al. 2005) suggested that certain functional categories of genes show evidence of positive selection in the human lineage, the implicated genes did not appear to be directly related to human unique traits. Moreover, the relationship between promoter region divergence and expression divergence between human and chimpanzee remains unclear (Heissig et al. 2005), although there is substantial expression divergence between the two species (Marvanova et al. 2003; Khaitovich et al. 2005).
To have a better understanding of the genetic differences between human and chimpanzee, analysis of insertion/deletion (indel) events is needed. In a comparison between the high-quality sequences of chimpanzee chromosome 22 and human chromosome 21, Watanabe et al. (2004) identified as many as 68,000 indels, suggesting that indels have occurred frequently in hominoid evolution. Furthermore, TCGSAC (2005) identified ∼5 million indels between human and chimpanzee, which resulted in ∼3% sequence divergence. However, this analysis included gapped chimpanzee genomic sequences, which might have overestimated the number and total length of indels. Further confounding the problem was that the BLASTZ alignments used in the analysis contained numerous potentially spurious indels. Although some studies have analyzed transposable element-mediated indels (Han et al. 2005; van de Lagemaat et al. 2005) or indels >12 kb (Newman et al. 2005) between human and chimpanzee, genome-wide studies of small indels (i.e., indels ≤100 bp) have rarely been conducted. A recent study indicated that a human indel occurs at the frequency of one indel per 7.2 kb (Mills et al. 2006). It will be interesting to compare such polymorphism with interspecies indel differences. In addition, comparison of the human and chimpanzee genomes cannot distinguish between insertions and deletions because the ancestral status cannot be inferred in a pairwise analysis. Inclusion of outgroup species is needed for this purpose.
In this study, we first found that indels cannot be accurately inferred from the chimpanzee genome draft when we compared the indels found using the draft chimpanzee chromosome 22 and the human chromosome 21 sequences with those found using the well-annotated chimpanzee chromosome 22 sequences and the human chromosome 21 sequences. For this reason, we inferred only human-specific indel events (HS indels) using the UCSC multiple sequence alignments of human, chimpanzee, mouse, rat, and dog genomic sequences. Furthermore, we determined the genomic locations of the identified HS indels (i.e., 5′ untranslated region [UTR], coding sequence [CDS], intron, 3′ UTR, and intergenic region) and we used the Gene Ontogeny database to infer the likely function of the genes affected by indels.
Results and Discussion
Low reliability of indels inferred from the chimpanzee genome draft
We inferred >4 million potential indels from the 2.3-Gb UCSC human–chimpanzee alignments. These indels would cause 2.23% sequence divergence between the two species (see Methods). However, ∼4% of the UCSC sequences where indels are found on chimpanzee chromosome 22 draft sequences have no significant matches when BLASTed against the well-curated chimpanzee chromosome 22 sequences (Watanabe et al. 2004). This situation accounts for 2619 of the 62,000 potential indels we found on the UCSC chimpanzee chromosome 22. Approximately 27% and 13% of these “uncertain” indels are located near the centromere and the telomere of the UCSC version of chimpanzee chromosome 22. In addition, 9362 of the 62,000 potential indels mentioned above were found to be false positives; i.e., the sequence segment could be found in the RIKEN sequence, but the indel could not be found. Thus, an upper bound of the false-positive rate would be (9362 + 2619)/62,000 = 19.3% and a lower bound would be 9362/(62,000 − 2,619) = 15.8% when the 2619 “uncertain” indels were excluded from the comparison. It is difficult to estimate a false-negative rate because the UCSC chimpanzee chromosome 22 sequence is incomplete, being 9% shorter than the RIKEN sequence.
We found that >96% of the false positives were one or two bases in length. In fact, 22.9% of 1- or 2-bp indels turned out to be false positives. The false positives might have resulted from sequencing or annotational errors in the UCSC (NCBI) version or from intraspecies polymorphism.
The total number of indel events that we identified from the UCSC chimpanzee/human alignments was 9% smaller than that in Watanabe et al.’s (2004) report. The difference might be due to the following reasons. First, the length of the UCSC chimpanzee chromosome 22 was 9% shorter than that of the RIKEN sequences (i.e., 30.3 Mb vs. 33.3 Mb). Second, the alignment programs used were different (i.e., BLASTZ for UCSC vs. BLAST2 for the International Chimpanzee Chromosome 22 Consortium). Different alignment tools might give rise to different results when computing the number of indels. Third, in our analysis, many indels were revoked and replaced by substitution events through a realignment process. Finally, some suspicious alignments were filtered out in our analysis. At any rate, it is important to note that our stringent criteria tend to give an underestimate of the indel rate between the human and chimpanzee genomes.
Inferring HS indels
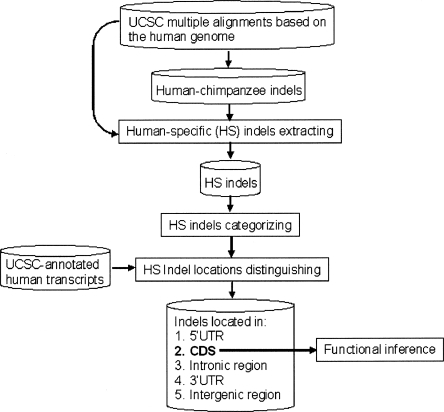
To reduce potential errors in Homo–Pan pairwise alignments, we inferred only HS indels using the human–chimpanzee–mouse–rat–dog multiple sequence alignments (see Methods; Fig. 1). Support (evidence) from nonprimate genomic sequences should considerably increase the accuracy of the identified HS indels. Since the supporting sequences come from different species, we further divided the identified indels into three main categories and six subcategories as follows:
Figure 1.
The analysis procedure flowchart.
Category 1: with evidence from both rodent and dog
Category 1-1: simultaneously supported by dog, mouse, and rat sequences
Category 1-2: supported by dog and mouse but no rat sequences in the alignment
Category 1-3: supported by dog and rat but no mouse sequences in the alignment
Category 2: with evidence from rodent only (lack of dog alignments)
Category 2-1: supported by both mouse and rat sequences
Category 2-2: supported by mouse but no rat sequence in the alignment
Category 2-3: supported by rat but no mouse sequence in the alignment
Category 3: with evidence from dog sequences only (lack of rodent alignments)
Then, using the UCSC-provided human “known genes” (http://hgdownload.cse.ucsc.edu/goldenPath/hg17/database/), we determined the genomic locations of the identified HS indels (i.e., 5′ UTR, CDS, intron, 3′ UTR, and intergenic region). Finally, we used the GO database (Gene Ontology Consortium 2001) to infer the function of the genes that have HS indels located in CDS. The analysis procedure is given in Figure 1.
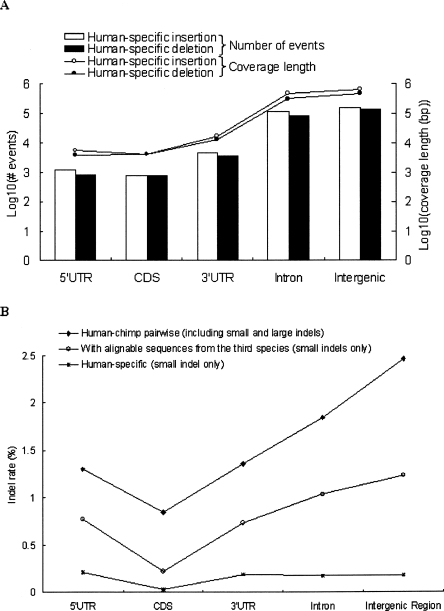
We identified a total of 844,552 HS indel events. These events contribute to only 0.21% sequence divergence (in terms of indel rate, defined in Methods) to the human lineage in the multiple sequence alignments. Even though our analysis tends to underestimate the indel rate, this low divergence suggests that most HS indels have been eliminated during evolution. The lengths and occurrences of HS indels are shown in Figure 2A. We note that the HS indels are identified from continuous sequences in all compared species. Therefore, in our results the number of the HS insertions is somewhat larger than that of the HS deletions. The observation is consistent with that previously reported (TCGSAC 2005). It is believed that the occurrence of the chimpanzee insertions (i.e., potential human-specific deletions) is an underestimate because of the small contig size (TCGSAC 2005). Figure 2A also reveals that the numbers of intergenic and intronic indels are more than one log-scale larger than that of 3′UTR indels, which in turn is 0.5 log-scale larger than those of CDS and 5′UTR indels. A similar trend is also observed for indel length. It is noteworthy that CDS and 5′UTRs have similar numbers of indels. Since the 5′UTR sequences analyzed in this study are conserved through more than three mammalian species, they may have important regulatory functions and be subject to strong selection pressure. Moreover, it is obvious that 3′UTRs are subject to much stronger selective constraint against indels than are introns. Therefore, functional analysis of the 5′UTRs and 3′UTRs indels identified in this study may give hints to human unique regulatory changes. For comparison, Figure 2B shows the indel rates inferred from three different conditions: (1) indels retrieved from human–chimpanzee pairwise comparison (see Methods); (2) indels retrieved from multiple sequence alignments; and (3) HS indels. For the first type of indels, our results clearly show that intergenic regions have the highest indel rate, followed by introns and UTRs and, lastly, by CDSs. Basically, the trend reflects different levels of selection pressures in different genomic regions. In comparison, the last two types of indels are underestimated in both introns and intergenic regions because these two regions are underrepresented in multiple species alignments. Particularly, the HS indel rates in introns and intergenic regions are close to those in UTRs, suggesting that a very large proportion of nonexonic indels are uncertain or nonhuman-specific (see Methods). However, CDSs always have the lowest indel rates among different genomic regions, which is not surprising because CDSs are known to be under strong selection pressure. Our results are consistent with those of a recent study (Lunter et al. 2006). Furthermore, Lunter et al. (2006) suggested that a considerable proportion of functional noncoding sequences are also under selection pressure against indels. Therefore, the introns and intergenic regions with relatively low HS indel rates (Fig. 2B) may have important biological functions.
Figure 2.
(A) Distributions of lengths and occurrences of human specific (HS) indels in different genomic regions. (B) Indel rate distributions of three kinds of indels: (1) indels retrieved from human–chimpanzee pairwise comparison, (2) indels retrieved from multiple sequence alignments (sequences from human, chimpanzee, and at least one species of mouse, rat, and dog), and (3) HS indels in different genomic regions. Note that category 3 indels are not considered here.
Among the six categories, category 1-1 (316,788 events) is regarded as the most reliable because the human specificity is supported by sequences from all the other four species. Moreover, categories 1-2, 2-1, and 2-2 (52,795, 49,248, and 23,816 events, respectively) are also reliable because they are supported by high-quality mouse genomic sequences and also by sequences from another species. Together, these categories consist of 442,647 events, which constitute ∼52% of the HS indel events we identified. Note that categories 1-2 and 2-1 include HS indels that are supported by all but one of the four nonhuman mammals. In the case of category 1-2, chimpanzee, mouse, and dog sequences all support that the indels are specific to human. However, the orthologous sequences in rat are missing, possibly due to incomplete sequencing or due to loss of sequence segments. The latter scenario implies that the rat has lost the orthologous sequences that are present in chimpanzee, mouse, and dog, or in other words, rat-specific indel events and/or many multiple substitutions might have occurred. Therefore, species specificity may apply not only to human but also to rat, dog, and both rat and dog for category 1-2, 2-1, and 2-2 indels, respectively. Similar comments may also apply to categories 1-3, 2-3 and category 3 indels (38,838, 19,219, and 343,848 events, respectively), although with less confidence.
Genes affected by HS indels
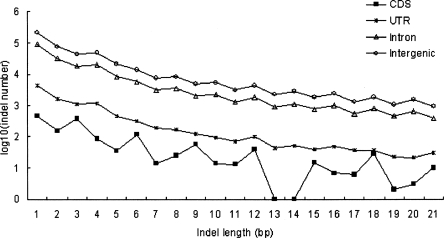
The numbers of HS indels that occur in UTRs, CDSs, introns, and intergenic regions are shown in Table 1. In general, indels occur most frequently in intergenic regions, followed in order by introns and exons. For exonic regions, 3′UTRs have far larger numbers (1.5∼5.8 times) of indels than both 5′UTRs and CDSs, whereas the differences between the latter two types of regions are less significant, particularly for category 1 indels. Interestingly, the numbers of intergenic indels are approximately twice those of intronic indels for all three categories. In contrast, the numbers of intronic indels are >10 times larger than exonic indels. Note that we are discussing indels of ≤100 bp, which constitute only a very small part of intergenic indels in terms of length (TCGSAC 2005). Also note that the indels are extracted from multiple sequence alignments, in which intergenic sequences and introns are underrepresented due to high rates of mutations and sequence gain/loss events. Nevertheless, we find that the average lengths of exonic, intronic, and intergenic indels are 4.04, 3.86, and 3.86 bp, respectively. The difference between exonic and nonexonic indel lengths is significant (P < 0.01, by the two-tailed independent sample t-test). The major reason for this difference seems to be that the frequencies of 3n-bp indels (n is an integer) are conspicuously higher than those of 3n − 1 and 3n + 1 bp indels in CDSs (Fig. 3). Figure 3 clearly shows that the indel length distributions are generally consistent with the trend that longer indel events occur less frequently than do shorter ones except for HS indels in CDSs. The reason for a high frequency of 3n-bp CDS indels is probably that CDS indels are constrained for preservation of reading frame.
Table 1.
Human-specific indels in different regions of the human genome
The numbers in the parentheses indicate the numbers of human genes/transcripts affected by these indel events.
Figure 3.
Length distributions of human-specific (HS) indels (categories 1 and 2) in coding and noncoding regions.
In addition, Table 1 also includes the numbers of genes and transcripts affected by human-specific genic indels. Exonic indels affect 6383, 791, and 1318 genes (10,163, 1056, and 1685 transcripts) for categories 1, 2, and 3, respectively. Collectively, these indels affect 37.7% (7605 of 20,158) of UCSC-annotated human genes. Note that CDS indels affect only 6.4% (1291 of 20,158) of annotated human genes. In comparison, intronic indels affect 12,991, 7610, and 11,075 genes (26,134, 15,559, and 22,309 transcripts) for categories 1, 2, and 3, respectively. Together, intronic indels affect 14,513 genes with 28,976 transcripts, which constitute 72.0% of annotated human genes. Note that a large portion of these transcripts/genes occurs in more than one category, implying that intronic indels have occurred repetitively in different mammalian lineages during evolution. Another interesting observation is that the transcript-to-gene ratios of intronic indels are almost identical across categories (2.01, 2.04, and 2.01 for categories 1, 2, and 3, respectively). The ∼2 ratios are higher than the genome-wide average (1.54) (International Human Genome Sequencing Consortium 2004), indicating that HS indels in conserved introns tend to occur in alternatively spliced genes. Therefore, such indels may have important impacts on the regulation of alternative splicing, and possibly alternative splicing-related biological activities. Furthermore, intronic indels have higher transcript-to-gene ratios than do exonic indels (1.59, 1.34, and 1.28 for category 1, 2, and 3, respectively). This is understandable since exonic indels can very likely disrupt normal biological functions and be selected against.
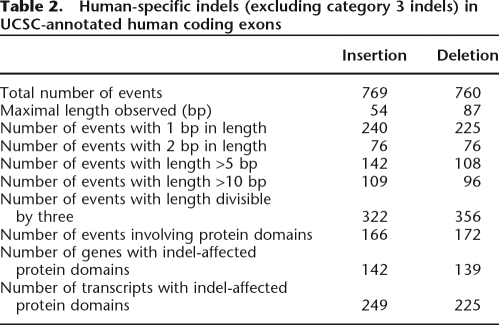
The numbers of human-specific CDS insertions and deletions of different lengths are shown in Table 2. Since indels may disrupt the reading frame of the affected transcripts, it is expected that the lengths of most indels are multiples of three. In fact, the lengths of 42% (322/769) CDS insertions and 47% (356/760) deletions are divisible by three. Both ratios are significantly higher than expected by chance (both P < 0.001, by the Fisher’s exact test). We are aware that many indel lengths are not precise because of potential errors in the chimpanzee sequences. To alleviate this problem, the highly accurate mouse sequences are used as reference to infer the length of such indels and the percentage of 3n-bp indels rises to 66%. However, this percentage may still be an underestimate because a substantial fraction of the errors cannot be so corrected. In addition, we find that 338 HS indels (166 insertions and 172 deletions) overlap with protein domains in 281 genes (or 474 transcripts). The structural and functional implications of these indels are worth further exploration.
Table 2.
Human-specific indels (excluding category 3 indels) in UCSC-annotated human coding exons
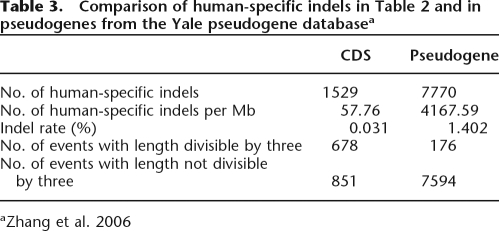
Table 3 compares the numbers of HS indels that occur in pseudogenes and UCSC-annotated CDSs. The indel frequencies (57.76 vs. 4167.59 per Mb) and indel rates (0.031% vs. 1.402%) are significantly different between CDS and pseudogenes. Moreover, only a small fraction (∼2%) of pseudogene-affecting indels is divisible by three, whereas a large portion (∼44%) of CDS-affecting indels is in multiples of three in terms of length. The difference is highly significant (P-value ≈ 0 by the two-tailed Fisher’s exact test). Note that the observation that a very low proportion of pseudogene-affecting indels are 3n bp in length is different from the previous analysis of Zhang and Gerstein (2003). However, the two studies use different data sets and methods for inferring indels. First, Zhang and Gerstein’s analysis was limited to human ribosomal protein pseudogene sequences, whereas ours has no such limitation. Second, the indels in their study were retrieved from comparisons of the pseudogene versus the present-day functional gene in the same species, whereas ours are identified from multiple species comparisons. Third, our analysis focuses only on HS indels, which are only a subset of all indel events. Note also that this 44% estimate may be an underestimate because the lengths of HS indels are affected by the accuracy of the corresponding chimpanzee sequences. Nevertheless, our results indicate that a substantial number of the indels that occurred in human CDSs after the Homo–Pan divergence might have caused a frame shift and rendered the affected genes nonfunctional. We also show that younger pseudogenes tend to have more HS indels with 3n bp in length than do older ones (see Supplemental Fig. 1).
Table 3.
Comparison of human-specific indels in Table 2 and in pseudogenes from the Yale pseudogene databasea
Enrichment in genes associated with transcriptional or translational regulation
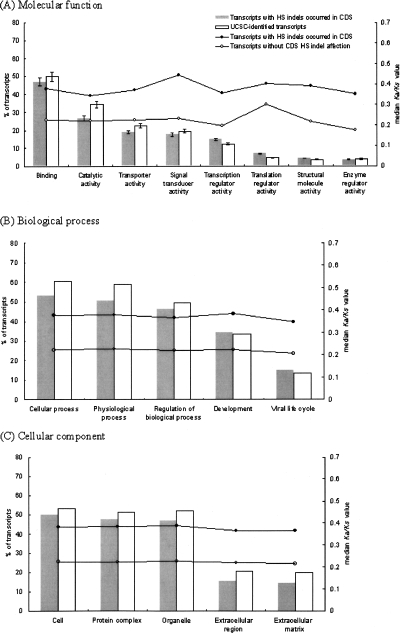
Figure 4 shows the GO classifications (Gene Ontology Consortium 2001) of CDS indel-affected transcripts. For molecular function (Fig. 4A), indel-affected transcripts are significantly more enriched than the genome-wide average in transcription regulatory activity and translation regulatory activity, while underrepresented in catalytic activity and transporter activity (all P-values < 0.01, by the two-tailed Fisher’s exact test; same for the following statistical tests in this paragraph). Our results seem to imply that HS indels have contributed to divergences at the RNA and protein levels between human and chimpanzee. In contrast, regulations of basic metabolism and molecule transportation appear to be under relatively strong selective pressure, resulting in lower frequencies of HS indels in genes associated with these activities (Supplemental Table 1). For biological process (Fig. 4B), HS indels are underrepresented in cellular process (P-value < 10−8) and physiological process (P-value < 10−10). In light of the essentiality of these processes, it is not surprising that HS indels tend not to occur in these subcategories. For cellular component (Fig. 4C), HS indels are underrepresented in extracellular region (P-value < 10−5) and extracellular matrix (P-value < 10−7). Since extracellular region/matrix is critical to cell proliferation and differentiation, HS indels may disrupt regulation of cell development and be selected against. Another intriguing observation is that HS indels are enriched in genes related to virus infection, including genes associated with latent virus infection, regulation of viral life cycle, and viral infectious cycle (all P-value < 0.05) in biological process (Supplemental Table 1). HS indels are also enriched in viral interaction complex, viral replication complex, and viral transcriptional complex (all P-value < 0.001) in cellular component. This observation appears to be compatible with the current understanding that human and chimpanzee respond differently to virus infections, such as human immunodeficiency virus (HIV) and hepatitis B/C virus. In short, our results suggest that human-specific traits may be associated with indel-related transcriptional and translational changes. Exploring functional implications of these indels may be fruitful for understanding human evolution.
Figure 4.
Gene ontology analysis of transcripts in which coding exons were affected by human-specific (HS) indels. The error bars indicate 95% confidence interval. The curves display comparisons of median Ka/Ks values for transcripts affected by CDS-HS indel(s) and transcripts without CDS-HS indel for each GO subcategory.
In addition, we compute the Ka/Ks (the nonsynonymous substitution rate to the synonymous substitution rate) ratios between human–chimpanzee orthologous coding regions using the yn00 program of the PAML package (Yang 1997; Yang and Nielsen 2000; Lindblad-Toh et al. 2005). According to the GO classifications, Figure 4 includes comparisons of median Ka/Ks values for CDS-HS-indel–affected transcripts and those for non-CDS-HS-indel–affected transcripts. Our results show that the median Ka/Ks values for the former are 33%∼100% larger than those for the latter. The differences in Ka/Ks values between these two types of transcripts are all significant (all P-values < 0.01, by the two-tailed Mann-Whitney test). Therefore, our observation suggests that the CDS-HS-indel–affected transcripts tend to be under more relaxed selection pressure than the other transcripts. The HS indel events may accelerate protein-level changes in evolution.
Methods
Extracting indels from human–chimpanzee pairwise alignments
The chimpanzee/human genomic sequence alignments downloaded from the UCSC Genome Browser (www.genome.ucsc.edu) were used as the initial input. We first adjusted the UCSC alignments to eliminate potentially erroneous alignment gaps (see Supplemental Methods). Then, we defined two types of indel: the “gap indels,” which are indels found between two aligned regions, and the “alignment indels,” which are indels found within an aligned region. To eliminate potentially spurious indels, all the gap indels that include unfinished human or chimpanzee sequences (nucleotides denoted as “N”s) were excluded. Since the UCSC Genome Browser aligned human sequences against the chimpanzee genome, we transformed the coordinates to the human genome coordinates to take advantage of the well-established human gene annotations. The coordinate transformation results in overlapping alignments and gap indels because one human sequence segment may have been aligned to two or more chimpanzee genomic regions in the UCSC alignments. We then used two post-alignment procedures to filter out the redundancy. First, the overlapping alignments were compared and only the longest alignable sequences were retained. Second, two types of gap indels were excluded: (1) gap indels that overlap with each other and (2) gap indels that overlap with aligned sequence segments. For the former, all the overlapping gap indels were discarded because we could not judge which of the overlapping indels was true (for details, see Supplemental Methods). Note that both procedures may result in underestimation of the number of indels.
Verification of indels identified in chimpanzee chromosome 22
All indels identified in the draft chimpanzee chromosome 22 in this study were verified against the high-quality genomic sequences of chimpanzee chromosome 22 (the “RIKEN sequences”) kindly provided by the International Chimpanzee Chromosome 22 Sequencing Consortium (Watanabe et al. 2004). First, segments of ∼400-bp genomic sequences were extracted from the UCSC chimpanzee chromosome 22 sequence (UCSC panTro1 or NCBI Build 1 version 1). Each of these segments was extracted with the identified indel being located in the middle of the segment. For example, a single-base insertion was set to be located at the 201st position of an extracted 401-bp segment. Second, the extracted sequences were submitted to the BLASTN program to search against the RIKEN sequences. Finally, under the assumption that the RIKEN sequences were correct, the BLAST outputs were analyzed to determine whether the identified indels were true or false.
Extracting HS indels from multiple alignments
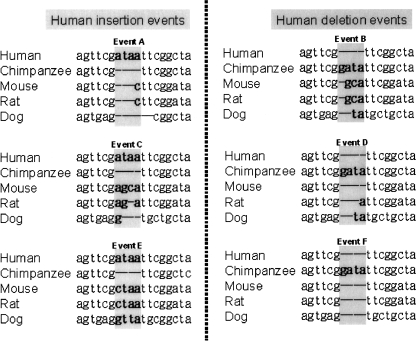
As shown in Figure 1, we first extracted human–chimpanzee indels from the UCSC multiple alignments of seven vertebrate genomes (based on the human genome [release hg17, May 2004], http://hgdownload.cse.ucsc.edu/goldenPath/hg17/multiz8way/). To reduce potential errors, we considered only “completely covered” events, which were indels that occurred within continuous sequences in both of the human and chimpanzee genomes (TCGSAC 2005). However, since the chimpanzee genome sequence is still a draft, many indels (especially 1- or 2-bp indels) may be false positives that have resulted from sequencing or annotation errors. To examine the reliability of the identified indels, we compared the indel-affected sequences with orthologous sequences from mouse (release mm7, Aug. 2005), rat (release rn3, Jun. 2003), and dog (release canFam2, May 2005). This comparison also enabled us to identify indels that were specific to human. Here, a human-specific insertion is defined as a human DNA segment (or a single base) that is not only absent in the orthologous chimpanzee genomic sequence but also absent or partially absent in the corresponding nonprimate sequences (e.g., Fig. 5, event A). A human-specific deletion is defined in a similar way (e.g., Fig. 5, event B). Events C and D in Figure 5 are not considered because the human specificity in these cases is uncertain. Furthermore, events E and F are not included in this analysis because they are surely nonhuman-specific events. Events C–F may result from multiple insertion/deletion hits to the same target sequence. For simplicity, such indels are not considered in the study.
Figure 5.
Definitions of human-specific insertion (event A) and deletion (event B). Events C–F are not included in this study. In events C and D, the human specificity is uncertain. Events E and F represent nonhuman-specific indels.
Prediction of protein domains
We detected protein domain overlapping of HS indels using the InterProScan package and the INTERPRO resource (Mulder et al. 2005; Quevillon et al. 2005). The transcripts with the HS indels were concatenated for InterPro domain scanning.
Calculation of indel rate
Indel rates are shown in terms of percent nucleotide difference. The indel rate equals to the sum of the lengths of all indels in the aligned human and chimpanzee sequences divided by the total length of the aligned sequences (Britten 2002).
Acknowledgments
We thank the reviewers for valuable comments. This work was supported by Academia Sinica, Taiwan, the National Health Research Institutes (NHRI), Taiwan, under contract NHRI-EX95-9408PC, and by NIH grants.
Footnotes
[Supplemental material is available online at www.genome.org.]
Article published online before print. Article and publication date are at http://www.genome.org/cgi/doi/10.1101/gr.5429606
References
- Britten R.J. Divergence between samples of chimpanzee and human DNA sequences is 5%, counting indels. Proc. Natl. Acad. Sci. 2002;99:13633–13635. doi: 10.1073/pnas.172510699. [DOI] [PMC free article] [PubMed] [Google Scholar]
- Chen F.C., Li W.H., Li W.H. Genomic divergences between humans and other hominoids and the effective population size of the common ancestor of humans and chimpanzees. Am. J. Hum. Genet. 2001;68:444–456. doi: 10.1086/318206. [DOI] [PMC free article] [PubMed] [Google Scholar]
- The Chimpanzee Genome Sequencing Analysis Consortium, Initial sequence of the chimpanzee genome and comparison with the human genome. Nature. 2005;437:69–87. doi: 10.1038/nature04072. [DOI] [PubMed] [Google Scholar]
- Clark A.G., Glanowski S., Nielsen R., Thomas P.D., Kejariwal A., Todd M.A., Tanenbaum D.M., Civello D., Lu F., Murphy B., Glanowski S., Nielsen R., Thomas P.D., Kejariwal A., Todd M.A., Tanenbaum D.M., Civello D., Lu F., Murphy B., Nielsen R., Thomas P.D., Kejariwal A., Todd M.A., Tanenbaum D.M., Civello D., Lu F., Murphy B., Thomas P.D., Kejariwal A., Todd M.A., Tanenbaum D.M., Civello D., Lu F., Murphy B., Kejariwal A., Todd M.A., Tanenbaum D.M., Civello D., Lu F., Murphy B., Todd M.A., Tanenbaum D.M., Civello D., Lu F., Murphy B., Tanenbaum D.M., Civello D., Lu F., Murphy B., Civello D., Lu F., Murphy B., Lu F., Murphy B., Murphy B., et al. Inferring nonneutral evolution from human–chimp–mouse orthologous gene trios. Science. 2003;302:1960–1963. doi: 10.1126/science.1088821. [DOI] [PubMed] [Google Scholar]
- Ebersberger I., Metzler D., Schwarz C., Pääbo S., Metzler D., Schwarz C., Pääbo S., Schwarz C., Pääbo S., Pääbo S. Genomewide comparison of DNA sequences between humans and chimpanzees. Am. J. Hum. Genet. 2002;70:1490–1497. doi: 10.1086/340787. [DOI] [PMC free article] [PubMed] [Google Scholar]
- Frazer K.A., Chen X., Hinds D.A., Pant P.V., Patil N., Cox D.R., Chen X., Hinds D.A., Pant P.V., Patil N., Cox D.R., Hinds D.A., Pant P.V., Patil N., Cox D.R., Pant P.V., Patil N., Cox D.R., Patil N., Cox D.R., Cox D.R. Genomic DNA insertions and deletions occur frequently between humans and nonhuman primates. Genome Res. 2003;13:341–346. doi: 10.1101/gr.554603. [DOI] [PMC free article] [PubMed] [Google Scholar]
- Gene Ontology Consortium, Creating the gene ontology resource: Design and implementation. Genome Res. 2001;11:1425–1433. doi: 10.1101/gr.180801. [DOI] [PMC free article] [PubMed] [Google Scholar]
- Han K., Sen S.K., Wang J., Callinan P.A., Lee J., Cordaux R., Liang P., Batzer M.A., Sen S.K., Wang J., Callinan P.A., Lee J., Cordaux R., Liang P., Batzer M.A., Wang J., Callinan P.A., Lee J., Cordaux R., Liang P., Batzer M.A., Callinan P.A., Lee J., Cordaux R., Liang P., Batzer M.A., Lee J., Cordaux R., Liang P., Batzer M.A., Cordaux R., Liang P., Batzer M.A., Liang P., Batzer M.A., Batzer M.A. Genomic rearrangements by LINE-1 insertion-mediated deletion in the human and chimpanzee lineages. Nucleic Acids Res. 2005;33:4040–4052. doi: 10.1093/nar/gki718. [DOI] [PMC free article] [PubMed] [Google Scholar]
- Heissig F., Krause J., Bryk J., Khaitovich P., Enard W., Pääbo S., Krause J., Bryk J., Khaitovich P., Enard W., Pääbo S., Bryk J., Khaitovich P., Enard W., Pääbo S., Khaitovich P., Enard W., Pääbo S., Enard W., Pääbo S., Pääbo S. Functional analysis of human and chimpanzee promoters. Genome Biol. 2005;6:R57. doi: 10.1186/gb-2005-6-7-r57. [DOI] [PMC free article] [PubMed] [Google Scholar]
- International Human Genome Sequencing Consortium, Finishing the euchromatic sequence of the human genome. Nature. 2004;431:931–945. doi: 10.1038/nature03001. [DOI] [PubMed] [Google Scholar]
- Khaitovich P., Hellmann I., Enard W., Nowick K., Leinweber M., Franz H., Weiss G., Lachmann M., Pääbo S., Hellmann I., Enard W., Nowick K., Leinweber M., Franz H., Weiss G., Lachmann M., Pääbo S., Enard W., Nowick K., Leinweber M., Franz H., Weiss G., Lachmann M., Pääbo S., Nowick K., Leinweber M., Franz H., Weiss G., Lachmann M., Pääbo S., Leinweber M., Franz H., Weiss G., Lachmann M., Pääbo S., Franz H., Weiss G., Lachmann M., Pääbo S., Weiss G., Lachmann M., Pääbo S., Lachmann M., Pääbo S., Pääbo S. Parallel patterns of evolution in the genomes and transcriptomes of humans and chimpanzees. Science. 2005;309:1850–1854. doi: 10.1126/science.1108296. [DOI] [PubMed] [Google Scholar]
- Li W.H., Saunders M.A., Saunders M.A. News and views: The chimpanzee and us. Nature. 2005;437:50–51. doi: 10.1038/437050a. [DOI] [PubMed] [Google Scholar]
- Lindblad-Toh K.C.M., Wade T.S., Mikkelsen E.K., Karlsson D.B., Jaffe M., Kamal M., Clamp J.L., Chang E.J., Kulbokas M.C., III, Zody E., Wade T.S., Mikkelsen E.K., Karlsson D.B., Jaffe M., Kamal M., Clamp J.L., Chang E.J., Kulbokas M.C., III, Zody E., Mikkelsen E.K., Karlsson D.B., Jaffe M., Kamal M., Clamp J.L., Chang E.J., Kulbokas M.C., III, Zody E., Karlsson D.B., Jaffe M., Kamal M., Clamp J.L., Chang E.J., Kulbokas M.C., III, Zody E., Jaffe M., Kamal M., Clamp J.L., Chang E.J., Kulbokas M.C., III, Zody E., Kamal M., Clamp J.L., Chang E.J., Kulbokas M.C., III, Zody E., Clamp J.L., Chang E.J., Kulbokas M.C., III, Zody E., Chang E.J., Kulbokas M.C., III, Zody E., Kulbokas M.C., III, Zody E., Zody E., et al. Genome sequence, comparative analysis and haplotype structure of the domestic dog. Nature. 2005;438:803–819. doi: 10.1038/nature04338. [DOI] [PubMed] [Google Scholar]
- Lunter G., Ponting C.P., Hein J., Ponting C.P., Hein J., Hein J. Genome-wide identification of human functional DNA using a neutral indel model. PLoS Comput. Biol. 2006;2:e5. doi: 10.1371/journal.pcbi.0020005. [DOI] [PMC free article] [PubMed] [Google Scholar]
- Marvanova M., Menager J., Bezard E., Bontrop R.E., Pradier L., Wong G., Menager J., Bezard E., Bontrop R.E., Pradier L., Wong G., Bezard E., Bontrop R.E., Pradier L., Wong G., Bontrop R.E., Pradier L., Wong G., Pradier L., Wong G., Wong G. Microarray analysis of nonhuman primates: Validation of experimental models in neurological disorders. FASEB J. 2003;17:929–931. doi: 10.1096/fj.02-0681fje. [DOI] [PubMed] [Google Scholar]
- Mills R.E., Luttig C.T., Larkins C.E., Beauchamp A., Tsui C., Pittard W.S., Devine S.E., Luttig C.T., Larkins C.E., Beauchamp A., Tsui C., Pittard W.S., Devine S.E., Larkins C.E., Beauchamp A., Tsui C., Pittard W.S., Devine S.E., Beauchamp A., Tsui C., Pittard W.S., Devine S.E., Tsui C., Pittard W.S., Devine S.E., Pittard W.S., Devine S.E., Devine S.E. An initial map of insertion and deletion (INDEL) variation in the human genome. Genome Res. 2006;16:1182–1190. doi: 10.1101/gr.4565806. [DOI] [PMC free article] [PubMed] [Google Scholar]
- Mulder N.J., Apweiler R., Attwood T.K., Bairoch A., Bateman A., Binns D., Bradley P., Bork P., Bucher P., Cerutti L., Apweiler R., Attwood T.K., Bairoch A., Bateman A., Binns D., Bradley P., Bork P., Bucher P., Cerutti L., Attwood T.K., Bairoch A., Bateman A., Binns D., Bradley P., Bork P., Bucher P., Cerutti L., Bairoch A., Bateman A., Binns D., Bradley P., Bork P., Bucher P., Cerutti L., Bateman A., Binns D., Bradley P., Bork P., Bucher P., Cerutti L., Binns D., Bradley P., Bork P., Bucher P., Cerutti L., Bradley P., Bork P., Bucher P., Cerutti L., Bork P., Bucher P., Cerutti L., Bucher P., Cerutti L., Cerutti L., et al. InterPro, progress and status in 2005. Nucleic Acids Res. 2005;33:D201–D205. doi: 10.1093/nar/gki106. [DOI] [PMC free article] [PubMed] [Google Scholar]
- Newman T.L., Tuzun E., Morrison V.A., Hayden K.E., Ventura M., McGrath S.D., Rocchi M., Eichler E.E., Tuzun E., Morrison V.A., Hayden K.E., Ventura M., McGrath S.D., Rocchi M., Eichler E.E., Morrison V.A., Hayden K.E., Ventura M., McGrath S.D., Rocchi M., Eichler E.E., Hayden K.E., Ventura M., McGrath S.D., Rocchi M., Eichler E.E., Ventura M., McGrath S.D., Rocchi M., Eichler E.E., McGrath S.D., Rocchi M., Eichler E.E., Rocchi M., Eichler E.E., Eichler E.E. A genome-wide survey of structural variation between human and chimpanzee. Genome Res. 2005;15:1344–1356. doi: 10.1101/gr.4338005. [DOI] [PMC free article] [PubMed] [Google Scholar]
- Nielsen R.C., Bustamante A.G., Clark S., Glanowski T.B., Sackton M.J., Hubisz A., Fledel-Alon D.M., Tanenbaum D., Civello T.J., White J.S.J., Bustamante A.G., Clark S., Glanowski T.B., Sackton M.J., Hubisz A., Fledel-Alon D.M., Tanenbaum D., Civello T.J., White J.S.J., Clark S., Glanowski T.B., Sackton M.J., Hubisz A., Fledel-Alon D.M., Tanenbaum D., Civello T.J., White J.S.J., Glanowski T.B., Sackton M.J., Hubisz A., Fledel-Alon D.M., Tanenbaum D., Civello T.J., White J.S.J., Sackton M.J., Hubisz A., Fledel-Alon D.M., Tanenbaum D., Civello T.J., White J.S.J., Hubisz A., Fledel-Alon D.M., Tanenbaum D., Civello T.J., White J.S.J., Fledel-Alon D.M., Tanenbaum D., Civello T.J., White J.S.J., Tanenbaum D., Civello T.J., White J.S.J., Civello T.J., White J.S.J., White J.S.J., et al. A scan for positively selected genes in the genomes of humans and chimpanzees. PLoS Biol. 2005;3:e170. doi: 10.1371/journal.pbio.0030170. [DOI] [PMC free article] [PubMed] [Google Scholar]
- Quevillon E., Silventoinen V., Pillai S., Harte N., Mulder N., Apweiler R., Lopez R., Silventoinen V., Pillai S., Harte N., Mulder N., Apweiler R., Lopez R., Pillai S., Harte N., Mulder N., Apweiler R., Lopez R., Harte N., Mulder N., Apweiler R., Lopez R., Mulder N., Apweiler R., Lopez R., Apweiler R., Lopez R., Lopez R. InterProScan: Protein domains identifier. Nucleic Acids Res. 2005;33:W116–W120. doi: 10.1093/nar/gki442. [DOI] [PMC free article] [PubMed] [Google Scholar]
- de van Lagemaat L.N., Gagnier L., Medstrand P., Mager D.L., Gagnier L., Medstrand P., Mager D.L., Medstrand P., Mager D.L., Mager D.L. Genomic deletions and precise removal of transposable elements mediated by short identical DNA segments in primates. Genome Res. 2005;15:1243–1249. doi: 10.1101/gr.3910705. [DOI] [PMC free article] [PubMed] [Google Scholar]
- Watanabe H., Fujiyama A., Hattori M., Taylor T.D., Toyoda A., Kuroki Y., Noguchi H., Ben A., Kahla H., Lehrach R., Fujiyama A., Hattori M., Taylor T.D., Toyoda A., Kuroki Y., Noguchi H., Ben A., Kahla H., Lehrach R., Hattori M., Taylor T.D., Toyoda A., Kuroki Y., Noguchi H., Ben A., Kahla H., Lehrach R., Taylor T.D., Toyoda A., Kuroki Y., Noguchi H., Ben A., Kahla H., Lehrach R., Toyoda A., Kuroki Y., Noguchi H., Ben A., Kahla H., Lehrach R., Kuroki Y., Noguchi H., Ben A., Kahla H., Lehrach R., Noguchi H., Ben A., Kahla H., Lehrach R., Ben A., Kahla H., Lehrach R., Kahla H., Lehrach R., Lehrach R., et al. DNA sequence and comparative analysis of chimpanzee chromosome 22. Nature. 2004;429:382–388. doi: 10.1038/nature02564. [DOI] [PubMed] [Google Scholar]
- Yang Z. PAML: A program package for phylogenetic analysis by maximum likelihood. Comput. Appl. Biosci. 1997;13:555–556. doi: 10.1093/bioinformatics/13.5.555. [DOI] [PubMed] [Google Scholar]
- Yang Z., Nielsen R., Nielsen R. Estimating synonymous and nonsynonymous substitution rates under realistic evolutionary models. Mol. Biol. Evol. 2000;17:32–43. doi: 10.1093/oxfordjournals.molbev.a026236. [DOI] [PubMed] [Google Scholar]
- Zhang Z., Gerstein M., Gerstein M. Patterns of nucleotide substitution, insertion and deletion in the human genome inferred from pseudogenes. Nucleic Acids Res. 2003;31:5338–5348. doi: 10.1093/nar/gkg745. [DOI] [PMC free article] [PubMed] [Google Scholar]
- Zhang Z., Carriero N., Zheng D., Karro J., Harrison P.M., Gerstein M., Carriero N., Zheng D., Karro J., Harrison P.M., Gerstein M., Zheng D., Karro J., Harrison P.M., Gerstein M., Karro J., Harrison P.M., Gerstein M., Harrison P.M., Gerstein M., Gerstein M. PseudoPipe: an automated pseudogene identification pipeline. Bioinformatics. 2006;22:1437–1439. doi: 10.1093/bioinformatics/btl116. [DOI] [PubMed] [Google Scholar]


