Abstract
The intracellular activity of the p53 tumor suppressor protein is regulated through a feedback loop involving its transcriptional target, mdm2. We present a simple mathematical model suggesting that, under certain circumstances, oscillations in p53 and Mdm2 protein levels can emerge in response to a stress signal. A delay in p53-dependent induction of Mdm2 is predicted to be required, albeit not sufficient, for this oscillatory behavior. In line with the predictions of the model, oscillations of both p53 and Mdm2 indeed occur on exposure of various cell types to ionizing radiation. Such oscillations may allow cells to repair their DNA without risking the irreversible consequences of continuous excessive p53 activation.
The p53 tumor suppressor protein plays a key role in preventing the development of cancer and is inactivated in many human malignancies. Mutations in the p53 tumor suppressor gene occur in about 50% of human tumors (1). In response to genomic stress, p53 activation may elicit cell-cycle arrest or apoptotic cell death, as well as contribute to DNA repair processes (for recent reviews see refs. 2–6). Because some of the cellular effects of activated p53 can be irreversible, keeping p53 function under tight control in normal cells is critical. A key player in the regulation of p53 is the Mdm2 protein. Inactivation of the mdm2 gene in mice results in early embryonal lethality (7, 8). Conceivably, in the absence of functional Mdmd2 protein, p53 becomes strongly deregulated to the extent that its excess activity leads to embryonic death. On the other hand, excessive Mdm2 expression can lead to constitutive inhibition of p53 and thereby promote cancer without a need to alter the p53 gene itself (9).
Mdm2 exhibits a dual relationship with p53 (reviewed in refs. 10–12). On the one hand, Mdm2 binding to p53 can repress the transcriptional functions of p53 and also lead to complete elimination of p53 through proteolytic degradation. On the other hand, p53 binds to the mdm2 gene and stimulates its transcription. This duality defines a negative feedback loop, which probably serves to keep p53 in tight check and to rapidly terminate the p53 response once a p53-activating stress signal has been effectively dealt with. Although the importance of the p53-Mdm2 loop is widely recognized, the rules that govern its outcome remain in need of further elaboration.
During the years, several models addressing p53 in the context of statistical theories of multistage tumorigenesis have been proposed (e.g., refs. 13 and 14). A theoretical model of the G2 DNA damage checkpoint, involving p53, also has been proposed (15). However, modeling attempts that take p53 regulation explicitly into account have been lacking. We now present a simple mathematical model of the p53-Mdm2 feedback loop. In our attempt to capture the gross mechanisms of p53-Mdm2 interactions as presently known, we have investigated numerically how different parameters can shape the types of behavior that the system can exhibit. In particular, we show that specific assumptions characterizing the interactions between p53 and Mdm2 lead to an oscillatory behavior of both p53 and Mdm2 protein levels after a sufficiently strong damage signal. In agreement with this prediction, the levels of both proteins are shown to oscillate in irradiated cells. Such oscillation may enable the more effective execution of a reversible p53 response.
The Model
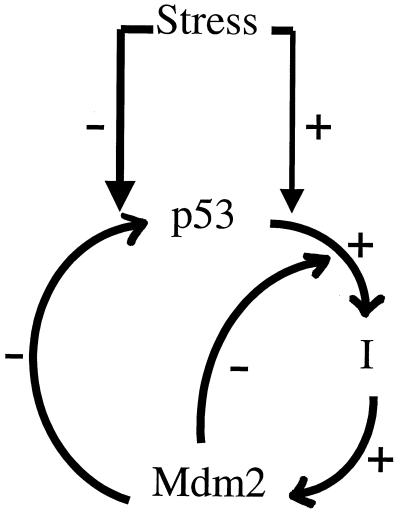
Our modeling rests on a simplified description of the p53-Mdm2 interaction (Fig. 1). The negative effect of Mdm2 on p53 protein level and activity includes: (i) the inhibition of p53 transcriptional activity and (ii) the promotion of p53 degradation, mediated through the binding of Mdm2 to the p53 protein. Activated p53, in turn, up-regulates Mdm2, by enhancing the transcription of the mdm2 gene. The possibility of a time lag between p53 activation and p53-dependent induction of Mdm2 is incorporated in the form of a hypothetical intermediary I, which couples between p53 and Mdm2. Stress conditions, such as DNA damage, are assumed to: (i) be relieved at a certain rate (e.g., by DNA repair), (ii) enhance the transcriptional activities of p53, and (iii) negatively affect mechanisms of p53 degradation promoted by Mdm2. Processes ii and iii involve qualitative modifications of p53 and presumably Mdm2, such as those caused by stress-activated kinases. Additional factors in the model include the synthesis rate of p53, p53-independent induction of Mdm2, degradation of Mdm2, and Mdm2-independent elimination of p53. A detailed description of the model follows.
Figure 1.
A schematic illustration of the controlling interactions in the model. p53 induces Mdm2 via an intermediary I, postulated to introduce the idea of delay between p53 activation and p53-dependent induction of Mdm2. Mdm2, in turn, negatively affects (i) p53 levels (right arrow) and (ii) p53-dependent Mdm2 induction (left arrow). Stress conditions (i) positively affect p53 activation and (ii) negatively affect Mdm2-mediated degradation of p53. Omitted are constitutive supply and degradation terms for p53 and Mdm2.
We assume that the concentration of p53 protein obeys the following kinetic equation:
 |
1 |
Here the coefficient sourcep53 specifies the synthesis rate of the p53 protein. For the sake of simplicity we have not addressed the evidence that exposure of cells to p53-activating signals also can lead to increased translation of the p53 mRNA (16). The second term in Eq. 1 describes Mdm2-dependent degradation of p53, where mass-action binding of Mdm2 to p53 results in p53 ubiquitination and its subsequent proteasomal degradation (17–20). The variable degradation(t) measures the rate of degradation, which depends on stress signals (Eq. 6). The last term in Eq. 1 reflects an Mdm2-independent mechanism for p53 degradation (21–23).
The kinetics governing the concentration of Mdm2 protein are given by:
 |
2 |
Here the coefficient p1 denotes the rate of p53-independent mdm2 transcription and translation (24, 25), whereas the last term describes Mdm2 degradation (26). The second term implements p53-dependent transcription and translation of Mdm2 protein. The quantity I(t) measures the strength of an intermediary: a mathematical representation of an unknown mechanism leading to the observed delay in the p53-dependent induction of Mdm2 (25, 27, 28). This intermediary enhances Mdm2 production with step-like kinetics, modeled by a Hill-type function. The kinetics for the intermediary I is given by
 |
3 |
The first term in Eq. 3 reflects a positive effect of active p53 on the Mdm2 intermediary. The coefficient activity can include p53's sequence-specific DNA binding activity and the potency of the p53 transactivation domain, both of which can be augmented by stress signals (31–42). Furthermore, Mdm2-p53 binding can inhibit p53's transcriptional activity (43–48). Thus, activity can be modeled as
 |
4 |
From Eq. 3 it is seen that the intermediary I reaches its steady-state level with a time scale determined by 1/kdelay. Thus, by using a differential equation to determine I, we account in a crude fashion for the possible delay between the activation of p53 and the induction of Mdm2. The idea of a “gearing up” for Mdm2 protein production relies on evidence according to which, in some situations, mdm2 transcription is induced later than that of other p53 target genes (28, 30), and that there may be an even further delay in mdm2 translation (29).
The equation representing the kinetics of the p53-activating signal is given by
 |
5 |
Here we assume an initial pulse of signal that can represent a short exposure of cells to DNA damaging agents, e.g., UV or ionizing radiation (IR). The signal subsequently is resolved by cellular mechanisms of damage repair, with a rate denoted in Eq. 5 by a constant repair. Note that, for the sake of simplicity, we do not incorporate in our model: (i) specific repair pathways, to reflect the fact that different types of damage are repaired through different pathways (49) and (ii) the direct or indirect role that p53 may play in some DNA repair processes (50, 51).
The variable degradation(t) in Eq. 1 is chosen to be of the form:
 |
6 |
Here degradationbasal represents the strength of Mdm2's ability to promote p53 degradation, controlling the basal levels of p53. kdeg models the amount of inhibition of degradation caused by damage-derived signals that modify p53 and/or Mdm2 (39, 52–55). Threshold(t) relates to a damping effect on this inhibition, owing to an assumed delay between the delivery of the damage signal and the effective establishment of conditions (modifications) that interfere with efficient Mdmd2-mediated p53 degradation. The kinetics of threshold(t) is given by
 |
7 |
 |
Here kdamp models the effect of the initial damage signal on the rate of inhibition of mdm2-mediated p53 degradation. Eqs. 6 and 7 reflect the assumption that in the case of a weak damage signal, the activation of damage-induced signaling pathways is likely to be relatively inefficient. For instance, enzymes (protein kinases, phosphatases, and acetyltransferases) that modify p53 and/or Mdm2 may undergo only a limited change in level of activity. Consequently, its is expected that more time will be required to reach a threshold of p53/mdm2 modifications sufficient for sparing p53 from the destabilizing effects of Mdm2.
In our attempt to model p53-Mdm2 interactions, many gross simplifications had to be made, and much biological information was ignored. Notably, the effects of other proteins that interact with Mdm2 and/or p53, such as ARF (56, 57), are not included. Furthermore, our model does not incorporate the contribution of changes in the subcellular localization of p53 and Mdm2, known to be important in controlling the rate of p53 degradation (58–62). Moreover, the effect of the cell cycle phase on the prevalence of the p53-Mdm2 interaction (22) is excluded.
Integration and computer simulations of the p53-Mdm2 model, together with experimental data consistent with it, are described in the next section.
Materials and Methods
Cell Culture.
Mouse fibroblasts NIH 3T3 cells and human breast cancer epithelial MCF-7 cells were maintained at 37°C in DMEM supplemented with 10% FCS and 20 mM glutamine.
Protein Analysis.
For the determination of steady-state p53 and Mdm2 levels, gamma-irradiated cells were extracted in protein sample buffer, and cell extracts were processed by SDS/PAGE followed by Western blot analysis. Endogenous mouse p53 was detected by probing with a mixture of mAbs PAb248 and PAb421, and human p53 was detected by probing with a mixture of the mAbs DO-1 and 1801. Endogenous mouse Mdm2 was detected by probing with a polyclonal serum 1506, and human Mdm2 was detected by probing with a mixture of the mAbs 4B2 and 2A9.
Results
Choice of Parameters.
The experimental data presently available does not allow an assignment of rigorous values for most of the parameters incorporated in the model. For instance, the time scale of damage resolution, modeled by the repair constant in Eq. 5, may range from hours (63) to days (64) to never (65, 66). The half-lives of p53 and Mdm2 under basal conditions are arbitrarily set here as 20 min for each protein; these values fall within a range believed to be typical of nonstressed cells, but by no means represent a definitive number. For other parameter ranges, we use rough estimations: dp53 in Eq. 1, for instance, is taken to be small with respect to the Mdm2-dependent rate of p53 elimination, reflecting the fact that although other mechanisms for the demise of p53 also exist, a large body of data points to Mdm2 as the key regulator of p53 stability (4, 5).
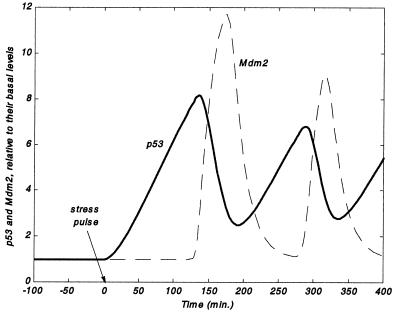
Numerical solution of the model equations suggest that, under certain conditions, p53 and Mdm2 undergo damped oscillations after a damage signal (Fig. 2). An initial pulse of stress at t = 0 with a characteristic repair scale of ≈5 days (Eq. 5) was introduced. It is seen that after the initial pulse, both p53 and Mdm2 levels increase several-fold with respect to their basal levels, to which they return (not shown) after the damage signal is resolved (not shown). A time lag can be seen between the peaking of p53 and Mdm2 levels. In this particular example, Mdm2 peaks with a delay of ≈1 h relative to p53's maximum. It is particularly noteworthy that the peak of Mdm2 coincides with the minimum of p53.
Figure 2.
Numerical solution of Eqs. 1-6. p53 and Mdm2 levels (relative to their basal amounts) undergo oscillations after an initial pulse of stress at t = 0. Mdm2 protein levels peak with a delay of ≈1 h after the peak in p53 levels. Mdm2 minima coincide with p53 maxima. Here, sourcep53 = 0.5; dp53 = 2.5E-04; p1 = 2.35E-03; p2max = 0.03; n = 50; Km = 25; dMdm2 = 0.05; c1 = 1.52E-02; c2 = 0.01; kdelay = 1.52E-02; repair = 1.E-04; degradationbasal = 2; kdeg = 1.93; kdamp = 0.05; p53(t = 0) = 5.3; Mdm2(t = 0) = 0.047; signal(t = 0) = 1.
A key feature displayed in Fig. 2 is that the peaking and subsequent decrease of p53 and Mdm2 levels are followed by additional waves of protein accumulation, appearing here with a periodicity of ≈3 h. Here, too, the minima of p53 roughly coincide with the maxima of Mdm2 and vice versa. The oscillations damp and eventually disappear in this case after a time scale of ≈17 h (not shown).
Dependence of Oscillations on Model Parameters.
We studied numerically the dependence of the amplitude and width of the first wave on the different parameters. We find that increasing the values of p1 and KM gives a higher and wider p53 wave and a lower and narrower Mdm2 wave. Increasing sourcep53, dMdm2, and c1 results in a lower and narrower p53 wave and a higher and wider Mdm2 wave. Increasing n makes both p53 and Mdm2 waves higher and narrower. Increasing kdeg makes both waves higher and wider. Increasing dp53 makes the p53 wave lower and narrower, while making the Mdm2 wave lower and wider. Increasing c2 makes the p53 wave higher and narrower, while making the Mdm2 wave lower and narrower.
The time lag between the maxima of Mdm2 and p53 is controlled by kdelay in Eq. 3. The rationale for the behavior above can be readily seen from Eqs. 1-7. For example, triggering a stress signal decreases the degradation of p53 (Eq. 6). This makes p53 free to rise above its basal level with a rate that is (i) positively affected by the rate of p53 supply (denoted by sourcep53), and (ii) negatively affected by the rate of p53 elimination. The induction of Mdm2 that takes place after a certain time lag enhances the degradation of p53, which then leads to a decrease in p53 protein levels. This, in turn, generates lower production of intermediary I, thus lowering Mdm2 levels.
If there is still enough damage to keep p53 degradation weak, a subsequent decrease of Mdm2 after it has reached its first peak leads to a decrease in p53 degradation. Thus p53 levels increase again, as long as there is a time delay in Mdm2 induction. Upon induction of Mdm2, p53 levels subsequently will decrease, causing in turn a decrease in Mdm2. If the conditions that give rise to the second peak still hold, further oscillations will follow.
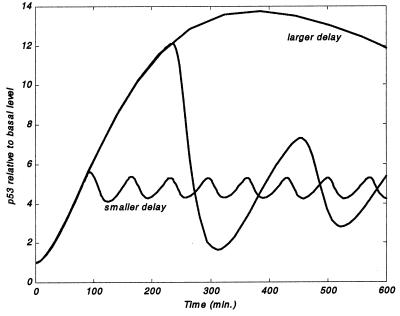
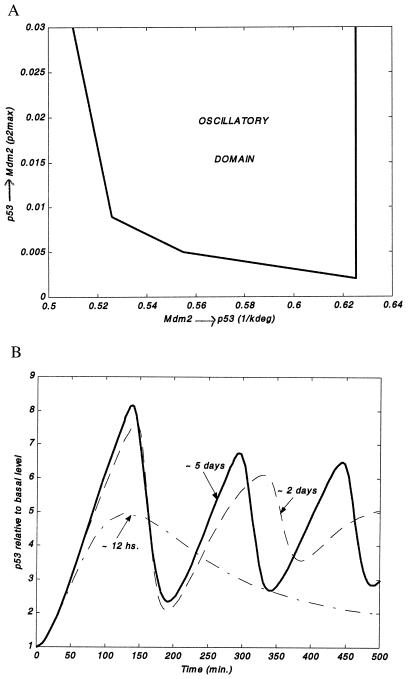
Importantly, within the model, the delay in p53-dependent induction of Mdm2 is essential for an oscillatory behavior (Fig. 3). In addition, for the delay to generate oscillations, the strengths of the p53-Mdm2 interaction mechanisms (and the parameters that govern them, degradation, c1, delay, c2 and p2max) have to lie within an intermediate range (Fig. 4A). A change in one of these parameters that leads to loss of oscillations can sometimes be remedied by an opposite change in an antagonistic parameter, as portrayed in Fig. 4A.
Figure 3.
Effect of delay in p53-dependent induction of Mdm2 on the protein levels (relative to their basal amounts). Only for an intermediate delay (c1 = kdelay = 4.0E-03, 50-min time lag between p53 and Mdm2 peaks), meaningful oscillations are obtained. p53 levels in the intermediate delay case (i) increase to a larger value than in the small-delay case (c1 = kdelay = 0.09, 20-min time lag) and (ii) remain large for a shorter period that in the large-delay case (c1 = kdelay = 9.0E-04, 5-h time lag). Remaining parameter values are as in Fig. 2.
Figure 4.
Dependence of oscillations on additional model parameters. (A) The strengths p53 → Mdm2 (here measured by p2max, Eq. 2) and Mdm2 → p53 (here measured by 1/kdeg, Eq. 6) define a plane wherein the oscillatory domain is portrayed. Here we assume a constant signal throughout the simulation, signal = 1. The arrows exemplify a conservation requirement for oscillations: If, for instance, the Mdm2 → p53 interaction is made weaker, then to obtain oscillations, the p53 → Mdm2 interaction strength should be made larger. Remaining parameter values are as in Fig. 2. (B) Dependence of p53 levels (relative to their basal amounts) on the damage repair rate, repair (Eq. 5). Here repair is taken to be 1.4E-03 (dash dotted line), 3.5E-04 (dashed line), and 1.4E-04 (solid line). Remaining parameter values are as in Fig. 2.
In addition, the emergence of oscillations requires that the repair time (Eq. 5) be much longer than the period of the oscillations. Alternatively, a similar outcome may be seen also in cases of fast repair, provided that the signal emanating from the damage (e.g., activation of a kinase) persists long enough afterward. The effect of the repair time on the predicted pattern of p53 oscillations is illustrated in Fig. 4B. This does not necessarily mean that damage repair is slow, but rather that the signal to p53 must persist at a high level.
It is also noteworthy that, in our model, oscillations depend on a very steep, steplike induction of mdm2 by the intermediate I (modeled by n > 10 in Eq. 2). This means that below a certain threshold (measured by KM) of intermediary amounts, there is no p53-dependent production of Mdm2. Above that threshold, Mdm2 is produced with a saturating value. Such switch-like behavior might reflect a process of multiple partially rate-determining steps or the effect of a stoichiometric inhibitor (67, 68).
Experimental Observation of p53 Oscillations.
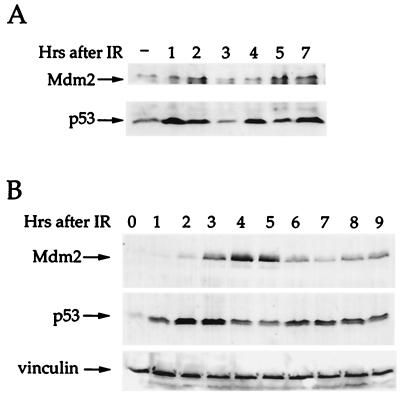
In agreement with the predictions of our model, coordinated oscillation of both p53 and Mdm2 can indeed be observed in wild-type p53-expressing cells that experience DNA damage. For instance, in mouse NIH/3T3 cells exposed to IR, p53 peaks first approximately 1 h after irradiation (Fig. 5A), and then is seen to oscillate with a periodicity of about 3 h (second peak at 4 h, third peak at 7 h). In both first and second waves, Mdm2 oscillations follow those of p53 with an approximate delay of 1 h.
Figure 5.
Oscillation in p53 and Mdm2 after IR. (A) Mouse fibroblasts NIH 3T3 cells expressing wild-type p53 and wild-type Mdm2 were irradiated with 5 Gy of IR and harvested at the indicated time points after irradiation. Total cell extracts were subjected to SDS/PAGE followed by Western blot analysis. p53 protein levels were detected by a mixture of the mAbs PAb248 and PAb421, Mdm2 levels were detected by probing with the polyclonal serum 1506. (B) Human breast cancer epithelial MCF-7 cells, expressing wild-type p53 and wild-type Mdm2 were irradiated with 5 Gy of IR and harvested at the indicated time points after irradiation. Total cell extracts were subjected to SDS/PAGE followed by Western blot analysis. p53 protein levels were detected by probing with a mixture of the mAbs DO-1 and 1801, Mdm2 levels were detected by probing with a mixture of the mAbs 4B2 and 2A9.
A roughly similar pattern also is seen in human breast carcinoma-derived MCF7 cells, also harboring wild-type p53. Exposure of these cells to a relatively high dose of IR (5 Gy) results in a first peak of p53 accumulation 2–3 h later (Fig. 5B), followed by a second peak approximately 6–7 h postirradiation. Mdm2 exhibits a similar periodicity, which in this case is delayed by about 2 h relative to p53. The pattern of p53 accumulation in MCF7 cells is less precise than in NIH/3T3 cells, with broader and more diffuse peaks, particularly in the second wave. This may be because of a less synchronous response of individual cells within the cultured exposed to DNA, or perhaps a faster repair rate and shorter persistence of the DNA damage-induced signal (see also Fig. 4B).
Effect of Damage Strength on Oscillations.
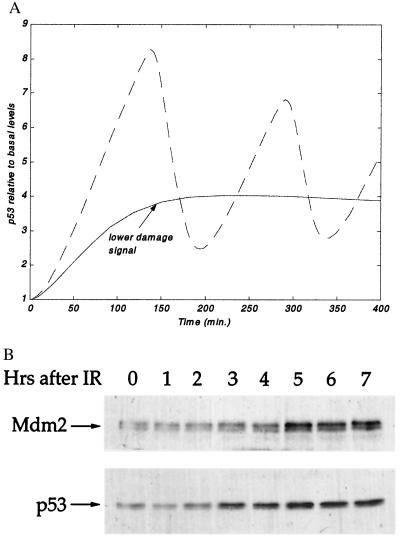
Within the model, a stress signal below a certain threshold will not generate oscillations, and p53 and Mdm2 will rise to a lower level than in the high damage case (Fig. 6A). Moreover, as predicted from Eqs. 6 and 7, the rise in steady-state p53 levels should be slower in the case of a weak damage signal, owing to the longer time required to reach a critical threshold of p53/Mdm2 modifications sufficient for compromising the inherent p53-destabilizing activity of Mdm2. This is shown graphically in Fig. 6A.
Figure 6.
Delayed increase in p53 and Mdm2 after low levels of IR. (A) Effect of a lower stress signal on p53 levels (relative to their basal amounts). Here signal(t = 0) = 0.8. Remaining parameter values are as in Fig. 2. The curve for higher signal (dotted line) is identical to the p53 curve in Fig. 2. (B) MCF-7 cells were irradiated with 0.3 Gy of IR and harvested at the indicated time points after irradiation. Succeeding treatment as in Fig. 5B. Total cell extracts were subjected to SDS/PAGE followed by Western blot analysis. p53 protein levels were detected by a probing with a mixture of the mAbs DO-1 and 1801, Mdm2 levels were detected by probing with a mixture of the mAbs 4B2 and 2A9.
This possibility was evaluated by exposing MCF-7 cells to a low dose of IR. As seen in Fig. 6B, this resulted in an extended rise of both p53 and Mdm2, with no observable oscillations within the time frame of the experiment. Moreover, the time required to reach peak p53 levels was significantly longer than in the case of higher damage (compare with Fig. 5B). Thus, the actual observations in cells exposed to IR are in accord with the theoretical predictions.
Discussion
Many details regarding p53, Mdm2, and their mechanisms of interaction are still not sufficiently characterized quantitatively. Our analysis indicates, however, that the knowledge of exact parameter values is not essential to devise a simple model that suggests a testable hypothesis regarding the types of behavior that a system can exhibit. Interestingly, we find that certain features of the p53-Mdm2 interaction can generate oscillations in the levels of both proteins, in response to a sufficiently high stress signal. More specifically, a delay in p53-dependent induction of Mdm2 is found to be a prerequisite for an oscillatory behavior. The length of this delay determines the period of the oscillations. For the delay to generate oscillations, the strength of p53-Mdm2 interactions has to lie in an intermediate range.
The predictions of this model are supported by the experimental observations. As shown in Fig. 5, coordinated oscillations of p53 and Mdm2 do occur in cells exposed to a sufficient dose of IR. Oscillation of p53 also has been reported in other cellular systems, in response to both ionizing and UV radiation (16, 69, 70). The kinetics of p53 induction and the period of the oscillations, as well as the relative fold of p53 increase over basal levels, vary widely among the experimental systems analyzed. This suggests that although the general rules that govern the p53-Mdm2 interplay are most probably conserved among the various types of cells and DNA damage, the individual quantitative parameters in each situation may be very different.
What is the purpose of the oscillations? A clue may be offered by Fig. 3, which predicts that in the intermediate-delay case, p53 levels increase to a larger value than in the small-delay case and yet remain high for a shorter period than in the large-delay case. One might speculate that, in cases where the damage should be dealt with successfully without ending up in an irreversible biological outcome (e.g., apoptosis), it might be advantageous for the system to harbor oscillations to achieve a compromise between a situation of insufficiently low levels of p53 and a situation of extended maintenance of intolerably high activity of p53. Thus, oscillation might be viewed as an arrangement that allows repetitive repair efforts: a first pulse of p53 is delivered, and the system waits to see whether the damage has been properly fixed. If not, a second pulse is generated, and so forth, until the damage is effectively resolved and the signals leading to p53 activation subside. On the other hand, if the extent of damage is excessive, the amplitude and duration of the p53 peak may be high enough to trigger an irreversible response. In this regard, it is noteworthy that constitutive high overexpression of p53 results in apoptosis, whereas a lower extent of p53 overexpression does not (71, 72).
Oscillations in p53 are not only a means for switching p53 on and off. In fact, such oscillations also may be viewed as a program that alters the overall cellular concentration of active p53 in an orderly and tightly controlled fashion. This is likely to affect the pattern of transcriptional activation by p53, as different target genes are responsive to different concentrations of p53 (73). The oscillations therefore may mandate which p53 target genes become maximally active at any given time point. As demonstrated by us, the quantitative parameters and even the mere presence of the oscillations highly depend on the extent and duration of the stress signal. This may provide the p53 response with a built-in “intelligence,” designed to use the large arsenal of p53 target genes most effectively toward orchestrating different cellular outcomes, dictated by stress/damage signals of different nature and magnitude.
Acknowledgments
We thank Dr. Tanya Gottlieb for helpful discussions and for sharing unpublished data. This work was supported in part by grants from the National Institutes of Health (RO1 CA-40099), the German-Israel Project Cooperation (DIP), the Center for Excellence Program of the Israel Science Foundation, the Israel Ministry of Science, the German Cancer Research Center (DKFZ), and the Bosch Foundation (Germany).
Abbreviation
- IR
ionizing radiation
Footnotes
This paper was submitted directly (Track II) to the PNAS office.
Article published online before print: Proc. Natl. Acad. Sci. USA, 10.1073/pnas.210171597.
Article and publication date are at www.pnas.org/cgi/doi/10.1073/pnas.210171597
References
- 1.Bennett W P, Hussain S P, Vahakangas K H, Khan M A, Shields P G, Harris C C. J Pathol. 1999;187:8–18. doi: 10.1002/(SICI)1096-9896(199901)187:1<8::AID-PATH232>3.0.CO;2-Y. [DOI] [PubMed] [Google Scholar]
- 2.Levine A J. Cell. 1997;88:323–331. doi: 10.1016/s0092-8674(00)81871-1. [DOI] [PubMed] [Google Scholar]
- 3.Agarwal M L, Taylor W R, Chernov M V, Chernova O B, Stark G R. J Biol Chem. 1998;273:1–4. doi: 10.1074/jbc.273.1.1. [DOI] [PubMed] [Google Scholar]
- 4.Prives C, Hall P A. J Pathol. 1999;187:112–126. doi: 10.1002/(SICI)1096-9896(199901)187:1<112::AID-PATH250>3.0.CO;2-3. [DOI] [PubMed] [Google Scholar]
- 5.Oren M. J Biol Chem. 1999;274:36031–36034. doi: 10.1074/jbc.274.51.36031. [DOI] [PubMed] [Google Scholar]
- 6.Giaccia A J, Kastan M B. Genes Dev. 1998;12:2973–2983. doi: 10.1101/gad.12.19.2973. [DOI] [PubMed] [Google Scholar]
- 7.Jones S N, Roe A E, Donehower L A, Bradley A. Nature (London) 1995;378:206–208. doi: 10.1038/378206a0. [DOI] [PubMed] [Google Scholar]
- 8.Montes de Oca Luna R, Wagner D S, Lozano G. Nature (London) 1995;378:203–206. doi: 10.1038/378203a0. [DOI] [PubMed] [Google Scholar]
- 9.Oliner J D, Kinzler K W, Meltzer P S, George D L, Vogelstein B. Nature (London) 1992;358:80–83. doi: 10.1038/358080a0. [DOI] [PubMed] [Google Scholar]
- 10.Lozano G, Montes de Oca Luna R. Biochim Biophys Acta. 1998;1377:M55–M59. doi: 10.1016/s0304-419x(97)00037-1. [DOI] [PubMed] [Google Scholar]
- 11.Freedman D A, Wu L, Levine A J. Cell Mol Life Sci. 1999;55:96–107. doi: 10.1007/s000180050273. [DOI] [PMC free article] [PubMed] [Google Scholar]
- 12.Juven-Gershon T, Oren M. Mol Med. 1999;5:71–83. [PMC free article] [PubMed] [Google Scholar]
- 13.Mao J H, Lindsay K A, Balmain A, Wheldon T E. Br J Cancer. 1998;77:243–252. doi: 10.1038/bjc.1998.40. [DOI] [PMC free article] [PubMed] [Google Scholar]
- 14.Israel L. J Theor Biol. 1996;178:375–380. doi: 10.1006/jtbi.1996.0033. [DOI] [PubMed] [Google Scholar]
- 15.Aguda B D. Proc Natl Acad Sci USA. 1999;96:11352–11357. doi: 10.1073/pnas.96.20.11352. [DOI] [PMC free article] [PubMed] [Google Scholar]
- 16.Fu L N, Minden M D, Benchimol S. EMBO J. 1996;15:4392–4401. [PMC free article] [PubMed] [Google Scholar]
- 17.Haupt Y, Maya R, Kazaz A, Oren M. Nature (London) 1997;387:296–299. doi: 10.1038/387296a0. [DOI] [PubMed] [Google Scholar]
- 18.Kubbutat M H G, Jones S N, Vousden K H. Nature (London) 1997;387:299–303. doi: 10.1038/387299a0. [DOI] [PubMed] [Google Scholar]
- 19.Bottger A, Bottger V, Sparks A, Liu W L, Howard S F, Lane D P. Curr Biol. 1997;7:860–869. doi: 10.1016/s0960-9822(06)00374-5. [DOI] [PubMed] [Google Scholar]
- 20.Honda R, Yasuda H. EMBO J. 1999;18:22–27. doi: 10.1093/emboj/18.1.22. [DOI] [PMC free article] [PubMed] [Google Scholar]
- 21.Fuchs S Y, Adler V, Buschmann T, Wu X, Ronai Z. Oncogene. 1998;17:2543–2547. doi: 10.1038/sj.onc.1202200. [DOI] [PubMed] [Google Scholar]
- 22.Fuchs S Y, Adler V, Buschmann T, Yin Z, Wu X, Jones S N, Ronai Z. Genes Dev. 1998;12:2658–2663. doi: 10.1101/gad.12.17.2658. [DOI] [PMC free article] [PubMed] [Google Scholar]
- 23.Kubbutat M H G, Vousden K H. Mol Cell Biol. 1997;17:460–468. doi: 10.1128/mcb.17.1.460. [DOI] [PMC free article] [PubMed] [Google Scholar]
- 24.Damalas A, Ben-Ze'ev A, Simcha I, Shtutman M, Leal J F, Zhurinsky J, Geiger B, Oren M. EMBO J. 1999;18:3054–3063. doi: 10.1093/emboj/18.11.3054. [DOI] [PMC free article] [PubMed] [Google Scholar]
- 25.Barak Y, Gottlieb E, Juven-Gershon T, Oren M. Genes Dev. 1994;8:1739–1749. doi: 10.1101/gad.8.15.1739. [DOI] [PubMed] [Google Scholar]
- 26.Saucedo L J, Carstens B P, Seavy S E, Albee L D, Perry M E. Cell Growth Differ. 1998;9:199–130. [PubMed] [Google Scholar]
- 27.Chang Y C, Lee Y S, Tejima T, Tanaka K, Omura S, Heintz N H, Mitsui Y, Magae J. Cell Growth Differ. 1998;9:79–84. [PubMed] [Google Scholar]
- 28.Perry M E, Piette J, Zawadzki J A, Harvey D, Levine A J. Proc Natl Acad Sci USA. 1993;90:11623–11627. doi: 10.1073/pnas.90.24.11623. [DOI] [PMC free article] [PubMed] [Google Scholar]
- 29.Knippschild U, Kolzau T, Deppert W. Oncogene. 1995;11:683–690. [PubMed] [Google Scholar]
- 30.Lu H, Levine A J. Proc Natl Acad Sci USA. 1995;92:5154–5158. doi: 10.1073/pnas.92.11.5154. [DOI] [PMC free article] [PubMed] [Google Scholar]
- 31.Barak Y, Juven T, Haffner R, Oren M. EMBO J. 1993;12:461–468. doi: 10.1002/j.1460-2075.1993.tb05678.x. [DOI] [PMC free article] [PubMed] [Google Scholar]
- 32.Wu X W, Bayle J H, Olson D, Levine A J. Genes Dev. 1993;7:1126–1132. doi: 10.1101/gad.7.7a.1126. [DOI] [PubMed] [Google Scholar]
- 33.Hupp T R, Meek D W, Midgley C A, Lane D P. Cell. 1992;71:875–886. doi: 10.1016/0092-8674(92)90562-q. [DOI] [PubMed] [Google Scholar]
- 34.Bayle J H, Elenbaas B, Levine A J. Proc Natl Acad Sci USA. 1995;92:5729–5733. doi: 10.1073/pnas.92.12.5729. [DOI] [PMC free article] [PubMed] [Google Scholar]
- 35.Wolkowicz R, Peled A, Elkind N B, Rotter V. Proc Natl Acad Sci USA. 1995;92:6842–6846. doi: 10.1073/pnas.92.15.6842. [DOI] [PMC free article] [PubMed] [Google Scholar]
- 36.Hupp T R, Lane D P. J Biol Chem. 1995;270:18165–18174. doi: 10.1074/jbc.270.30.18165. [DOI] [PubMed] [Google Scholar]
- 37.Gu W, Roeder R G. Cell. 1997;90:595–606. doi: 10.1016/s0092-8674(00)80521-8. [DOI] [PubMed] [Google Scholar]
- 38.Waterman M J, Stavridi E S, Waterman J L, Halazonetis T D. Nat Genet. 1998;19:175–178. doi: 10.1038/542. [DOI] [PubMed] [Google Scholar]
- 39.Shieh S Y, Ikeda M, Taya Y, Prives C. Cell. 1997;91:325–334. doi: 10.1016/s0092-8674(00)80416-x. [DOI] [PubMed] [Google Scholar]
- 40.Lambert P F, Kashanchi F, Radonovich M F, Shiekhattar R, Brady J N. J Biol Chem. 1998;273:33048–33053. doi: 10.1074/jbc.273.49.33048. [DOI] [PubMed] [Google Scholar]
- 41.Meek D W. Oncogene. 1999;18:7666–7675. doi: 10.1038/sj.onc.1202951. [DOI] [PubMed] [Google Scholar]
- 42.Shieh S Y, Ahn J, Tamai K, Taya Y, Prives C. Genes Dev. 2000;14:289–300. [PMC free article] [PubMed] [Google Scholar]
- 43.Momand J, Zambetti G P, Olson D C, George D, Levine A J. Cell. 1992;69:1237–1245. doi: 10.1016/0092-8674(92)90644-r. [DOI] [PubMed] [Google Scholar]
- 44.Chen J D, Wu X W, Lin J Y, Levine A J. Mol Cell Biol. 1996;16:2445–2452. doi: 10.1128/mcb.16.5.2445. [DOI] [PMC free article] [PubMed] [Google Scholar]
- 45.Haupt Y, Barak Y, Oren M. EMBO J. 1996;15:1596–1606. [PMC free article] [PubMed] [Google Scholar]
- 46.Thut C J, Chen J L, Klemm R, Tjian R. Science. 1995;267:100–104. doi: 10.1126/science.7809597. [DOI] [PubMed] [Google Scholar]
- 47.Lu H, Levine A J. Proc Natl Acad Sci USA. 1995;92:5154–5158. doi: 10.1073/pnas.92.11.5154. [DOI] [PMC free article] [PubMed] [Google Scholar]
- 48.Thut C J, Goodrich J A, Tjiaan R. Genes Dev. 1997;11:1974–1986. doi: 10.1101/gad.11.15.1974. [DOI] [PMC free article] [PubMed] [Google Scholar]
- 49.Friedberg E C. DNA Repair and Mutagenesis. Washington, DC: Am. Soc. Microbiol.; 1995. [Google Scholar]
- 50.Smith M L, Chen I T, Zhan Q M, O'Connor P M, Fornace A J. Oncogene. 1995;10:1053–1059. [PubMed] [Google Scholar]
- 51.Offer H, Wolkowicz R, Matas D, Blumenstein S, Livneh Z, Rotter V. FEBS Lett. 1999;450:197–204. doi: 10.1016/s0014-5793(99)00505-0. [DOI] [PubMed] [Google Scholar]
- 52.Shieh S Y, Taya Y, Prives C. EMBO J. 1999;18:1815–1823. doi: 10.1093/emboj/18.7.1815. [DOI] [PMC free article] [PubMed] [Google Scholar]
- 53.Unger T, Juven-Gershon T, Moallem E, Berger M, Vogt Sionov R, Lozano G, Oren M, Haupt Y. EMBO J. 1999;18:11805–11814. doi: 10.1093/emboj/18.7.1805. [DOI] [PMC free article] [PubMed] [Google Scholar]
- 54.Chehab N H, Malikzay A, Appel M, Halazonetis T D. Genes Dev. 2000;14:278–288. [PMC free article] [PubMed] [Google Scholar]
- 55.Khosravi R, Maya R, Gottlieb T, Oren M, Shilo Y, Shkedy D. Proc Natl Acad Sci USA. 1999;96:14973–14977. doi: 10.1073/pnas.96.26.14973. [DOI] [PMC free article] [PubMed] [Google Scholar]
- 56.Pomerantz J, Schreiber-Agus N, Liegeois N J, Silverman A, Alland L, Chin L, Potes J, Chen K, Orlow I, Lee H W, et al. Cell. 1998;92:713–723. doi: 10.1016/s0092-8674(00)81400-2. [DOI] [PubMed] [Google Scholar]
- 57.Sherr C J. Genes Dev. 1998;12:2984–2991. doi: 10.1101/gad.12.19.2984. [DOI] [PubMed] [Google Scholar]
- 58.Roth J, Dobbelstein M, Freedman D A, Shenk T, Levine A J. EMBO J. 1998;17:554–564. doi: 10.1093/emboj/17.2.554. [DOI] [PMC free article] [PubMed] [Google Scholar]
- 59.Lain S, Xirodimas D, Lane D P. Exp Cell Res. 1999;253:315–324. doi: 10.1006/excr.1999.4672. [DOI] [PubMed] [Google Scholar]
- 60.Jimenez G S, Khan S H, Stommel J M, Wahl G M. Oncogene. 1999;18:7656–7665. doi: 10.1038/sj.onc.1203013. [DOI] [PubMed] [Google Scholar]
- 61.Weber J D, Taylor L J, Roussel M F, Sherr C J, Bar-Sagi D. Nat Cell Biol. 1999;1:20–26. doi: 10.1038/8991. [DOI] [PubMed] [Google Scholar]
- 62.Tao W, Levine A J. Proc Natl Acad Sci USA. 1999;96:6937–6941. doi: 10.1073/pnas.96.12.6937. [DOI] [PMC free article] [PubMed] [Google Scholar]
- 63.Rogakou E P, Boon C, Redon C, Bonner W M. J Cell Biol. 1999;146:905–915. doi: 10.1083/jcb.146.5.905. [DOI] [PMC free article] [PubMed] [Google Scholar]
- 64.Kastan M B, Onyekwere D, Sidransky B, Vogelstein B, Craig R W. Cancer Res. 1991;51:6304–6311. [PubMed] [Google Scholar]
- 65.Di Leonardo A, Linke S P, Clarkin K, Wahl G. Genes Dev. 1994;8:2540–2551. doi: 10.1101/gad.8.21.2540. [DOI] [PubMed] [Google Scholar]
- 66.Linke S P, Clarkin K C, Wahl G M. Cancer Res. 1997;57:1171–1179. [PubMed] [Google Scholar]
- 67.Goldbeter A, Koshland D E., Jr Proc Natl Acad Sci USA. 1981;78:6840–6844. doi: 10.1073/pnas.78.11.6840. [DOI] [PMC free article] [PubMed] [Google Scholar]
- 68.Huang C-Y F, Ferrel J E., Jr Proc Natl Acad Sci USA. 1996;93:10078–10083. doi: 10.1073/pnas.93.19.10078. [DOI] [PMC free article] [PubMed] [Google Scholar]
- 69.Collister M, Lane D P, Kuehl B L. Carcinogenesis. 1999;19:2115–2120. doi: 10.1093/carcin/19.12.2115. [DOI] [PubMed] [Google Scholar]
- 70.Ohnishi T, Wang X, Takahashi A, Ohnishi K, Ejima Y. Radiat Res. 1999;151:368–372. [PubMed] [Google Scholar]
- 71.Chen X, Ko L J, Jayaraman L, Prives C. Genes Dev. 1996;10:2438–2451. doi: 10.1101/gad.10.19.2438. [DOI] [PubMed] [Google Scholar]
- 72.Ronen D, Schwartz D, Teitz Y, Goldfinger N, Rotter V. Cell Growth Differ. 1996;7:21–30. [PubMed] [Google Scholar]
- 73.Zhao R, Gish K, Murphy M, Yin Y, Notterman D, Hoffman W H, Tom E, Mack D H, Levine A J. Genes Dev. 2000;14:981–993. [PMC free article] [PubMed] [Google Scholar]


