Full Text
The Full Text of this article is available as a PDF (100.5 KB).
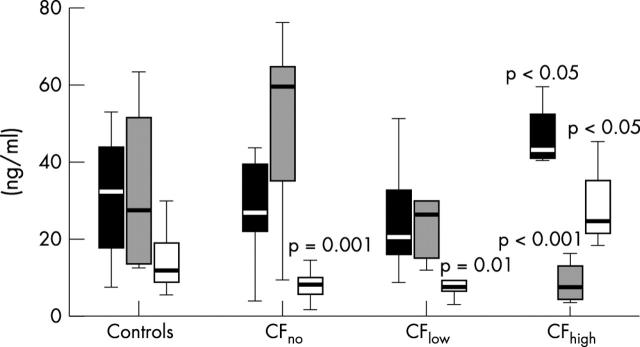
Figure 1 .
Boxplot showing total osteocalcin (t-OC in black), undercarboxylated osteocalcin (u-OC in grey), and carboxylated osteocalcin (c-OC in white) for vitamin K supplementation in CF patients, compared to healthy controls. Vitamin K supplementation is shown in three different groups: CFno = no supplementation; CFlow = <0.25 mg/day; and CFhigh = ⩾1 mg/day. Significant p values are shown.
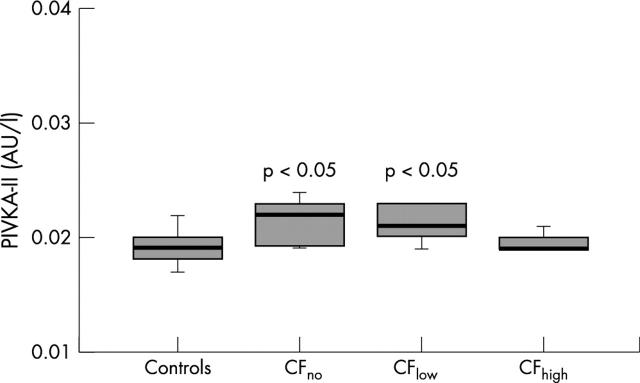
Figure 2 .
Boxplot showing PIVKA-II concentrations in CF patients with three different doses of vitamin K supplementation, compared to healthy controls. Significant p values are shown.


