Abstract
Aims: To obtain age references for sitting height (SH), leg length (LL), and SH/H ratio in the Netherlands; to evaluate how SH standard deviation score (SDS), LL SDS, SH/H SDS, and SH/LL SDS are related to height SDS; and to study the usefulness of height corrected SH/H cut-off lines to detect Marfan syndrome and hypochondroplasia.
Methods: Cross-sectional data on height and sitting height were collected from 14 500 children of Dutch origin in the age range 0–21 years. Reference SD charts were constructed by the LMS method. Correlations were analysed in three age groups. SH/H data from patients with Marfan syndrome and genetically confirmed hypochondroplasia were compared with height corrected SH/H references.
Results: A positive association was observed between H SDS, SH SDS, and LL SDS in all age groups. There was a negative correlation between SH/H SDS and height SDS. In short children with a height SDS <–2 SDS, a cut-off limit of +2.5 SD leads to a more acceptable percentage of false positive results. In exceptionally tall children, a cut-off limit of –2.2 SDS can be used. Alternatively, a nomogram of SH/H SDS versus H SDS can be helpful. The sensitivity of the height corrected cut-off lines for hypochondroplasia was 80% and for Marfan syndrome only 30%.
Conclusions: In exceptionally short or tall children, the dependency of the SH/H ratio (SDS) on height SDS has to be taken into consideration in the evaluation of body proportions. The sensitivity of the cut-off lines for hypochondroplasia is fair.
Full Text
The Full Text of this article is available as a PDF (126.1 KB).
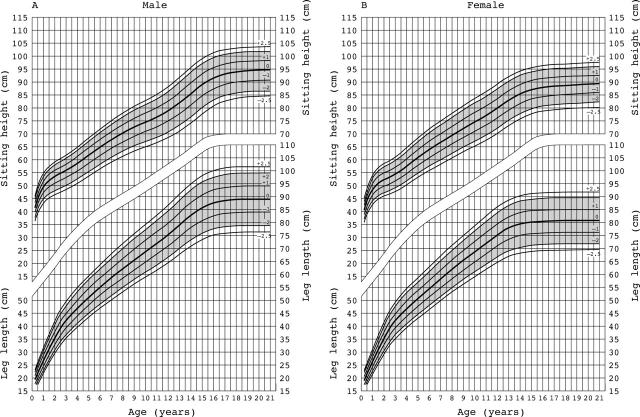
Figure 1.
Sitting height and leg length for age for (A) Dutch boys and (B) Dutch girls aged 0–21 years, indicating the 0,±1,±2,±2.5 SD lines.
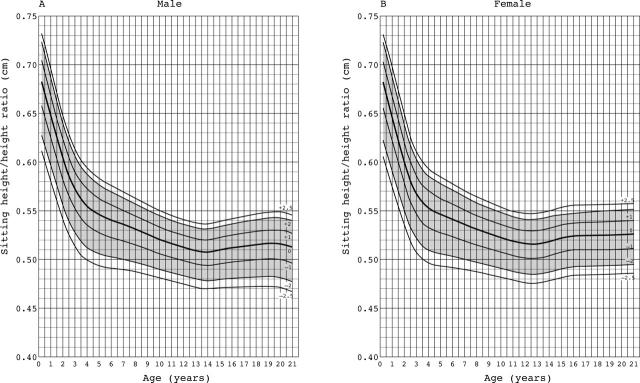
Figure 2.
Sitting height/height ratio for age for (A) Dutch boys and (B) Dutch girls aged 0–21 years, indicating the 0,±1,±2, 2.5 SD lines.
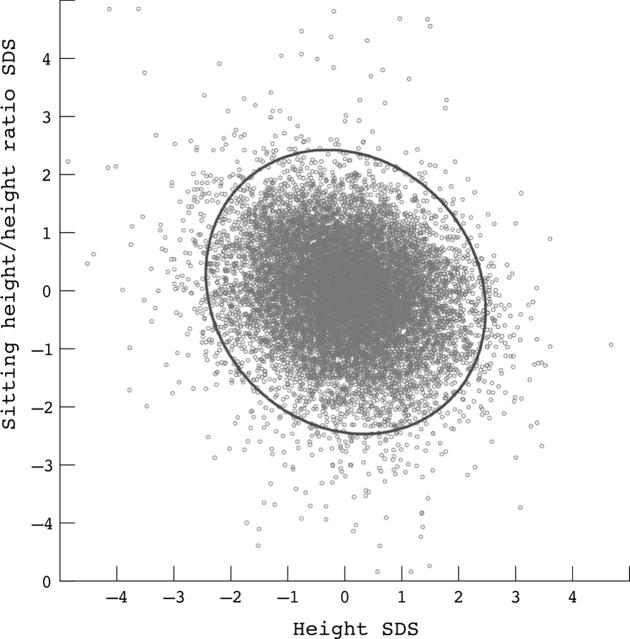
Figure 3.
A scatter plot of SH/H SDS versus height SDS.
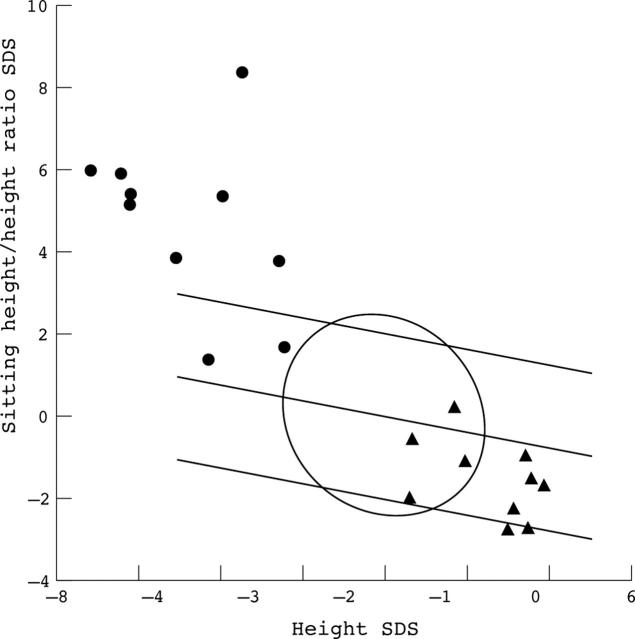
Figure 4.
A nomogram to assess for a given height SDS the normal range of SH/H SDS, indicating the ellipse, the regression line, and two lines at 2 SDS units away of the regression line. Triangles represent Marfan syndrome, circles represent hypochondroplasia.
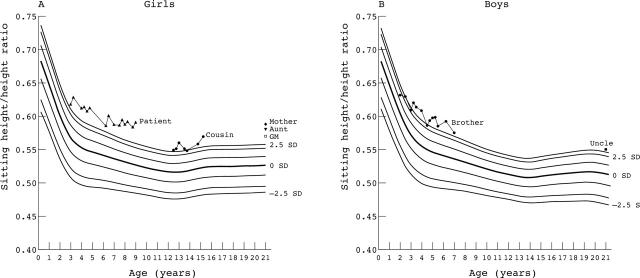
Figure 5.
SH/H data of the members of a family, with an HCH mutation in the FGFR3 gene on the maternal side, that caused a mild hypochondroplasia with a variable expression pattern. (A) SH/H index for the index case, her cousin, her mother, her aunt, and grandmother. (B) SH/H index for the brother and an uncle of the index case.
Selected References
These references are in PubMed. This may not be the complete list of references from this article.
- Bogin B., Smith P., Orden A. B., Varela Silva M. I., Loucky J. Rapid change in height and body proportions of Maya American children. Am J Hum Biol. 2002 Nov-Dec;14(6):753–761. doi: 10.1002/ajhb.10092. [DOI] [PubMed] [Google Scholar]
- Brinkers J. M., Lamoré P. J., Gevers E. F., Boersma B., Wit J. M. The effect of oestrogen treatment on body proportions in constitutionally tall girls. Eur J Pediatr. 1994 Apr;153(4):237–240. doi: 10.1007/BF01954509. [DOI] [PubMed] [Google Scholar]
- Cheng J. C., Leung S. S., Lau J. Anthropometric measurements and body proportions among Chinese children. Clin Orthop Relat Res. 1996 Feb;(323):22–30. doi: 10.1097/00003086-199602000-00004. [DOI] [PubMed] [Google Scholar]
- Cole T. J., Green P. J. Smoothing reference centile curves: the LMS method and penalized likelihood. Stat Med. 1992 Jul;11(10):1305–1319. doi: 10.1002/sim.4780111005. [DOI] [PubMed] [Google Scholar]
- Dangour A. D., Schilg S., Hulse J. A., Cole T. J. Sitting height and subischial leg length centile curves for boys and girls from Southeast England. Ann Hum Biol. 2002 May-Jun;29(3):290–305. doi: 10.1080/03014460110085331. [DOI] [PubMed] [Google Scholar]
- Fredriks A. M., van Buuren S., Burgmeijer R. J., Meulmeester J. F., Beuker R. J., Brugman E., Roede M. J., Verloove-Vanhorick S. P., Wit J. M. Continuing positive secular growth change in The Netherlands 1955-1997. Pediatr Res. 2000 Mar;47(3):316–323. doi: 10.1203/00006450-200003000-00006. [DOI] [PubMed] [Google Scholar]
- Gerver W. J., De Bruin R. Relationship between height, sitting height and subischial leg length in Dutch children: presentation of normal values. Acta Paediatr. 1995 May;84(5):532–535. doi: 10.1111/j.1651-2227.1995.tb13688.x. [DOI] [PubMed] [Google Scholar]
- Herber S. M., Milner R. D. Sitting heights in Sheffield, 1985: have standards changed? Acta Paediatr Scand. 1987 Sep;76(5):818–823. doi: 10.1111/j.1651-2227.1987.tb10570.x. [DOI] [PubMed] [Google Scholar]
- Hertel N. T., Scheike T., Juul A., Main K. M., Holm K., Bach-Mortensen N., Skakkebaek N. E., Müller J. R. Kropsproportioner hos danske børn. Kurver for siddehøjde, siddehøjderatio, subiskial benloengde og armspoend. Ugeskr Laeger. 1995 Dec 4;157(49):6876–6881. [PubMed] [Google Scholar]
- Tanner J. M., Hayashi T., Preece M. A., Cameron N. Increase in length of leg relative to trunk in Japanese children and adults from 1957 to 1977: comparison with British and with Japanese Americans. Ann Hum Biol. 1982 Sep-Oct;9(5):411–423. doi: 10.1080/03014468200005951. [DOI] [PubMed] [Google Scholar]
- Tanner J. M. Principles of growth standards. Acta Paediatr Scand. 1990 Oct;79(10):963–967. doi: 10.1111/j.1651-2227.1990.tb11361.x. [DOI] [PubMed] [Google Scholar]
- Wales J. K., Herber S. M., Taitz L. S. Height and body proportions in child abuse. Arch Dis Child. 1992 May;67(5):632–635. doi: 10.1136/adc.67.5.632. [DOI] [PMC free article] [PubMed] [Google Scholar]
- Yun D. J., Yun D. K., Chang Y. Y., Lim S. W., Lee M. K., Kim S. Y. Correlations among height, leg length and arm span in growing Korean children. Ann Hum Biol. 1995 Sep-Oct;22(5):443–458. doi: 10.1080/03014469500004112. [DOI] [PubMed] [Google Scholar]
- van Buuren S., Fredriks M. Worm plot: a simple diagnostic device for modelling growth reference curves. Stat Med. 2001 Apr 30;20(8):1259–1277. doi: 10.1002/sim.746. [DOI] [PubMed] [Google Scholar]


