

Abstract
AIMS—To simulate the central binocular visual field using results from merged left and right monocular Humphrey fields. To assess the agreement between the simulation and the binocular Humphrey Esterman visual field test (EVFT). METHOD—59 consecutive patients with bilateral glaucoma each recorded Humphrey 24-2 fields for both eyes and binocular EVFT on the same visit. EVFT results were used to identify patients exhibiting at least one defect (<10 dB) within the central 20° of the binocular field. This criterion is relevant to a patient's legal fitness to drive in the UK. Individual sensitivity values from monocular fields are merged to generate a simulated central binocular field. Results are displayed as a grey scale and as symbols representing defects at the <10 dB level. Agreement between patients failing the criterion using the simulation and the EVFT was evaluated. RESULTS—Substantial agreement was observed between the methods in classifying patients with at least one defect (<10 dB) within the central binocular field (kappa 0.81; SE 0.09). Patients failing this criterion using the EVFT results were identified by the binocular simulation with high levels of sensitivity (100%) and specificity (86%). CONCLUSIONS—Excellent agreement exists between the simulated binocular results and EVFT in classifying glaucomatous patients with central binocular defects. A rapid estimate of a patient's central binocular field and visual functional capacity can be ascertained without extra perimetric examination. Keywords: glaucoma; binocular visual fields; Esterman visual field test
Full Text
The Full Text of this article is available as a PDF (247.9 KB).
Figure 1 .

Esterman visual field test output from the Humphrey visual field analyser for one of the sample patients. A circle representing the central area 20° from fixation has been superimposed. There are 24 test locations within the central area. This patient has five locations with sensitivity values below 10 dB within this area and is therefore classified as exhibiting "At least one defect (<10 dB)" using the EVFT analysis.
Figure 2 .
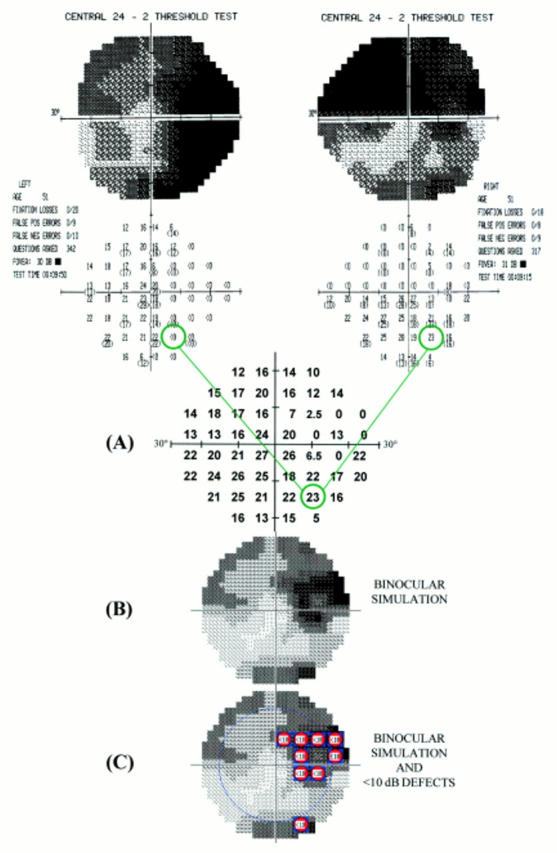
A schematic diagram describing the binocular simulation technique using data from the same patient shown in Figure 1. Humphrey 24-2 fields from the left and right eyes are merged point by point. The maximum sensitivity from each of the two corresponding points is determined to give an estimate of sensitivity at that point as if the subject was viewing in the binocular mode (A). The resultant simulated central binocular field can be displayed as Humphrey type grey scale (B). The central area (20° from fixation) can be highlighted and individual locations with sensitivity values below 10 dB are denoted by symbols (C). Note the similarity of the locations exhibiting defects (<10 dB) compared with the EVFT output in Figure 1.
Figure 3 .
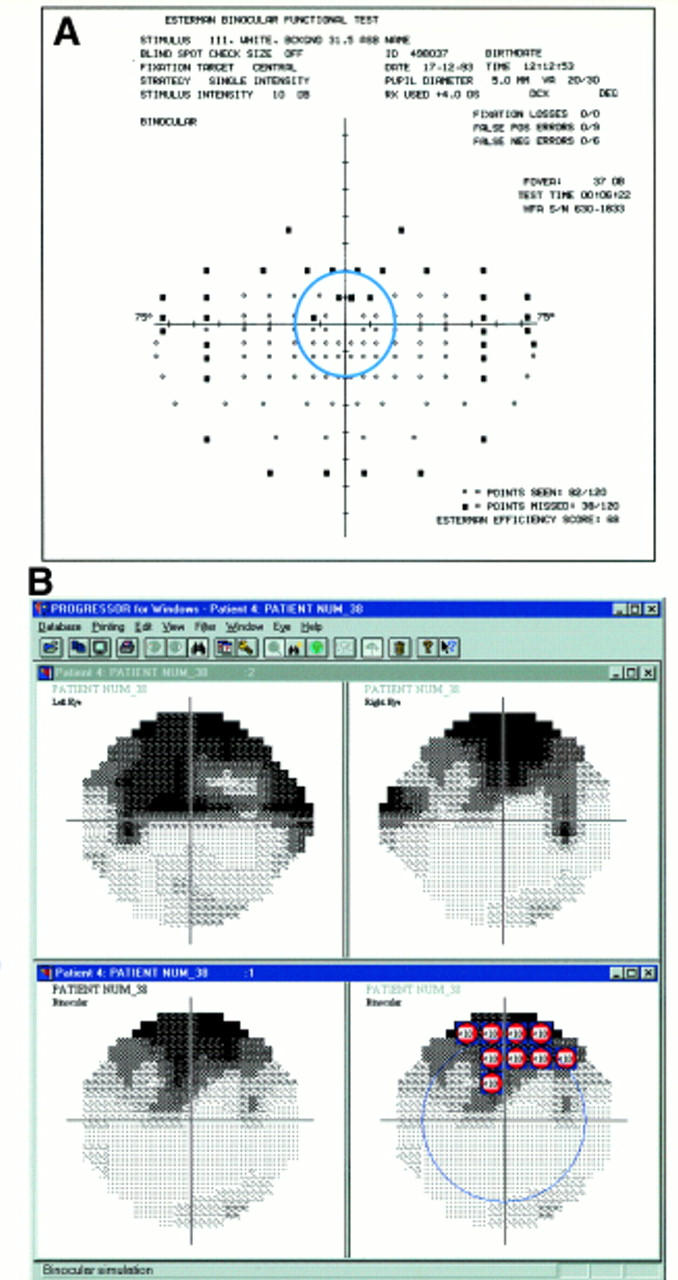
EVFT output for a sample patient is shown in (A). A circle has been superimposed to denote the central 20°. Results from the binocular simulation implemented by the PROGRESSOR for Windows software (Institute of Ophthalmology, London) are shown for the same patient in (B). The sensitivity of the left and right 24-2 fields are shown as Humphrey type grey scales. The lower panels show the results from the binocular simulation as Humphrey type grey scale with and without superimposed symbols denoting point by point EVFT type defects (<10 dB). The blue circle on the display indicates the central 20° area. This patient clearly demonstrates "At least one defect (<10 dB)" using the EVFT (A) and similarly "At least one defect (<10 dB)" using the binocular simulation (B).
Figure 4 .
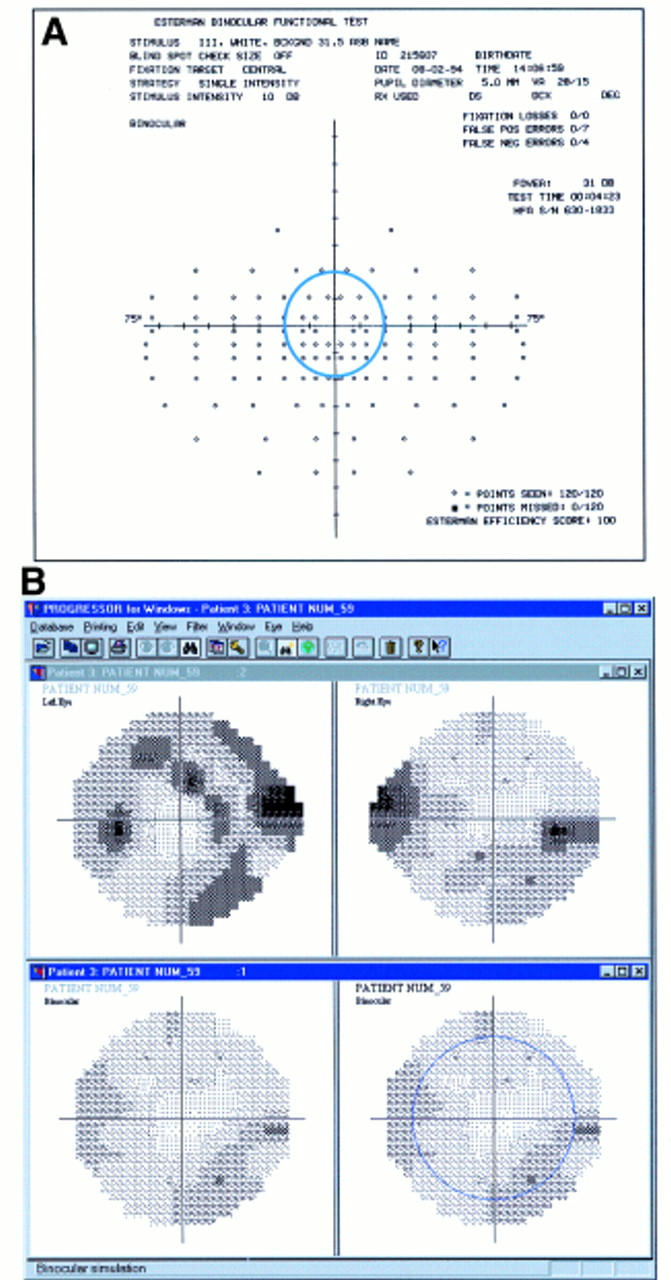
EVFT output (A) and results from the binocular simulation (B) implemented by the PROGRESSOR for Windows software (Institute of Ophthalmology, London) are shown for another sample patient. The lower panels show the results from the binocular simulation as Humphrey type grey scale with and without superimposed symbols denoting point by point EVFT type defects (<10 dB). This patient demonstrates "No defects" using the EVFT (A). This patient also demonstrates "No defects" using the binocular simulation (B) despite the presence of areas of visual field damage in each monocular field.
Selected References
These references are in PubMed. This may not be the complete list of references from this article.
- Asman P., Heijl A. Glaucoma Hemifield Test. Automated visual field evaluation. Arch Ophthalmol. 1992 Jun;110(6):812–819. doi: 10.1001/archopht.1992.01080180084033. [DOI] [PubMed] [Google Scholar]
- Bickler-Bluth M., Trick G. L., Kolker A. E., Cooper D. G. Assessing the utility of reliability indices for automated visual fields. Testing ocular hypertensives. Ophthalmology. 1989 May;96(5):616–619. doi: 10.1016/s0161-6420(89)32840-5. [DOI] [PubMed] [Google Scholar]
- Charman W. N. Vision and driving--a literature review and commentary. Ophthalmic Physiol Opt. 1997 Sep;17(5):371–391. [PubMed] [Google Scholar]
- Esterman B. Functional scoring of the binocular field. Ophthalmology. 1982 Nov;89(11):1226–1234. doi: 10.1016/s0161-6420(82)34647-3. [DOI] [PubMed] [Google Scholar]
- Fitzke F. W., Crabb D. P., McNaught A. I., Edgar D. F., Hitchings R. A. Image processing of computerised visual field data. Br J Ophthalmol. 1995 Mar;79(3):207–212. doi: 10.1136/bjo.79.3.207. [DOI] [PMC free article] [PubMed] [Google Scholar]
- Fitzke F. W., Hitchings R. A., Poinoosawmy D., McNaught A. I., Crabb D. P. Analysis of visual field progression in glaucoma. Br J Ophthalmol. 1996 Jan;80(1):40–48. doi: 10.1136/bjo.80.1.40. [DOI] [PMC free article] [PubMed] [Google Scholar]
- Henson D. B., Evans J., Chauhan B. C., Lane C. Influence of fixation accuracy on threshold variability in patients with open angle glaucoma. Invest Ophthalmol Vis Sci. 1996 Feb;37(2):444–450. [PubMed] [Google Scholar]
- Katz J., Quigley H. A., Sommer A. Repeatability of the Glaucoma Hemifield Test in automated perimetry. Invest Ophthalmol Vis Sci. 1995 Jul;36(8):1658–1664. [PubMed] [Google Scholar]
- Katz J., Sommer A. Reliability indexes of automated perimetric tests. Arch Ophthalmol. 1988 Sep;106(9):1252–1254. doi: 10.1001/archopht.1988.01060140412043. [DOI] [PubMed] [Google Scholar]
- Landis J. R., Koch G. G. The measurement of observer agreement for categorical data. Biometrics. 1977 Mar;33(1):159–174. [PubMed] [Google Scholar]
- McNaught A. I., Crabb D. P., Fitzke F. W., Hitchings R. A. Modelling series of visual fields to detect progression in normal-tension glaucoma. Graefes Arch Clin Exp Ophthalmol. 1995 Dec;233(12):750–755. doi: 10.1007/BF00184085. [DOI] [PubMed] [Google Scholar]
- Mills R. P., Drance S. M. Esterman disability rating in severe glaucoma. Ophthalmology. 1986 Mar;93(3):371–378. doi: 10.1016/s0161-6420(86)33732-1. [DOI] [PubMed] [Google Scholar]
- O'Brien C., Wild J. M. Automated perimetry in glaucoma--room for improvement? Br J Ophthalmol. 1995 Mar;79(3):200–201. doi: 10.1136/bjo.79.3.200. [DOI] [PMC free article] [PubMed] [Google Scholar]
- Quigley H. A., Tielsch J. M., Katz J., Sommer A. Rate of progression in open-angle glaucoma estimated from cross-sectional prevalence of visual field damage. Am J Ophthalmol. 1996 Sep;122(3):355–363. doi: 10.1016/s0002-9394(14)72062-8. [DOI] [PubMed] [Google Scholar]
- Wood J. M., Collins M. J., Carkeet A. Regional variations in binocular summation across the visual field. Ophthalmic Physiol Opt. 1992 Jan;12(1):46–51. [PubMed] [Google Scholar]
- Wässle H., Grünert U., Röhrenbeck J., Boycott B. B. Retinal ganglion cell density and cortical magnification factor in the primate. Vision Res. 1990;30(11):1897–1911. doi: 10.1016/0042-6989(90)90166-i. [DOI] [PubMed] [Google Scholar]