Abstract
BACKGROUND—Scanning laser Doppler flowmetry (SLDF) enables the measurement of the laser Doppler frequency shift in retinal tissue. This process allows the quantification of retinal and optic nerve head perfusion in an area of 2.7 mm × 0.7 mm within 2 seconds and with a spatial resolution of 10 µm × 10 µm. Owing to the local heterogeneity of the retinal microcirculation itself and to heart associated pulsation the capillary retinal blood flow depends on location and time. Because of technical limitations measurements of flow are only valid in retinal points with adequate brightness and focus, and away from big vessels. To include the heart beat associated pulsation and the spatial heterogeneity of retinal blood flow into the evaluation of blood flow an algorithm was developed examining automatically the whole SLDF perfusion image. AIM—To report intraobserver reliability and interobserver reliability of a new method for analysing automatically full field perfusion images. METHOD—The base of blood flow calculation by the automatic full field perfusion image analyser (AFFPIA) was 16 384 intensity time curves of all pixels of the whole perfusion image gained by the SLDF. AFFPIA calculates the Doppler frequency shift and the haemodynamic variables flow, volume, and velocity of each pixel. The resulting perfusion image was processed with respect to (1) underexposed and overexposed pixels, (2) saccades, and (3) the retinal vessel tree. The rim area and the saccades were marked interactively by the operator. The capillaries and vessels of the retinal vessel tree were identified automatically by pattern analysis. Retinal vessels with a diameter greater than 30 µm, underexposed or overexposed areas, and saccades were excluded automatically. Based on the whole perfusion image total mean flow, total mean volume, total mean velocity, standard deviation, cumulative distribution curve of flow, and the capillary pulsation index were calculated automatically. Heart beat associated pulsation of capillary blood flow was estimated by plotting the mean capillary flow of each horizontal line against time. Intraobserver reliability was estimated by measuring 10 eyes of 10 subjects on five different days by one observer. Interobserver reliability of AFFPIA was evaluated by analysing 10 perfusion maps by five different operators. To find a baseline of retinal blood flow, perfusion maps of 67 eyes of normal subjects with a mean age of 40.4 (SD 15) years were evaluated by AFFPIA. RESULTS—The coefficient of reliability of the intraobserver reproducibility of flow was 0.74. The coefficient of reliability of the interobserver reproducibility was 0.95. The juxtapapillary retinal capillary flow was temporally 484 (SD 125), nasally 450 (117); the rim area capillary flow was 443 (110). The mean capillary pulsation index of retinal flow was 0.56 (0.14). CONCLUSION—Retinal blood flow evaluation by the AFFPIA increases significantly the interobserver reliability compared with conventional evaluation of 100 µm × 100 µm areas in SLDF images with the original Heidelberg retina flowmeter software. The intraobserver reliability of AFFPIA was in the same range as conventional evaluation. Keywords: retinal blood flow; optic nerve head blood flow; scanning laser Doppler flowmetry
Full Text
The Full Text of this article is available as a PDF (299.2 KB).
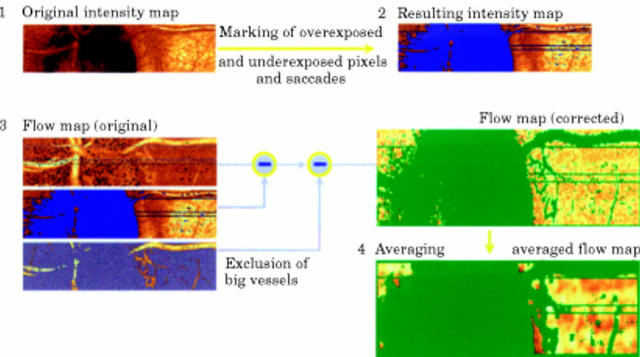
Figure 1 .
Graphic representation of the image processing procedure of the automatic full field perfusion image analyser (AFFPIA).
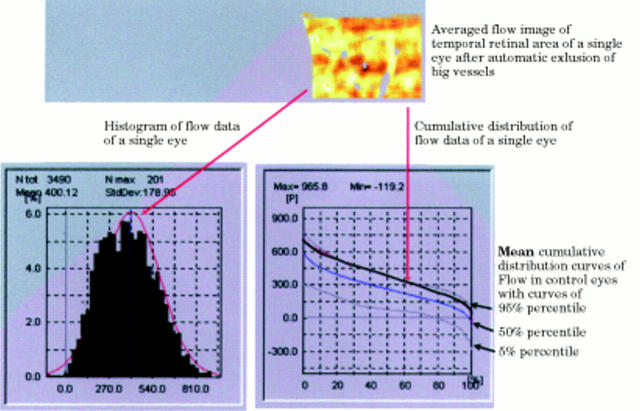
Figure 2 .
Automatic statistical analysis and presentation of blood flow of the temporal area, with the histogram of all flow values, and the cumulative frequency distribution curve of flow of a single eye in comparison with the mean cumulative frequency distribution curve of the control group with the 5% percentile curve and the 95% percentile curve. Note that the cumulative frequency distribution curve of the examined eye lies in the high 90s. The 5% percentile curve and the 95% percentile curve define the normal range of flow.
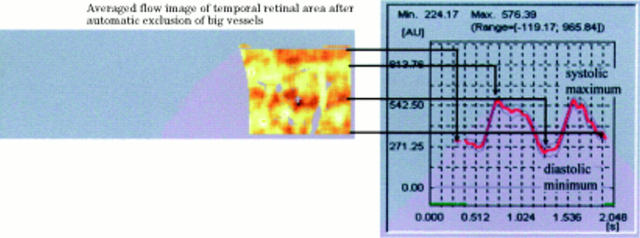
Figure 3 .
Graphic presentation of the heart beat associated pulsation of capillary blood flow by plotting the average flow of each horizontal line against time. The pulsation index, P, was calculated by [P=systolic flow − diastolic flow)/systolic flow].
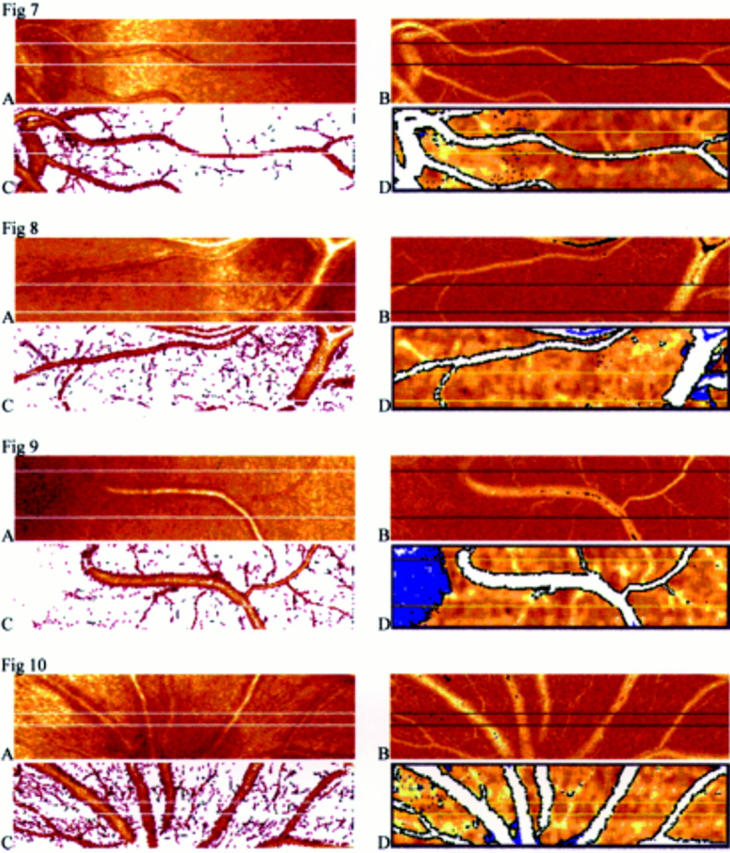
Figures 7-10 Images of the posterior pole of four eyes gained by reflectivity measurement (A), by Doppler measurement (B), after automatic vessel detection of capillaries and vessels (C), and after automatic vessel detection of vessels greater than 30 µm (D).
Figure 4 .
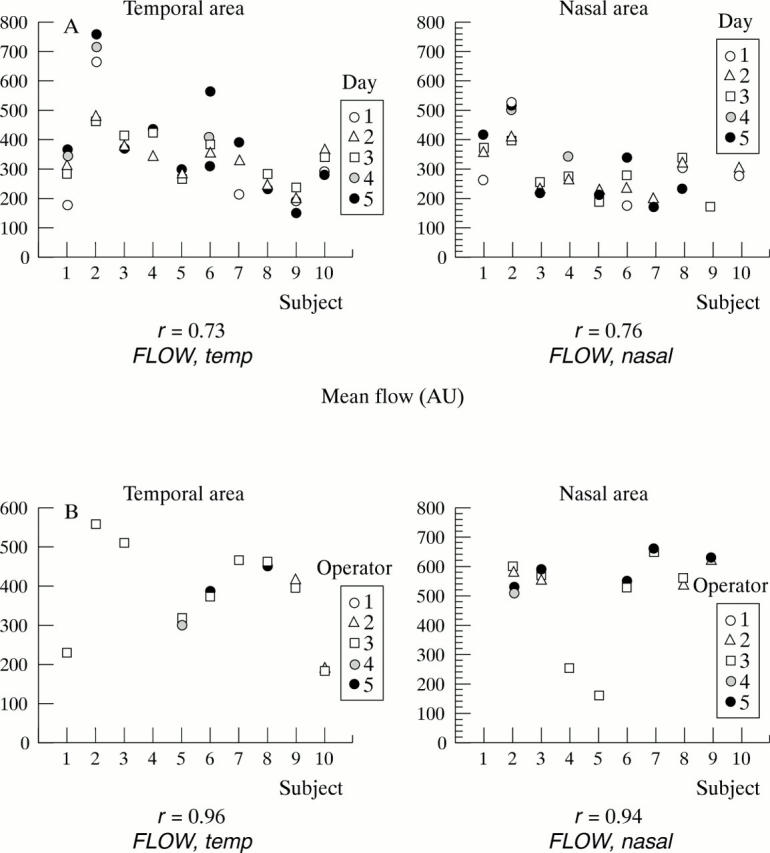
(A) Intraobserver reliability: repeated measurements of mean flow of 10 subjects on 5 different days measured by one operator. (B) Interobserver reliability: repeated calculations of mean flow of perfusion maps of 10 separate subjects performed by five operators using AFFPIA.
Figure 5 .
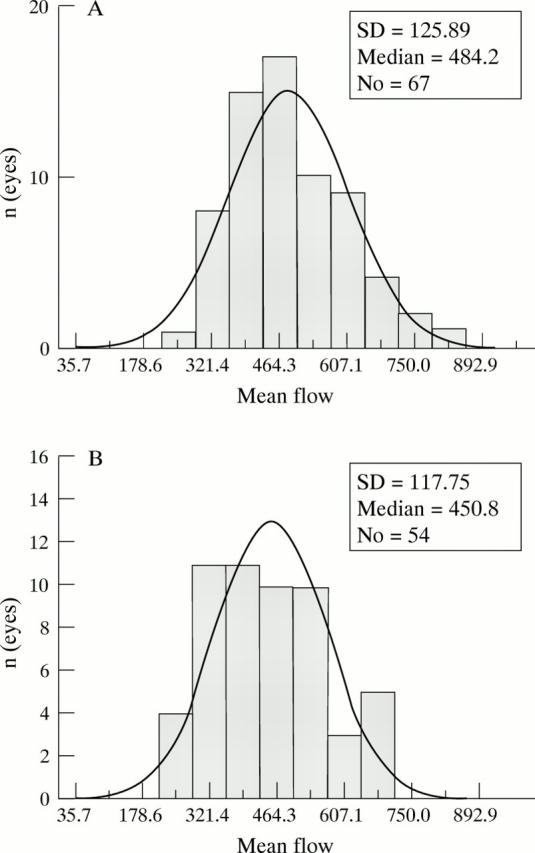
(A) Histogram of mean flow values of the nasal area of 54 normal subjects. (B) Histogram of mean flow values of the temporal area of 67 normal subjects.
Figure 6 .
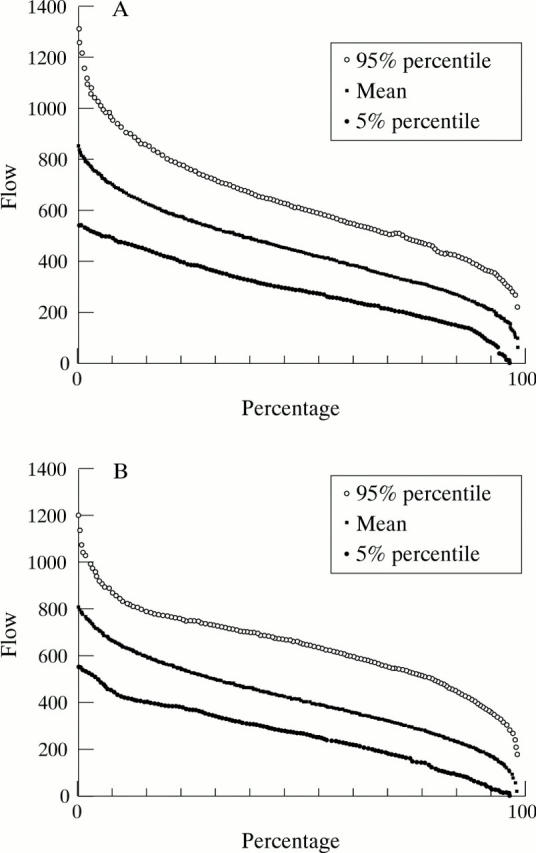
(A) The cumulative frequency distribution of flow values of all valid pixels of the nasal area of 54 normal eyes with the 5% percentile and 95% percentile curve. 90% of all flow values of the control group are situated within this range. (B) The cumulative frequency distribution of flow values of all valid pixels of the temporal area of 67 normal eyes with the 5% percentile and 95% percentile curve. 90% of all flow data of the control group are situated within this range
Selected References
These references are in PubMed. This may not be the complete list of references from this article.
- Chauhan B. C., Smith F. M. Confocal scanning laser Doppler flowmetry: experiments in a model flow system. J Glaucoma. 1997 Aug;6(4):237–245. [PubMed] [Google Scholar]
- Michelson G., Groh M., Langhans M., Schmauss B. Zweidimensionale Kartierung der retinalen und papillären Mikrozirkulation mittels Scanning-Laser-Doppler-Flowmetrie. Klin Monbl Augenheilkd. 1995 Sep;207(3):180–190. doi: 10.1055/s-2008-1035365. [DOI] [PubMed] [Google Scholar]
- Michelson G., Schmauss B., Langhans M. J., Harazny J., Groh M. J. Principle, validity, and reliability of scanning laser Doppler flowmetry. J Glaucoma. 1996 Apr;5(2):99–105. [PubMed] [Google Scholar]
- Michelson G., Schmauss B. Two dimensional mapping of the perfusion of the retina and optic nerve head. Br J Ophthalmol. 1995 Dec;79(12):1126–1132. doi: 10.1136/bjo.79.12.1126. [DOI] [PMC free article] [PubMed] [Google Scholar]
- Riva C. E., Harino S., Petrig B. L., Shonat R. D. Laser Doppler flowmetry in the optic nerve. Exp Eye Res. 1992 Sep;55(3):499–506. doi: 10.1016/0014-4835(92)90123-a. [DOI] [PubMed] [Google Scholar]
- Strenn K., Menapace R., Rainer G., Findl O., Wolzt M., Schmetterer L. Reproducibility and sensitivity of scanning laser Doppler flowmetry during graded changes in PO2. Br J Ophthalmol. 1997 May;81(5):360–364. doi: 10.1136/bjo.81.5.360. [DOI] [PMC free article] [PubMed] [Google Scholar]


