Full Text
The Full Text of this article is available as a PDF (266.6 KB).
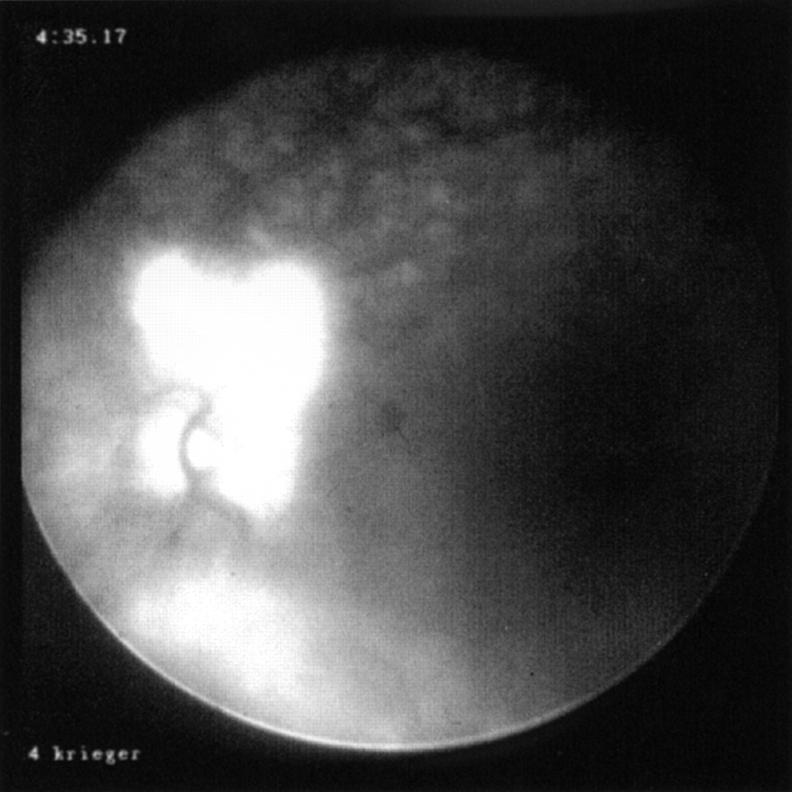
Figure 1 .
Left fluorescein angiogram demonstrating leakage from disc new vessels before systemic steroid treatment.
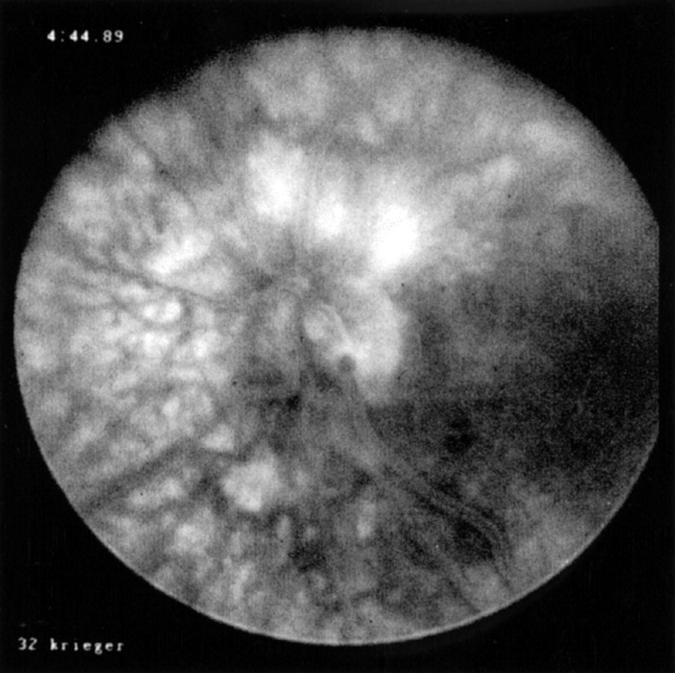
Figure 2 .
Fluorescein angiogram demonstrating less fluorescein leakage after 2 weeks of oral steroids. This photograph is of a later fluorescein circulation time than Figure 1 (by 9 seconds). Note clearer view resulting from reduced inflammatory media opacities.


