Abstract
AIMS—The Heidelberg retina tomograph (HRT) is a scanning laser ophthalmoscope with confocal optics. The reproducibility of the optic nerve head topography is accurate and reliable. The authors describe a new technique for the assessment of macular thickening by volumetric quantification and present the results of its reproducibility in normal subjects. METHODS—Topographic images of the macula, centred on the fovea were obtained in one eye of 44 normal subjects. The volumes above the reference plane bound by a 1 mm, 2 mm, and 3 mm diameter circle were measured. The reference plane was adjusted to the lowest point of the height variation of the contour line at each examination. The reproducibility of repeated measurements within a 2 mm diameter circle was assessed in 20 eyes selected at random. Three HRT scans of each eye were obtained. The measurements of volume above reference plane of each scan were repeated three times on three separate days. RESULTS—The intrascan coefficients of variability measured 7.12-9.57%. The 95% confidence interval for the geometric mean ratio of single volume measurements was 0.92 to 1.24 for scans 1 and 2, 0.89 to 1.17 for scans 1 and 3, and 0.81 to 1.12 for scans 2 and 3. When the mean of three measurements of one scan were compared with the mean of three measurements of a second scan, the 95% confidence interval for their geometric mean ratio was 0.89 to 1.20 for scans 1 and 2, 0.89 to 1.16 for scans 1 and 3, and 0.84 to 1.13 for scans 2 and 3. The average standard deviation (SD) for one measurement per scan was 0.02 mm3, and 0.019 mm3 for two or three measurements per scan. Linear regression demonstrated a significant increase in SD as volumetric measurements increased (p = 0.003). Age did not significantly affect the SD of volumetric measurements (p = 0.797). The authors found no significant differences in volumetric measurements across all ages for all three circles (p = 0.314, p = 0.471, p = 0.267). CONCLUSION—Good reproducibility for volumetric measurements at the macula was found with the HRT using the above technique in normal subjects. This method may be extremely useful for the identification and quantification of diabetic macular oedema and for monitoring the effects of argon laser photocoagulation. Keywords: Heidelberg retina tomograph; volume above reference plane; reproducibility; macula
Full Text
The Full Text of this article is available as a PDF (180.5 KB).
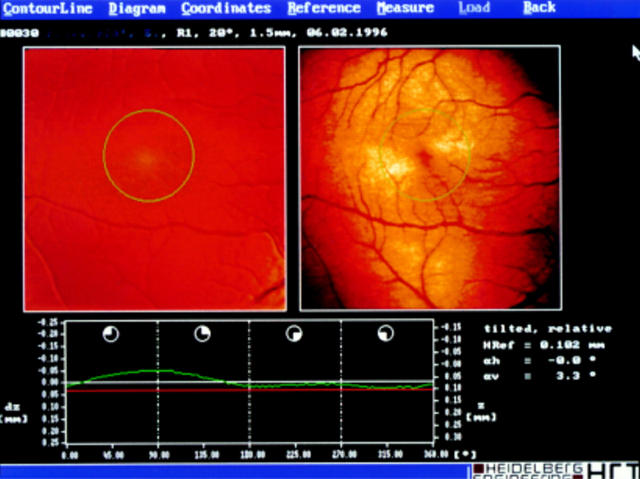
Figure 1 .
HRT scan of a normal macula in a healthy 36 year old man. The height variation of the contour line is shown in green and the reference plane (in red) is adjusted to the lowest point of the contour line. The scan is centred at the fovea. The circle centre is the fovea, the diameter is 2 mm. The scale (25 mm) is given on the left hand vertical axis.
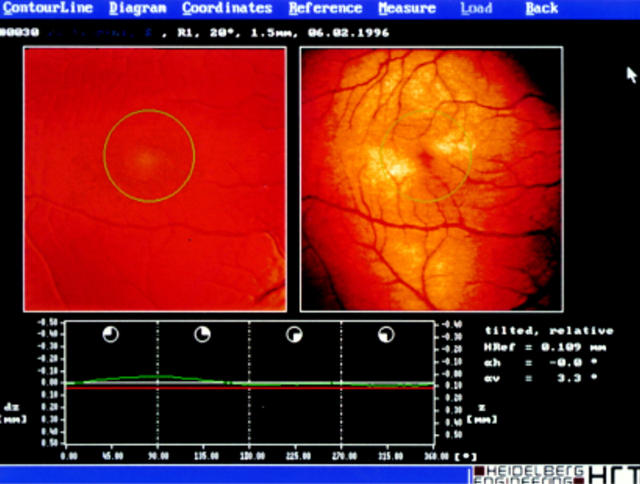
Figure 2 .
HRT scan of the same macula given in Figure 1. The scale is adjusted to 50 mm, the contour line is almost a perfect straight line.
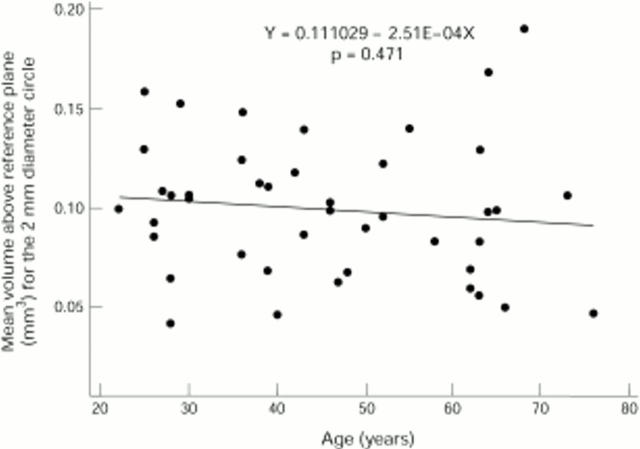
Figure 3 .
Regression line of the mean volume above reference plane of three examinations of a 2 mm diameter circle v age. There is poor correlation between the volumetric measurements and age (r = −0.112, p >0.1). The slope of the regression line is not significant (p = 0.471) indicating no significant variability in volumes over the age range.
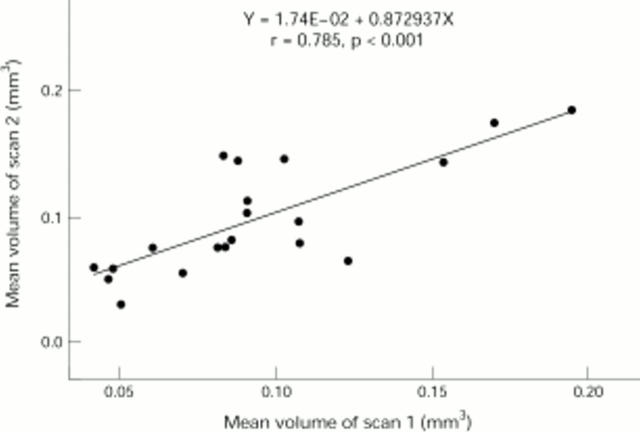
Figure 4 .
There is good correlation between the mean volume of three examinations of scan 1 v the mean volume of three examinations of scan 2 within the 2 mm diameter circle (r = 0.785, p <0.001).
Figure 5 .
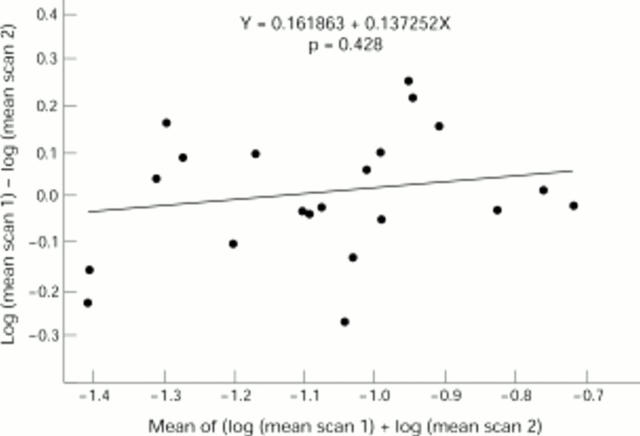
Agreement between scan 1 and scan 2 is examined by plotting the difference between the log values of the mean of three examinations against the mean of the log values. The slope of the regression line is not significant (p = 0.428) and the mean difference of the log transformed data (0.016) is almost zero.
Figure 6 .
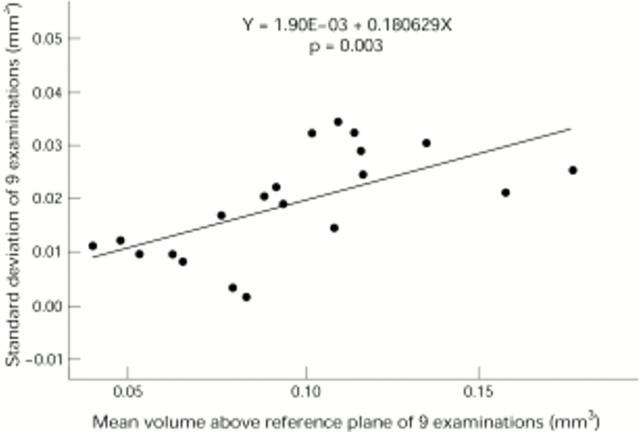
Standard deviation of nine examinations of three scans (three examinations per scan) v mean measured volume. The slope of the regression line is significant (p = 0.003) demonstrating an increase in standard deviation with greater volumes.
Figure 7 .
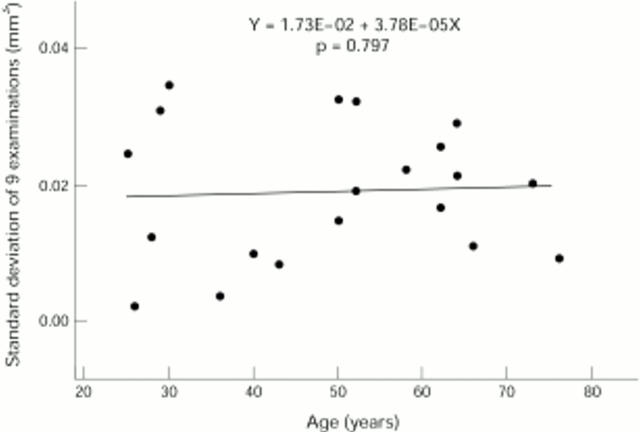
The regression plot of standard deviation of nine examinations of three scans (three examinations per scan) v age demonstrates no significant variability across the age range (p = 0.797), and no correlation between standard deviation and age (r = 0.061, p > 0.1).
Selected References
These references are in PubMed. This may not be the complete list of references from this article.
- Amalric P., Biau C., Féniès M. T. Incidents et accidents au cours de l'angiographie fluorescéinique. Bull Soc Ophtalmol Fr. 1968 Dec;68(12):968–973. [PubMed] [Google Scholar]
- Arend O., Remky A., Elsner A. E., Bertram B., Reim M., Wolf S. Quantification of cystoid changes in diabetic maculopathy. Invest Ophthalmol Vis Sci. 1995 Mar;36(3):608–613. [PubMed] [Google Scholar]
- Bartsch D. U., Intaglietta M., Bille J. F., Dreher A. W., Gharib M., Freeman W. R. Confocal laser tomographic analysis of the retina in eyes with macular hole formation and other focal macular diseases. Am J Ophthalmol. 1989 Sep 15;108(3):277–287. doi: 10.1016/0002-9394(89)90118-9. [DOI] [PubMed] [Google Scholar]
- Bland J. M., Altman D. G. Statistical methods for assessing agreement between two methods of clinical measurement. Lancet. 1986 Feb 8;1(8476):307–310. [PubMed] [Google Scholar]
- Butner R. W., McPherson A. R. Adverse reactions in intravenous fluorescein angiography. Ann Ophthalmol. 1983 Nov;15(11):1084–1086. [PubMed] [Google Scholar]
- Chauhan B. C., LeBlanc R. P., McCormick T. A., Rogers J. B. Test-retest variability of topographic measurements with confocal scanning laser tomography in patients with glaucoma and control subjects. Am J Ophthalmol. 1994 Jul 15;118(1):9–15. doi: 10.1016/s0002-9394(14)72836-3. [DOI] [PubMed] [Google Scholar]
- Hee M. R., Puliafito C. A., Wong C., Duker J. S., Reichel E., Rutledge B., Schuman J. S., Swanson E. A., Fujimoto J. G. Quantitative assessment of macular edema with optical coherence tomography. Arch Ophthalmol. 1995 Aug;113(8):1019–1029. doi: 10.1001/archopht.1995.01100080071031. [DOI] [PubMed] [Google Scholar]
- Hudson C., Flanagan J. G., Turner G. S., McLeod D. Scanning laser tomography Z profile signal width as an objective index of macular retinal thickening. Br J Ophthalmol. 1998 Feb;82(2):121–130. doi: 10.1136/bjo.82.2.121. [DOI] [PMC free article] [PubMed] [Google Scholar]
- Janknecht P., Funk J. Optic nerve head analyser and Heidelberg retina tomograph: accuracy and reproducibility of topographic measurements in a model eye and in volunteers. Br J Ophthalmol. 1994 Oct;78(10):760–768. doi: 10.1136/bjo.78.10.760. [DOI] [PMC free article] [PubMed] [Google Scholar]
- Kruse F. E., Burk R. O., Völcker H. E., Zinser G., Harbarth U. Reproducibility of topographic measurements of the optic nerve head with laser tomographic scanning. Ophthalmology. 1989 Sep;96(9):1320–1324. doi: 10.1016/s0161-6420(89)32719-9. [DOI] [PubMed] [Google Scholar]
- Menezes A. V., Giunta M., Chisholm L., Harvey P. T., Tuli R., Devenyi R. G. Reproducibility of topographic measurements of the macula with a scanning laser ophthalmoscope. Ophthalmology. 1995 Feb;102(2):230–235. doi: 10.1016/s0161-6420(95)31031-7. [DOI] [PubMed] [Google Scholar]
- Orgül S., Cioffi G. A., Bacon D. R., Van Buskirk E. M. Sources of variability of topometric data with a scanning laser ophthalmoscope. Arch Ophthalmol. 1996 Feb;114(2):161–164. doi: 10.1001/archopht.1996.01100130155007. [DOI] [PubMed] [Google Scholar]
- Phillips R. P., Ross P. G., Tyska M., Sharp P. F., Forrester J. V. Detection and quantification of hyperfluorescent leakage by computer analysis of fundus fluorescein angiograms. Graefes Arch Clin Exp Ophthalmol. 1991;229(4):329–335. doi: 10.1007/BF00170690. [DOI] [PubMed] [Google Scholar]
- Rohrschneider K., Burk R. O., Kruse F. E., Völcker H. E. Reproducibility of the optic nerve head topography with a new laser tomographic scanning device. Ophthalmology. 1994 Jun;101(6):1044–1049. doi: 10.1016/s0161-6420(94)31220-6. [DOI] [PubMed] [Google Scholar]
- Shahidi M., Ogura Y., Blair N. P., Rusin M. M., Zeimer R. Retinal thickness analysis for quantitative assessment of diabetic macular edema. Arch Ophthalmol. 1991 Aug;109(8):1115–1119. doi: 10.1001/archopht.1991.01080080075032. [DOI] [PubMed] [Google Scholar]
- Shahidi M., Zeimer R. C., Mori M. Topography of the retinal thickness in normal subjects. Ophthalmology. 1990 Sep;97(9):1120–1124. doi: 10.1016/s0161-6420(90)32457-0. [DOI] [PubMed] [Google Scholar]
- Spencer A. F., Sadiq S. A., Pawson P., Vernon S. A. Vertical optic disk diameter: discrepancy between planimetric and SLO measurements. Invest Ophthalmol Vis Sci. 1995 Apr;36(5):796–803. [PubMed] [Google Scholar]
- Weinreb R. N., Lusky M., Bartsch D. U., Morsman D. Effect of repetitive imaging on topographic measurements of the optic nerve head. Arch Ophthalmol. 1993 May;111(5):636–638. doi: 10.1001/archopht.1993.01090050070031. [DOI] [PubMed] [Google Scholar]
- Zeimer R., Shahidi M., Mori M., Zou S., Asrani S. A new method for rapid mapping of the retinal thickness at the posterior pole. Invest Ophthalmol Vis Sci. 1996 Sep;37(10):1994–2001. [PubMed] [Google Scholar]


