Abstract
AIMS—To study the interchangeability of the measurements of the optic disc topography obtained by one computerised image analyser and one confocal laser tomographic scanner. METHODS—One eye of 28 patients with glaucoma or glaucoma suspects was studied. All cases had simultaneous stereoscopic disc photographs taken with the fundus camera Topcon TRC-SS and optic disc examination with the Heidelberg retina tomograph (HRT) during the same visit. The optic disc photographs were digitised and analysed with the Topcon ImageNet (TI) system. Three variables of the optic disc topography provided by the TI and the HRT were compared—cup volume (CV), rim area (RA), and cup area to disc area ratio (CA/DA). RESULTS—The mean values of CV and RA provided by the TI (0.52 (SD 0.32) mm3 and 1.58 (0.39) mm2, respectively) were greater (p<0.01) than the mean values of CV and RA determined by the HRT (0.32 (0.25) mm3, and 1.33 (0.47) mm2, respectively). The mean value of CA/DA provided by the TI (0.42 (0.14)) and the HRT (0.42 (0.18)) was similar (p=0.93). Correlation coefficients between measurements obtained by the two methods ranged from 0.53 to 0.73. CONCLUSION—There was a significant discrepancy in the measurements of rim area and cup volume of the optic disc obtained by a computerised image analyser and a laser scanning tomograph. Keywords: optic disc; glaucoma; image analysis
Full Text
The Full Text of this article is available as a PDF (107.1 KB).
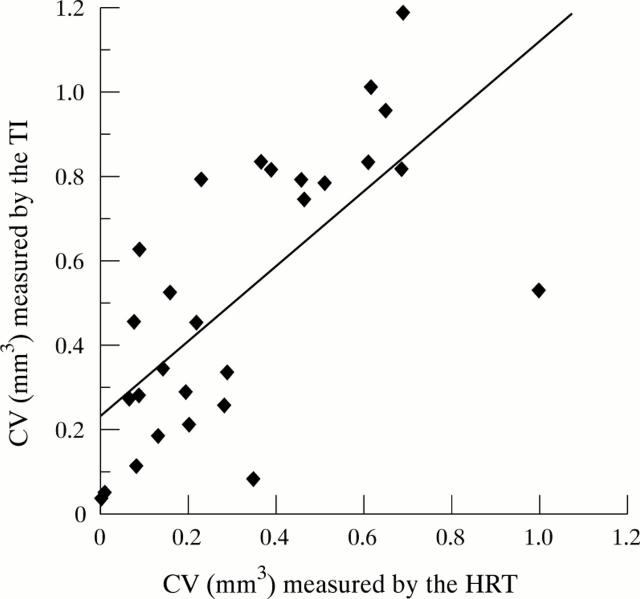
Figure 1 .
Cup volume (CV) measured by Topcon ImageNet, TI, (y axis) and the Heidelberg retina tomograph, HRT (x axis). Scatter plot and linear regression analysis.
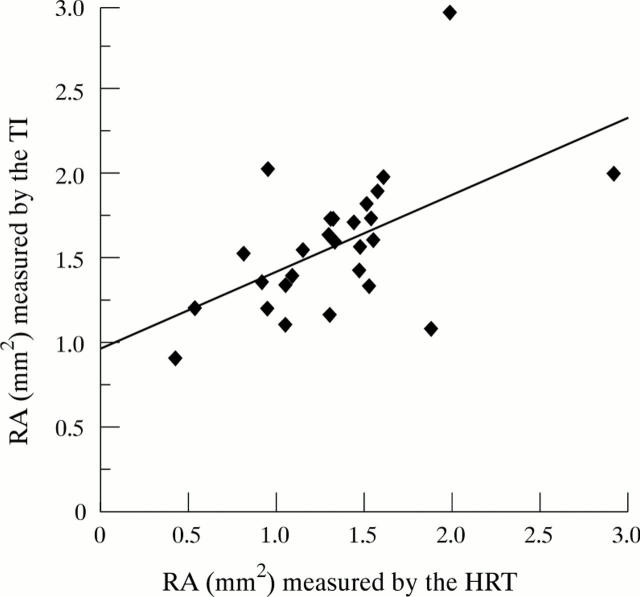
Figure 2 .
Rim area (RA) measured by Topcon ImageNet, TI, (y axis) and the Heidelberg retina tomograph, HRT (x axis). Scatter plot and linear regression analysis.
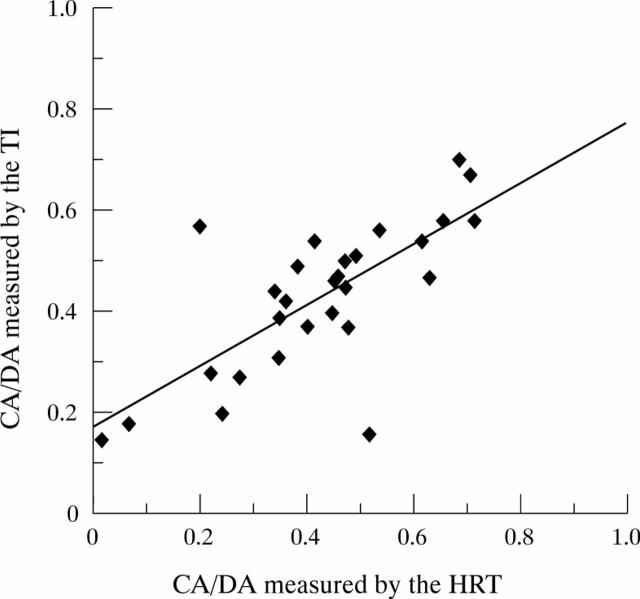
Figure 3 .
Cup area to disc area ratio (CA/DA) measured by Topcon ImageNet, TI, (y axis) and the Heidelberg retina tomograph, HRT (x axis). Scatter plot and linear regression analysis.
Selected References
These references are in PubMed. This may not be the complete list of references from this article.
- Azuara-Blanco A., Harris A., Cantor L. B. Reproducibility of optic disk topographic measurements with the Topcon ImageNet and the Heidelberg Retina Tomograph. Ophthalmologica. 1998;212(2):95–98. doi: 10.1159/000027286. [DOI] [PubMed] [Google Scholar]
- Bengtsson B., Krakau C. E. Correction of optic disc measurements on fundus photographs. Graefes Arch Clin Exp Ophthalmol. 1992;230(1):24–28. doi: 10.1007/BF00166758. [DOI] [PubMed] [Google Scholar]
- Burgoyne C. F., Quigley H. A., Varma R. Comparison of clinician judgment with digitized image analysis in the detection of induced optic disk change in monkey eyes. Am J Ophthalmol. 1995 Aug;120(2):176–183. doi: 10.1016/s0002-9394(14)72605-4. [DOI] [PubMed] [Google Scholar]
- Burk R. O., Rohrschneider K., Takamoto T., Völcker H. E., Schwartz B. Laser scanning tomography and stereophotogrammetry in three-dimensional optic disc analysis. Graefes Arch Clin Exp Ophthalmol. 1993 Apr;231(4):193–198. doi: 10.1007/BF00918840. [DOI] [PubMed] [Google Scholar]
- Cioffi G. A., Robin A. L., Eastman R. D., Perell H. F., Sarfarazi F. A., Kelman S. E. Confocal laser scanning ophthalmoscope. Reproducibility of optic nerve head topographic measurements with the confocal laser scanning ophthalmoscope. Ophthalmology. 1993 Jan;100(1):57–62. [PubMed] [Google Scholar]
- Coleman A. L., Sommer A., Enger C., Knopf H. L., Stamper R. L., Minckler D. S. Interobserver and intraobserver variability in the detection of glaucomatous progression of the optic disc. J Glaucoma. 1996 Dec;5(6):384–389. [PubMed] [Google Scholar]
- Dandona L., Quigley H. A., Jampel H. D. Variability of depth measurements of the optic nerve head and peripapillary retina with computerized image analysis. Arch Ophthalmol. 1989 Dec;107(12):1786–1792. doi: 10.1001/archopht.1989.01070020868029. [DOI] [PubMed] [Google Scholar]
- Dichtl A., Jonas J. B., Mardin C. Y. Comparison between tomographic scanning evaluation and photographic measurement of the neuroretinal rim. Am J Ophthalmol. 1996 May;121(5):494–501. doi: 10.1016/s0002-9394(14)75423-6. [DOI] [PubMed] [Google Scholar]
- Dreher A. W., Tso P. C., Weinreb R. N. Reproducibility of topographic measurements of the normal and glaucomatous optic nerve head with the laser tomographic scanner. Am J Ophthalmol. 1991 Feb 15;111(2):221–229. doi: 10.1016/s0002-9394(14)72263-9. [DOI] [PubMed] [Google Scholar]
- Lichter P. R. Variability of expert observers in evaluating the optic disc. Trans Am Ophthalmol Soc. 1976;74:532–572. [PMC free article] [PubMed] [Google Scholar]
- Littmann H. Zur Bestimmung der wahren Grösse eines Objektes auf dem Hintergrund des lebenden Auges. Klin Monbl Augenheilkd. 1982 Apr;180(4):286–289. doi: 10.1055/s-2008-1055068. [DOI] [PubMed] [Google Scholar]
- Mikelberg F. S., Douglas G. R., Schulzer M., Airaksinen P. J., Wijsman K., Mawson D. The correlation between cup-disk ratio, neuroretinal rim area, and optic disk area measured by the video-ophthalmograph (Rodenstock analyzer) and clinical measurement. Am J Ophthalmol. 1986 Jan 15;101(1):7–12. doi: 10.1016/0002-9394(86)90458-7. [DOI] [PubMed] [Google Scholar]
- Sommer A., Pollack I., Maumenee A. E. Optic disc parameters and onset of glaucomatous field loss. I. Methods and progressive changes in disc morphology. Arch Ophthalmol. 1979 Aug;97(8):1444–1448. doi: 10.1001/archopht.1979.01020020106002. [DOI] [PubMed] [Google Scholar]
- Tielsch J. M., Katz J., Quigley H. A., Miller N. R., Sommer A. Intraobserver and interobserver agreement in measurement of optic disc characteristics. Ophthalmology. 1988 Mar;95(3):350–356. doi: 10.1016/s0161-6420(88)33177-5. [DOI] [PubMed] [Google Scholar]
- Varma R., Douglas G. R., Steinmann W. C., Wijsman K., Mawson D., Spaeth G. L. A comparative evaluation of three methods of analyzing optic disc topography. Ophthalmic Surg. 1989 Nov;20(11):813–819. [PubMed] [Google Scholar]
- Varma R., Spaeth G. L., Steinmann W. C., Katz L. J. Agreement between clinicians and an image analyzer in estimating cup-to-disc ratios. Arch Ophthalmol. 1989 Apr;107(4):526–529. doi: 10.1001/archopht.1989.01070010540027. [DOI] [PubMed] [Google Scholar]
- Varma R., Spaeth G. L. The PAR IS 2000: a new system for retinal digital image analysis. Ophthalmic Surg. 1988 Mar;19(3):183–192. [PubMed] [Google Scholar]
- Varma R., Steinmann W. C., Spaeth G. L., Wilson R. P. Variability in digital analysis of optic disc topography. Graefes Arch Clin Exp Ophthalmol. 1988;226(5):435–442. doi: 10.1007/BF02170004. [DOI] [PubMed] [Google Scholar]
- Varma R., Tielsch J. M., Quigley H. A., Hilton S. C., Katz J., Spaeth G. L., Sommer A. Race-, age-, gender-, and refractive error-related differences in the normal optic disc. Arch Ophthalmol. 1994 Aug;112(8):1068–1076. doi: 10.1001/archopht.1994.01090200074026. [DOI] [PubMed] [Google Scholar]
- Weinreb R. N., Lusky M., Bartsch D. U., Morsman D. Effect of repetitive imaging on topographic measurements of the optic nerve head. Arch Ophthalmol. 1993 May;111(5):636–638. doi: 10.1001/archopht.1993.01090050070031. [DOI] [PubMed] [Google Scholar]


