

Abstract
AIM—To describe a new method of evaluating the topographic distribution of fundus autofluorescence in eyes with retinal disease. METHODS—Images of fundus autofluorescence were obtained in five patients and 34 normal volunteers using a confocal scanning laser ophthalmoscope (cSLO). To evaluate the topographic distribution of fundus autofluorescence throughout the posterior pole a rectangular box, 10 × 750 pixels, was used as the area of analysis. The box was placed, horizontally, across the macular region. The intensity of fundus autofluorescence of each pixel within the rectangular box was plotted against its degree of eccentricity. Profiles of fundus autofluorescence from patients were compared with those obtained from the age matched control group and with cSLO images. RESULTS—Profiles of fundus autofluorescence appeared to represent the topographic distribution of fundus autofluorescence throughout the posterior pole appreciated in the cSLO images, and allowed rapid identification and quantification of areas of increased or decreased fundus autofluorescence. CONCLUSIONS—Fundus autofluorescence profiles appear to be useful to study the spatial distribution of fundus autofluorescence in eyes with retinal disease.
Full Text
The Full Text of this article is available as a PDF (180.6 KB).
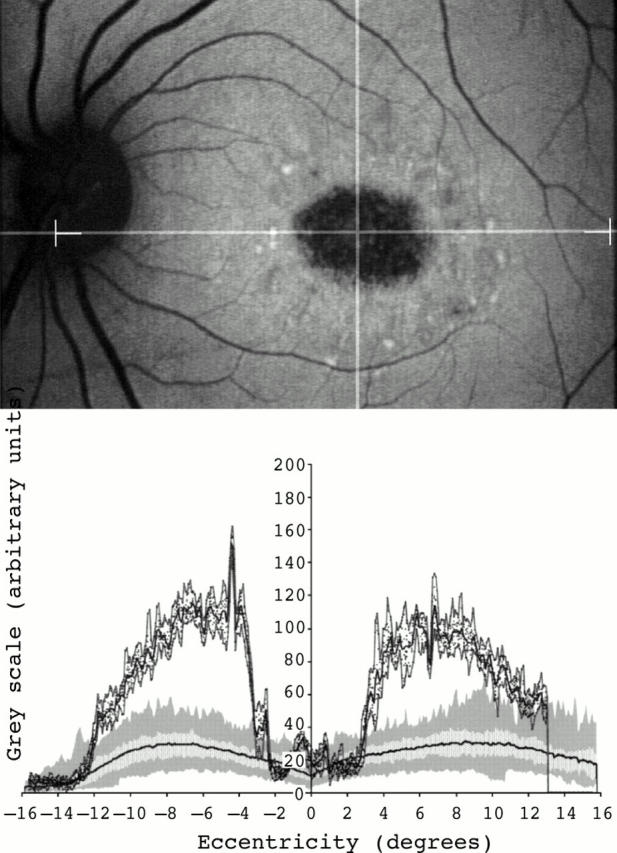
Figure 1 .

(Left top) Fundus photograph (red-free) of a 20 year old woman with Best's disease. (Right top) Fundus autofluorescent image of the same patient. The intersection between the horizontal and vertical lines represents the centre of the fovea. The horizontal line shows the area where measurements were taken. The right and left ends of the area of analysis are also marked on the image. (Right bottom) Fundus autofluorescent profile (dotted graph). Dark dots represent values of fundus autofluorescence of single pixels within the area studied. The highest, mean, and lowest values of fundus autofluorescence are represented by continuous dark lines (top, medium, and bottom lines, respectively). A graph with values of fundus autofluorescence corresponding to an age matched control group is also shown. Two light grey bands represent the 25% (inferior grey band) and 75% (superior grey band) confident interval. The mean (black line), lowest (inferior aspect of the dark grey band), and highest (superior aspect of the dark grey band) values of fundus autofluorescence at each degree of eccentricity are also represented. The regional increased autofluorescence is localised to the centre of the macula.
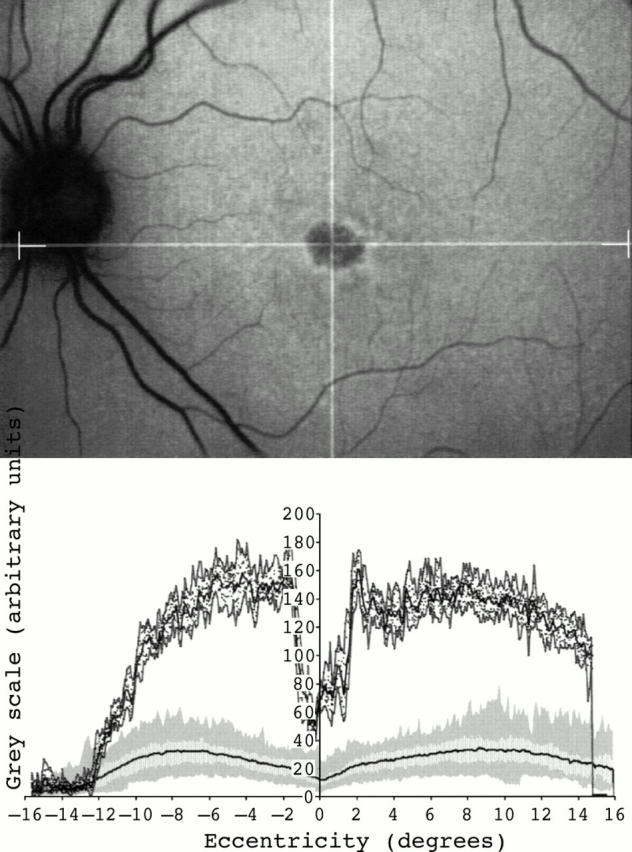
Figure 2 .

(Left top) Fundus photograph (red-free) of a 36 year old man with adult vitelliform foveomacular dystrophy. Fundus autofluorescent image (right top) and fundus autofluorescent profile of the same patient (right bottom). Very high levels of fundus autofluorescence were detected at the centre of the fovea. Background values of fundus autofluorescence were also high throughout the entire area studied.
Figure 3 .
Fundus autofluorescent image of a 35 year old woman with Stargardt macular dystrophy-fundus flavimaculatus (top). An area of decreased signal at the centre of the macula and small foci of increased signal within it and around it were seen. Fundus autofluorescence profile showed very high background fundus autofluorescence levels across the entire area studied. Values of fundus autofluorescence at the fovea were within the lower normal values and peaks of increased autofluorescence at that site were also detected (bottom).
Figure 4 .
Fundus autofluorescent image of a 28 year old female with a bull's eye macular dystrophy (top). No focal areas with high or low intensity signal were detected outside the fovea in the cSLO image. Fundus autofluorescence profile demonstrated very high levels of fundus autofluorescence throughout the posterior pole (bottom).
Figure 5 .
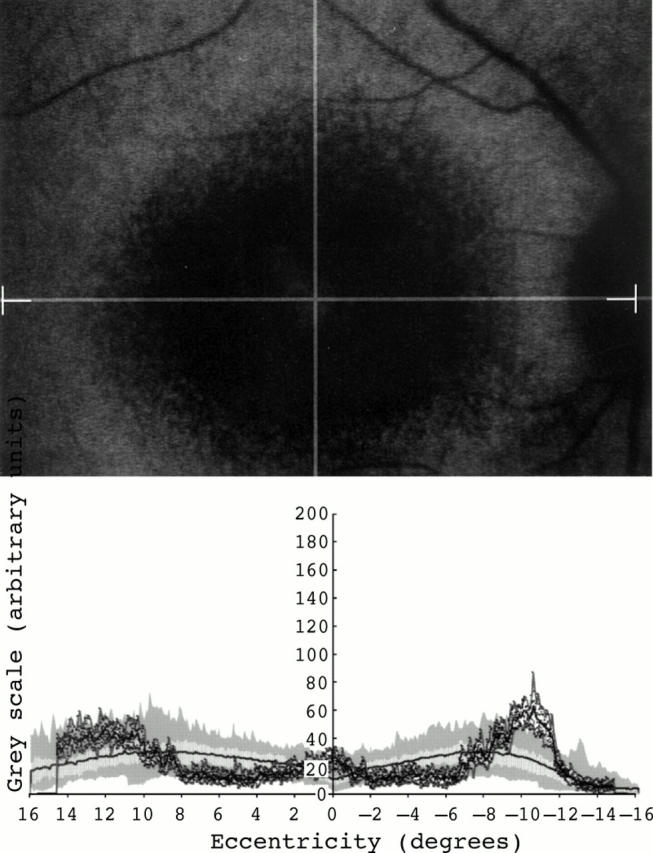
Fundus autofluorescence profile in a 32 years old man with cone-rod dystrophy. A large area with low intensity signal was observed at the macula in the cSLO image (top). This area appeared to be surrounded by a ring of high intensity signal. The fundus autofluorescence profile disclosed levels of fundus autofluorescence at the centre of the macula within the lower normal range and high levels of fundus autofluorescence outside the centre.
Selected References
These references are in PubMed. This may not be the complete list of references from this article.
- Aguirre G. D., Laties A. Pigment epithelial dystrophy in the dog. Exp Eye Res. 1976 Aug;23(2):247–256. doi: 10.1016/0014-4835(76)90207-4. [DOI] [PubMed] [Google Scholar]
- Birnbach C. D., Järveläinen M., Possin D. E., Milam A. H. Histopathology and immunocytochemistry of the neurosensory retina in fundus flavimaculatus. Ophthalmology. 1994 Jul;101(7):1211–1219. doi: 10.1016/s0161-6420(13)31725-4. [DOI] [PubMed] [Google Scholar]
- Boulton M., McKechnie N. M., Breda J., Bayly M., Marshall J. The formation of autofluorescent granules in cultured human RPE. Invest Ophthalmol Vis Sci. 1989 Jan;30(1):82–89. [PubMed] [Google Scholar]
- Delori F. C., Dorey C. K., Staurenghi G., Arend O., Goger D. G., Weiter J. J. In vivo fluorescence of the ocular fundus exhibits retinal pigment epithelium lipofuscin characteristics. Invest Ophthalmol Vis Sci. 1995 Mar;36(3):718–729. [PubMed] [Google Scholar]
- Delori F. C., Staurenghi G., Arend O., Dorey C. K., Goger D. G., Weiter J. J. In vivo measurement of lipofuscin in Stargardt's disease--Fundus flavimaculatus. Invest Ophthalmol Vis Sci. 1995 Oct;36(11):2327–2331. [PubMed] [Google Scholar]
- Dorey C. K., Wu G., Ebenstein D., Garsd A., Weiter J. J. Cell loss in the aging retina. Relationship to lipofuscin accumulation and macular degeneration. Invest Ophthalmol Vis Sci. 1989 Aug;30(8):1691–1699. [PubMed] [Google Scholar]
- Eagle R. C., Jr, Lucier A. C., Bernardino V. B., Jr, Yanoff M. Retinal pigment epithelial abnormalities in fundus flavimaculatus: a light and electron microscopic study. Ophthalmology. 1980 Dec;87(12):1189–1200. doi: 10.1016/s0161-6420(80)35106-3. [DOI] [PubMed] [Google Scholar]
- Feeney-Burns L., Berman E. R., Rothman H. Lipofuscin of human retinal pigment epithelium. Am J Ophthalmol. 1980 Dec;90(6):783–791. doi: 10.1016/s0002-9394(14)75193-1. [DOI] [PubMed] [Google Scholar]
- Feeney-Burns L., Eldred G. E. The fate of the phagosome: conversion to 'age pigment' and impact in human retinal pigment epithelium. Trans Ophthalmol Soc U K. 1983;103(Pt 4):416–421. [PubMed] [Google Scholar]
- Feeney-Burns L., Hilderbrand E. S., Eldridge S. Aging human RPE: morphometric analysis of macular, equatorial, and peripheral cells. Invest Ophthalmol Vis Sci. 1984 Feb;25(2):195–200. [PubMed] [Google Scholar]
- Feeney L. Lipofuscin and melanin of human retinal pigment epithelium. Fluorescence, enzyme cytochemical, and ultrastructural studies. Invest Ophthalmol Vis Sci. 1978 Jul;17(7):583–600. [PubMed] [Google Scholar]
- Frangieh G. T., Green W. R., Fine S. L. A histopathologic study of Best's macular dystrophy. Arch Ophthalmol. 1982 Jul;100(7):1115–1121. doi: 10.1001/archopht.1982.01030040093017. [DOI] [PubMed] [Google Scholar]
- Katz M. L., Drea C. M., Eldred G. E., Hess H. H., Robison W. G., Jr Influence of early photoreceptor degeneration on lipofuscin in the retinal pigment epithelium. Exp Eye Res. 1986 Oct;43(4):561–573. doi: 10.1016/s0014-4835(86)80023-9. [DOI] [PubMed] [Google Scholar]
- Lopez P. F., Maumenee I. H., de la Cruz Z., Green W. R. Autosomal-dominant fundus flavimaculatus. Clinicopathologic correlation. Ophthalmology. 1990 Jun;97(6):798–809. doi: 10.1016/s0161-6420(90)32508-3. [DOI] [PubMed] [Google Scholar]
- Steinmetz R. L., Garner A., Maguire J. I., Bird A. C. Histopathology of incipient fundus flavimaculatus. Ophthalmology. 1991 Jun;98(6):953–956. doi: 10.1016/s0161-6420(91)32197-3. [DOI] [PubMed] [Google Scholar]
- Weingeist T. A., Kobrin J. L., Watzke R. C. Histopathology of Best's macular dystrophy. Arch Ophthalmol. 1982 Jul;100(7):1108–1114. doi: 10.1001/archopht.1982.01030040086016. [DOI] [PubMed] [Google Scholar]
- Weiter J. J., Delori F. C., Wing G. L., Fitch K. A. Retinal pigment epithelial lipofuscin and melanin and choroidal melanin in human eyes. Invest Ophthalmol Vis Sci. 1986 Feb;27(2):145–152. [PubMed] [Google Scholar]
- Wing G. L., Blanchard G. C., Weiter J. J. The topography and age relationship of lipofuscin concentration in the retinal pigment epithelium. Invest Ophthalmol Vis Sci. 1978 Jul;17(7):601–607. [PubMed] [Google Scholar]
- Young R. W. Visual cells and the concept of renewal. Invest Ophthalmol Vis Sci. 1976 Sep;15(9):700–725. [PubMed] [Google Scholar]
- von Rückmann A., Fitzke F. W., Bird A. C. Distribution of fundus autofluorescence with a scanning laser ophthalmoscope. Br J Ophthalmol. 1995 May;79(5):407–412. doi: 10.1136/bjo.79.5.407. [DOI] [PMC free article] [PubMed] [Google Scholar]
- von Rückmann A., Fitzke F. W., Bird A. C. Fundus autofluorescence in age-related macular disease imaged with a laser scanning ophthalmoscope. Invest Ophthalmol Vis Sci. 1997 Feb;38(2):478–486. [PubMed] [Google Scholar]
- von Rückmann A., Fitzke F. W., Bird A. C. In vivo fundus autofluorescence in macular dystrophies. Arch Ophthalmol. 1997 May;115(5):609–615. doi: 10.1001/archopht.1997.01100150611006. [DOI] [PubMed] [Google Scholar]