

Full Text
The Full Text of this article is available as a PDF (883.5 KB).
Figure 1 .
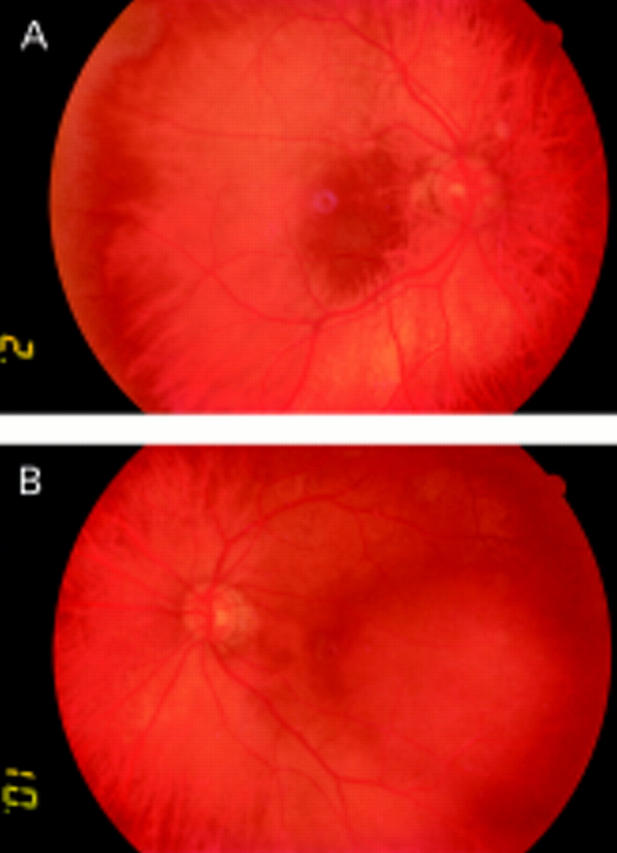
(A) Photograph of the right macular area reveals an irregular appearance of the retinal surface. (B) Photograph of the left temporal posterior pole shows a lesion, about 5 optic disc diameters in size and red-orange in colour.
Figure 2 .

(Right eye). (A) Standardised A-scan ultrasonography at 1660 m/s shows the high internal reflectivity of the choroidal solid lesion at the level of the macular area. The maximum thickness of this small circumscribed lesion is 1.56 mm. (B) Late phase fluorescein angiogram reveals a hyperfluorescent area inferiorly located at the inferior posterior pole, secondary to a degenerative change of the retinal pigment epithelium. (C) Early indocyanine green photograph documents the filling of the choroidal macular haemangioma near to a sector of reduced choroidal perfusion (arrows). (D) Late indocyanine green angiogram shows an ill defined, relative macular hypofluorescence, corresponding to the previously described hyperfluorescent area, reliably the result of the clearing of the dye from the small haemangioma (arrows).
Figure 3 .

(Left eye). (A) Standardised A-scan ultrasonography at 1660 m/s demonstrates the temporal paramacular solid lesion of the choroid, with its high and regular internal reflectivity, consistent with the presence of an angiomatous benign lesion. The maximum thickness of this circumscribed choroidal haemangioma is 3.32 mm. (B) Late phase fluorescein angiogram shows an ill defined hyperfluorescent and hypofluorescent area in correspondence with choroidal haemangioma (arrows). (C) Early indocyanine green photograph reveals a rapid and complete fill up of the lesion. The haemangioma has a "mulberry appearance" at the stage of maximal fluorescence. (D) Late indocyanine green angiogram shows clearing of the dye from the tumour, associated with diffusion into the choroidal and subretinal space ("washout" phenomenon).