

Abstract
AIM—Accurate Heidelberg retina flowmeter (HRF) measurements require correct manual setting of the HRF photodetector sensitivity. The neuroretinal rim produces a weak signal relative to the peripapillary retina. A newly developed HRF alignment and sensitivity protocol, capable of accurate rim measurement, was investigated. METHODS—18 eyes of nine healthy volunteers were examined by HRF. Three images of each eye were taken using three different imaging methods. Method 1: a conventional image (optic nerve head centred image with photodetector sensitivity optimised for the strong signal from the peripapillary retina); method 2: the setting of method 1 with photodetector sensitivity optimised for the weak signal from the rim; and method 3: the setting of method 2 with the temporal rim margin tangent to the lateral image border to remove the overpowering signal from the temporal peripapillary retina. The neuroretinal rim was defined by the Heidelberg retina tomograph (HRT). Blood flow and reflectivity values (DC component) in the rim area were compared for the three methods using pointwise analysis. Coefficients of variation of repeated measurements in 12 subjects have been calculated for method 3. RESULTS—The neuroretinal rim area measured by method 1 had a significantly lower brightness compared with method 2 and 3 (p=0.0002 and p=0.0002, respectively). Method 2 provided proper sensitivity for the weak signals of the rim area based on rim tissue DC values; however, this sensitivity setting was too high for the strong signal from the peripapillary retina. Method 3 avoided the strong peripapillary signal with the proper signal from the rim and provided significantly higher flow values of the rim area at 75 and 90 percentile pixels (p=0.0065 and p=0.0038 respectively) compared with method 2. Interobserver repeatability ranged from 16.85% to 21.96% for the different parameters. CONCLUSIONS—Method 3 provides an accurate and reproducible flow measurement of the neuroretinal rim area through proper sensitivity for the weak rim signal, alignment, and removal of the strong temporal signal from the image. This new method is recommended to improve accuracy of blood flow measurement in the neuroretinal rim.
Full Text
The Full Text of this article is available as a PDF (189.9 KB).
Figure 1 .
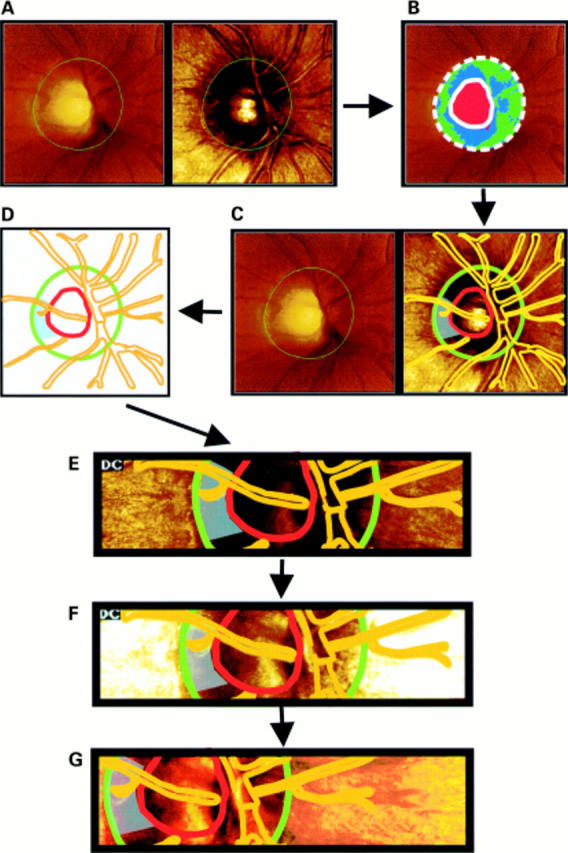
Definition of the optic disc margins using HRT images (A). Description of disc and cup area by means of the HRT software, after contour line drawing of the disc margin by an experienced examiner (B). Using a transparency overlay, the optic disc and cup margins, the major vessels as well as a blue shaded rim measurement area are drawn (C) resulting in a optic disc map ready for transposition to the HRF images (D). The HRT transparency overlay is adjusted exactly over the corresponding optic disc and retinal structures and HRF measurements are performed according to method 1 (E). The same design is used for method 2 (F) and method 3 (G).
Figure 2 .

The percentage of unacceptably illuminated pixels in the HRF neuroretinal rim measurements (mean (SE)). % bad DC = the percentage of unacceptably illuminated pixels (DC: value <70 or >200) of total pixels. Method 1: a conventional setting which has the optic nerve head in the centre of the image with photodetector sensitivity optimised for the strong signal from the temporal peripapillary retina. Method 2: the setting of method 1 with signal capturing optimised on the rim by increasing sensitivity. Method 3: the setting of method 2 with the temporal rim margin tangent to the lateral image border. *Significant difference between methods 1 and 2 (p=0.0074, Wilcoxon signed rank test). †Significant difference between methods 1 and 3 (p=0.0003, Wilcoxon signed rank test).
Figure 3 .

75 Percentile flow in HRF neuroretinal rim measurements (mean (SE)). 75 percentile flow = blood flow values at 75 percentile pixels of blood flow histogram, which is generated from acceptable DC pixels (DC: from 70 to 200). Method 1: a conventional setting which has the optic nerve head in the centre of the image with photodetector sensitivity optimised for the strong signal from the temporal peripapillary retina. Method 2: the setting of method 1 with signal capturing optimised on the rim by increasing sensitivity. Method 3: the setting of method 2 with the temporal rim margin tangent to the lateral image border. *Significant difference between methods 2 and 3 (p=0.0065, Wilcoxon signed rank test).
Selected References
These references are in PubMed. This may not be the complete list of references from this article.
- Bartz-Schmidt K. U., Jonescu-Cuypers C. P., Thumann G., Frucht J., Krieglstein G. K. Zum Einfluss der Konturlinie auf die Exkavationsfläche beim Heidelberg Retina Tomograph. Klin Monbl Augenheilkd. 1996 Nov;209(5):292–297. doi: 10.1055/s-2008-1035321. [DOI] [PubMed] [Google Scholar]
- Bartz-Schmidt K. U., Jonescu-Cuypers C. P., Thumann G., Frucht J., Sengersdorf A., Hilgers R. D., Krieglstein G. K. The normalised rim/disc area ratio line. Int Ophthalmol. 1995;19(6):331–335. doi: 10.1007/BF00130851. [DOI] [PubMed] [Google Scholar]
- Bartz-Schmidt K. U., Weber J., Heimann K. Validity of two-dimensional data obtained with the Heidelberg Retina Tomograph as verified by direct measurements in normal optic nerve heads. Ger J Ophthalmol. 1994 Nov;3(6):400–405. [PubMed] [Google Scholar]
- Bland J. M., Altman D. G. Statistical methods for assessing agreement between two methods of clinical measurement. Lancet. 1986 Feb 8;1(8476):307–310. [PubMed] [Google Scholar]
- Burk R. O., Rohrschneider K., Noack H., Völcker H. E. Are large optic nerve heads susceptible to glaucomatous damage at normal intraocular pressure? A three-dimensional study by laser scanning tomography. Graefes Arch Clin Exp Ophthalmol. 1992;230(6):552–560. doi: 10.1007/BF00181778. [DOI] [PubMed] [Google Scholar]
- Burk R. O., Rohrschneider K., Takamoto T., Völcker H. E., Schwartz B. Laser scanning tomography and stereophotogrammetry in three-dimensional optic disc analysis. Graefes Arch Clin Exp Ophthalmol. 1993 Apr;231(4):193–198. doi: 10.1007/BF00918840. [DOI] [PubMed] [Google Scholar]
- Chauhan B. C., Smith F. M. Confocal scanning laser Doppler flowmetry: experiments in a model flow system. J Glaucoma. 1997 Aug;6(4):237–245. [PubMed] [Google Scholar]
- Chung H. S., Harris A., Halter P. J., Kagemann L., Roff E. J., Garzozi H. J., Hosking S. L., Martin B. J. Regional differences in retinal vascular reactivity. Invest Ophthalmol Vis Sci. 1999 Sep;40(10):2448–2453. [PubMed] [Google Scholar]
- Chung H. S., Harris A., Kagemann L., Martin B. Peripapillary retinal blood flow in normal tension glaucoma. Br J Ophthalmol. 1999 Apr;83(4):466–469. doi: 10.1136/bjo.83.4.466. [DOI] [PMC free article] [PubMed] [Google Scholar]
- Iester M., Mikelberg F. S., Drance S. M. The effect of optic disc size on diagnostic precision with the Heidelberg retina tomograph. Ophthalmology. 1997 Mar;104(3):545–548. doi: 10.1016/s0161-6420(97)30277-2. [DOI] [PubMed] [Google Scholar]
- Jonescu-Cuypers C. P., Thumann G., Hilgers R. D., Bartz-Schmidt K. U., Krott R., Krieglstein G. K. Long-term fluctuations of the normalised rim/disc area ratio quotient in normal eyes. Graefes Arch Clin Exp Ophthalmol. 1999 Mar;237(3):181–186. doi: 10.1007/s004170050216. [DOI] [PubMed] [Google Scholar]
- Kagemann L., Harris A., Chung H. S., Evans D., Buck S., Martin B. Heidelberg retinal flowmetry: factors affecting blood flow measurement. Br J Ophthalmol. 1998 Feb;82(2):131–136. doi: 10.1136/bjo.82.2.131. [DOI] [PMC free article] [PubMed] [Google Scholar]
- Michelson G., Langhans M. J., Groh M. J. Clinical investigation of the combination of a scanning laser ophthalmoscope and laser Doppler flowmeter. Ger J Ophthalmol. 1995 Nov;4(6):342–349. [PubMed] [Google Scholar]
- Michelson G., Langhans M. J., Groh M. J. Perfusion of the juxtapapillary retina and the neuroretinal rim area in primary open angle glaucoma. J Glaucoma. 1996 Apr;5(2):91–98. [PubMed] [Google Scholar]
- Michelson G., Schmauss B., Langhans M. J., Harazny J., Groh M. J. Principle, validity, and reliability of scanning laser Doppler flowmetry. J Glaucoma. 1996 Apr;5(2):99–105. [PubMed] [Google Scholar]
- Michelson G., Schmauss B. Two dimensional mapping of the perfusion of the retina and optic nerve head. Br J Ophthalmol. 1995 Dec;79(12):1126–1132. doi: 10.1136/bjo.79.12.1126. [DOI] [PMC free article] [PubMed] [Google Scholar]
- Michelson G., Welzenbach J., Pal I., Harazny J. Automatic full field analysis of perfusion images gained by scanning laser Doppler flowmetry. Br J Ophthalmol. 1998 Nov;82(11):1294–1300. doi: 10.1136/bjo.82.11.1294. [DOI] [PMC free article] [PubMed] [Google Scholar]
- Nicolela M. T., Hnik P., Schulzer M., Drance S. M. Reproducibility of retinal and optic nerve head blood flow measurements with scanning laser Doppler flowmetry. J Glaucoma. 1997 Jun;6(3):157–164. [PubMed] [Google Scholar]
- Riva C. E., Cranstoun S. D., Grunwald J. E., Petrig B. L. Choroidal blood flow in the foveal region of the human ocular fundus. Invest Ophthalmol Vis Sci. 1994 Dec;35(13):4273–4281. [PubMed] [Google Scholar]
- Rohrschneider K., Burk R. O., Völcker H. E. Reproducibility of topometric data acquisition in normal and glaucomatous optic nerve heads with the laser tomographic scanner. Graefes Arch Clin Exp Ophthalmol. 1993 Aug;231(8):457–464. doi: 10.1007/BF02044232. [DOI] [PubMed] [Google Scholar]
- Schrijver H. M., Veering M. M., Vis M. M. Een patiënt met rabiës in Nederland. Ned Tijdschr Geneeskd. 1997 Mar 1;141(9):437–439. [PubMed] [Google Scholar]
- Strenn K., Menapace R., Rainer G., Findl O., Wolzt M., Schmetterer L. Reproducibility and sensitivity of scanning laser Doppler flowmetry during graded changes in PO2. Br J Ophthalmol. 1997 May;81(5):360–364. doi: 10.1136/bjo.81.5.360. [DOI] [PMC free article] [PubMed] [Google Scholar]
- Tsang A. C., Harris A., Kagemann L., Chung H. S., Snook B. M., Garzozi H. J. Brightness alters Heidelberg retinal flowmeter measurements in an in vitro model. Invest Ophthalmol Vis Sci. 1999 Mar;40(3):795–799. [PubMed] [Google Scholar]