Abstract
AIMS—To assess early functional retinal changes in diabetics without retinopathy, a new multifocal stimulus paradigm was used that emphasises fast adaptive response contributions. METHODS—25 normal control subjects (25 eyes) and 11 diabetics without retinopathy (22 eyes) served as subjects. Stimulation and analysis were performed with Veris Science 4.0. A stimulation protocol was used that combines regular multifocal flicker stimulation with a periodic "global" flash inserted between the multifocal stimuli. The multifocal stimuli were presented four video frames apart. The global flash covered the entire screen in the third frame of the four frame interval. The remaining two frames were dark. The periodic global flashes could only contribute to the focal responses if they were affected by the multifocal stimulation. A non-linear component induced by the interaction of the focal and global flashes was observed. The differences between control subjects and diabetics were assessed in both the multifocal responses and their induced effect on the following global flashes. RESULTS—The responses to focal flashes were reduced significantly in diabetics matched in age to the control subjects. The induced components showed large intersubject variability in controls and patients, and did not differ significantly between the two groups. CONCLUSION—The periodic global flashes produce a greater multifocal response reduction in diabetics than in normals, indicating impairment in the rate or magnitude of recovery from the bright preceding stimulus. The new stimulation protocol reveals early changes in retinal function of diabetics.
Full Text
The Full Text of this article is available as a PDF (208.3 KB).
Figure 1 .
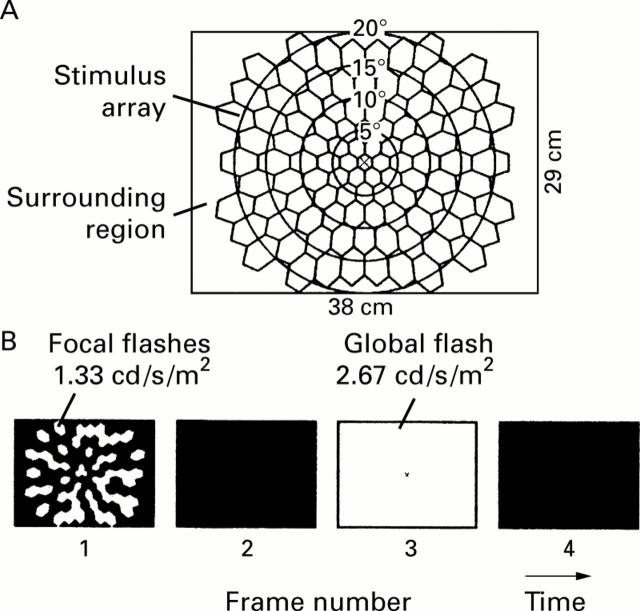
(A) The stimulus, displayed on a 38 × 29 cm CRT screen, consisted of 103 hexagons (stimulus array) and a surrounding region. A small fixation cross was located in the centre. (B) Each m-sequence step consisted of four video frames. In frame 1, there was either a flash (1.33 cd/s/m2) or darkness, determined by a binary m-sequence. The display was dark in frame 2. In frame 3, all hexagons and the surrounding region were uniformly flashed (2.67 cd/s/m2). The display was dark again in frame 4.
Figure 2 .
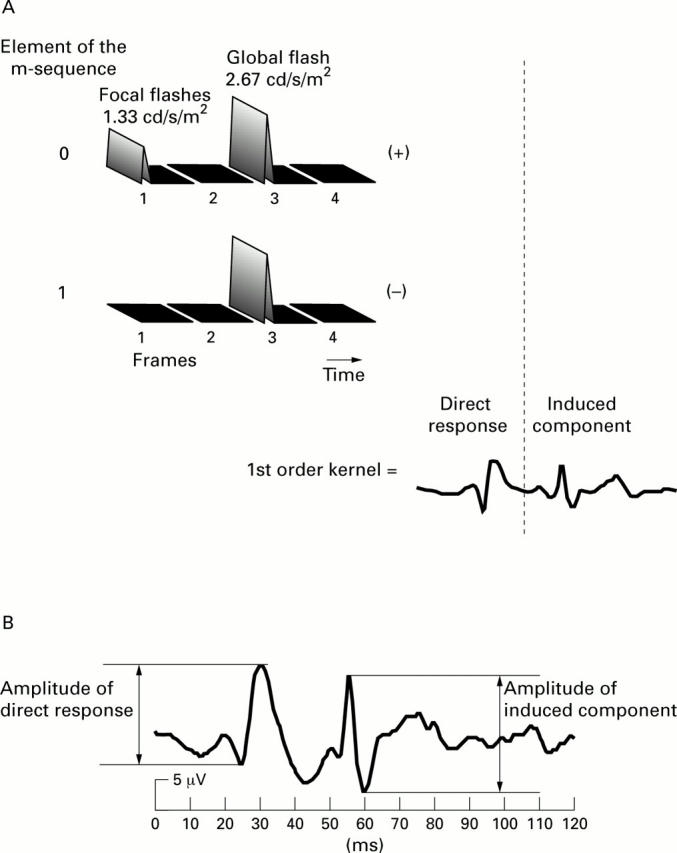
(A) Schematic illustration of the derivation of the first order kernel. It is derived as the cross correlation between stimulus sequence and the response. This computation is equivalent to averaging all the response epochs following a focal flash (top row) and subtracting the average of all those following a stimulus interval without a flash (second row). The resulting average below contains two components: the direct response generated by the focal flash and the effect of the focal flash on the following global flash response 26.7 ms later (induced component). Measurement of the peak to peak amplitudes of the two components is illustrated in (B).
Figure 3 .
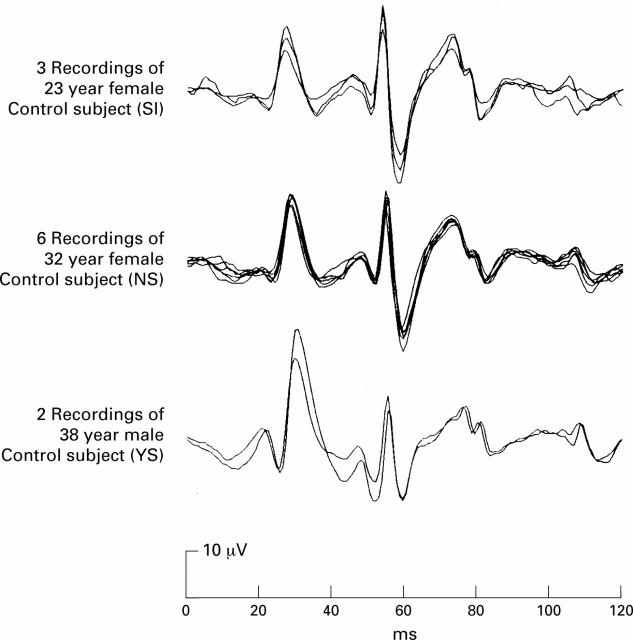
Three subjects were recorded several times on different days with the same eye and contact electrode. The traces shown in the figure represent the first order responses, summed over all 103 hexagons. The six traces shown in the centre panel were derived from a 32 year old female in six recordings spread over the period of 1 month.
Figure 4 .
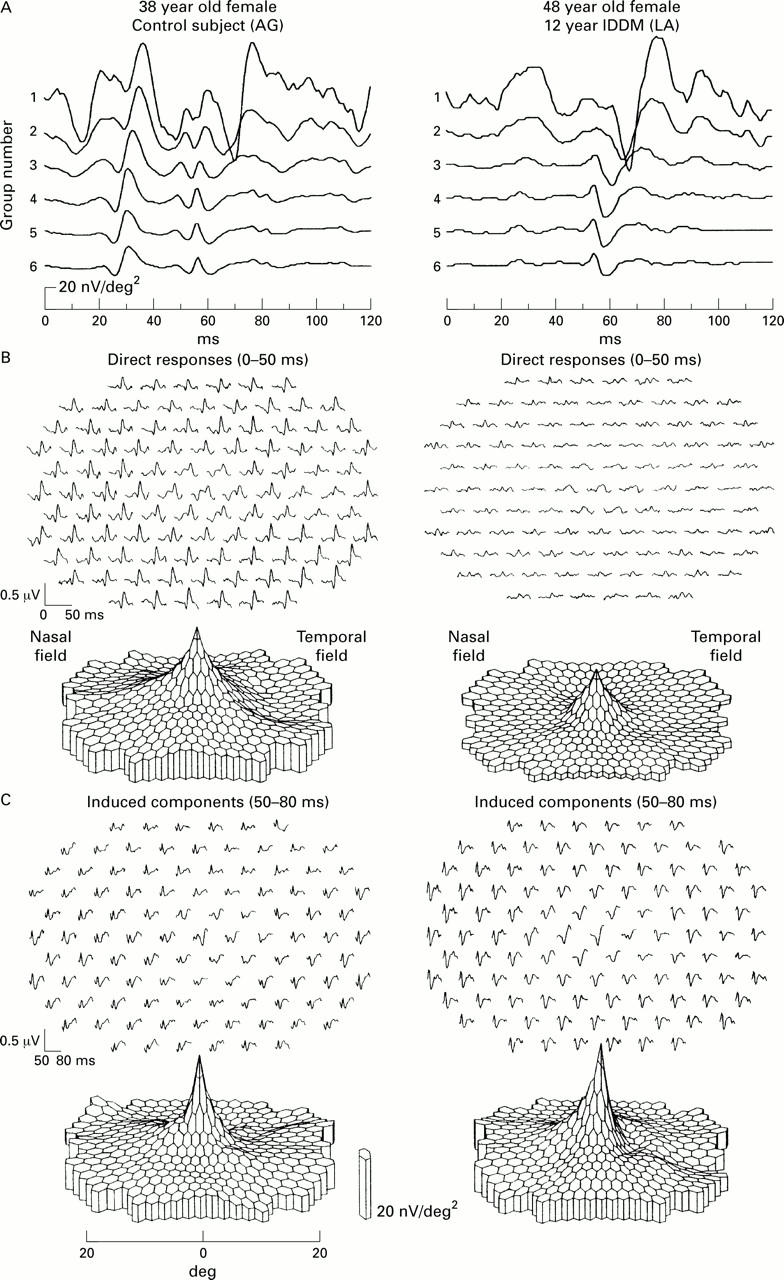
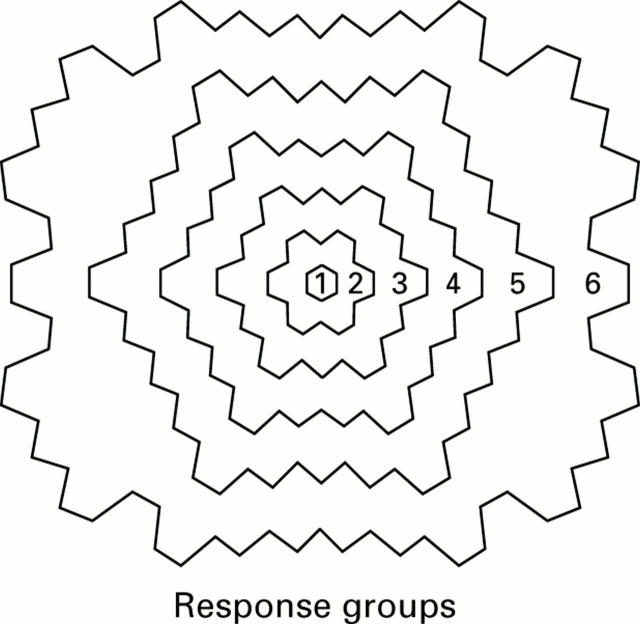
Data recorded from a 38 year old female control subject (left column), and a 48 year old female patient with a 12 year history of IDDM (right column). (A) Traces averaged over the concentric rings shown in inset (B and C). Trace arrays and topographies of direct response (B) and induced component (C).
Figure 5 .
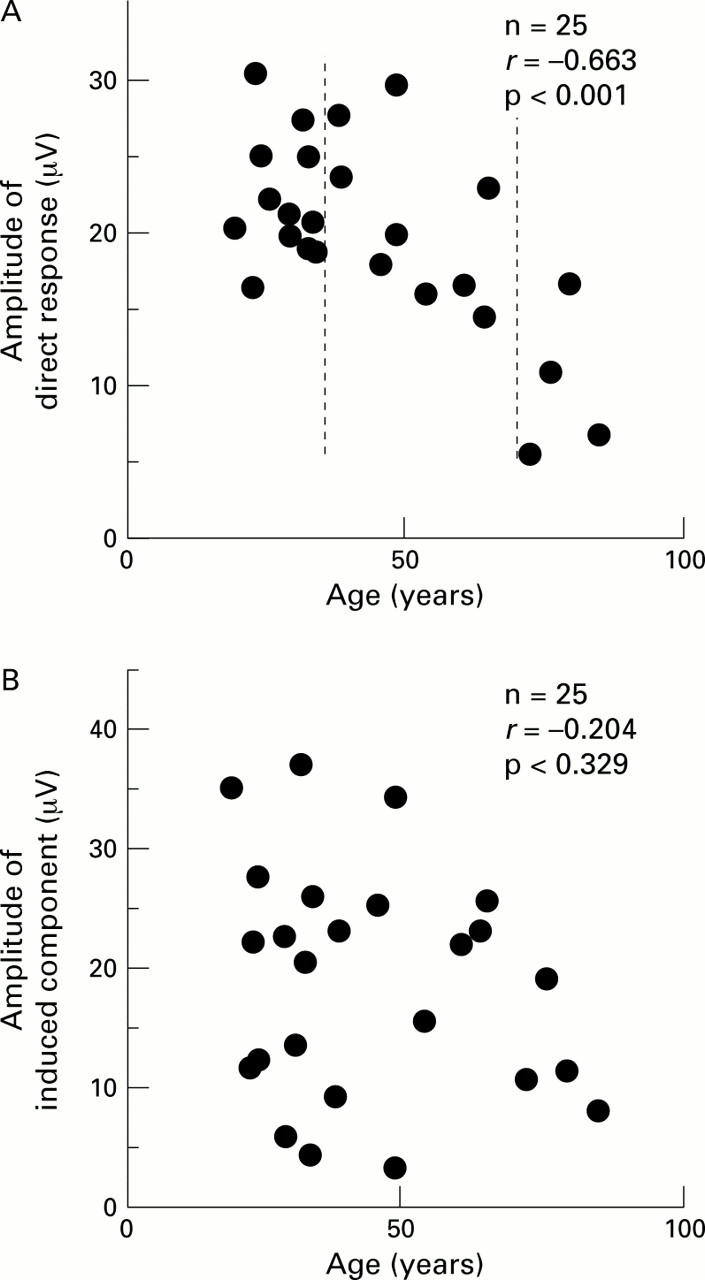
Relation between response amplitudes and age in control subjects. (A) Direct response. (B) Induced component. The responses from all 103 hexagons were added and then the amplitudes were measured. The data between the broken lines in (A) (ages 35-70 years) were used when comparing diabetics and control subjects.
Figure 6 .
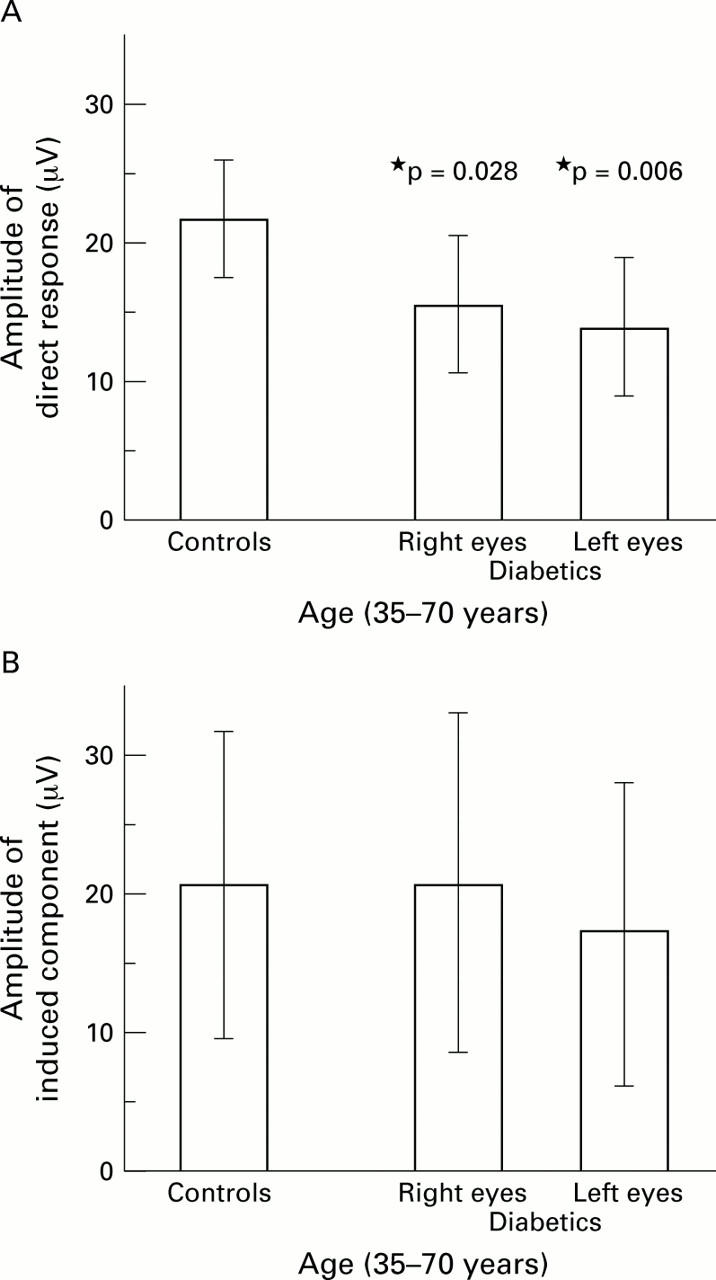
Comparison of response amplitudes between diabetics and controls. In both panels, age was limited to 35-70 years. (A) The direct response was significantly different (control eyes: n = 9, 21.0 (5.4) µV; diabetics right eyes: n = 10, 15.3 (4.8) µV; p = 0.028; diabetics left eyes: n = 10, 13.6 (4.7) µV; p <0.01). (B) There was no significant difference in the induced component between the two groups (control eyes: n = 9, 20.5 (9.4) µV; diabetics right eyes: n = 10, 20.7 (12.3) µV; p >0.9; diabetics left eyes: n = 10, 17.3 (10.8) µV; p >0.5).
Selected References
These references are in PubMed. This may not be the complete list of references from this article.
- Arden G. B., Hamilton A. M., Wilson-Holt J., Ryan S., Yudkin J. S., Kurtz A. Pattern electroretinograms become abnormal when background diabetic retinopathy deteriorates to a preproliferative stage: possible use as a screening test. Br J Ophthalmol. 1986 May;70(5):330–335. doi: 10.1136/bjo.70.5.330. [DOI] [PMC free article] [PubMed] [Google Scholar]
- Fortune B., Schneck M. E., Adams A. J. Multifocal electroretinogram delays reveal local retinal dysfunction in early diabetic retinopathy. Invest Ophthalmol Vis Sci. 1999 Oct;40(11):2638–2651. [PubMed] [Google Scholar]
- Gliem H., Möller D. E., Kietzmann G. Das doppelblitz-erg bei der diabetischen retinopathie. Acta Ophthalmol (Copenh) 1973;51(1):85–94. doi: 10.1111/j.1755-3768.1973.tb08250.x. [DOI] [PubMed] [Google Scholar]
- Juen S., Kieselbach G. F. Electrophysiological changes in juvenile diabetics without retinopathy. Arch Ophthalmol. 1990 Mar;108(3):372–375. doi: 10.1001/archopht.1990.01070050070033. [DOI] [PubMed] [Google Scholar]
- Palmowski A. M., Sutter E. E., Bearse M. A., Jr, Fung W. Mapping of retinal function in diabetic retinopathy using the multifocal electroretinogram. Invest Ophthalmol Vis Sci. 1997 Nov;38(12):2586–2596. [PubMed] [Google Scholar]
- Simonsen S. E. Prognostic value of ERG (oscillatory potential) in juvenile diabetics. Acta Ophthalmol Suppl. 1974;123:223–224. [PubMed] [Google Scholar]
- Sutter E. E., Tran D. The field topography of ERG components in man--I. The photopic luminance response. Vision Res. 1992 Mar;32(3):433–446. doi: 10.1016/0042-6989(92)90235-b. [DOI] [PubMed] [Google Scholar]
- Wanger P., Persson H. E. Early diagnosis of retinal changes in diabetes: a comparison between electroretinography and retinal biomicroscopy. Acta Ophthalmol (Copenh) 1985 Dec;63(6):716–720. doi: 10.1111/j.1755-3768.1985.tb01588.x. [DOI] [PubMed] [Google Scholar]
- YONEMURA D., AOKI T., TSUZUKI K. Electroretinogram in diabetic retinopathy. Arch Ophthalmol. 1962 Jul;68:19–24. doi: 10.1001/archopht.1962.00960030023005. [DOI] [PubMed] [Google Scholar]
- Yoshida A., Kojima M., Ogasawara H., Ishiko S. Oscillatory potentials and permeability of the blood-retinal barrier in noninsulin-dependent diabetic patients without retinopathy. Ophthalmology. 1991 Aug;98(8):1266–1271. doi: 10.1016/s0161-6420(91)32144-4. [DOI] [PubMed] [Google Scholar]


