Abstract
BACKGROUND/AIMS—To determine the reproducibility of the Humphrey optical coherence tomography scanner (OCT), software version 5.0, for measurement of retinal nerve fibre layer (RNFL) thickness in normal subjects and to compare OCT measurements with published histological thickness of the human RNFL. METHODS—Three independent measurements were obtained at each session for one eye from 15 normal subjects with a mean age of 30.8 (SD 10.9) years. Scans were taken in the peripapillary retina using the default setting (1.74 mm radius from centre of the optic disc) and were repeated 1 week later. Additional scans were obtained at the optic nerve head (ONH) margin overlying the scleral rim, for comparison with available histological data on the human RNFL. RESULTS—For the 1.74 mm circular scan, the mean coefficient of variation (COV) for the global RNFL thickness measurement was 5% (SD 3%). This increased to 8% (3%) for quadrant measurements and to 9% (3%) with further subdivision into 12 segments. Significant differences (p<0.05) between sessions were only found when the data were divided into segments. The mean RNFL thickness for the 1.74 mm scan was 127.87 (9.81) µm. The RNFL was maximal at the superior disc pole, 161.44 µm (14.8), and minimal at the temporal pole, 83.1 (12.8) µm. Peak thickness values occurred superior temporal and inferior temporal to the vertical axis. RNFL thickness for every sector of the disc was greatest at the margin of the optic disc (mean 185.79 µm; SD 32.61). Although the variation in RNFL thickness around the disc follows published histology data, the OCT underestimates RNFL thickness by an average of 37% (SD 11; range 21-48%). CONCLUSION—The OCT provides reproducible measurement of the retinal structures that are consistent with the properties of the RNFL. However, comparison with available studies of RNFL thickness in the human suggests that in its present form, the OCT underestimates RNFL thickness. Further refinement of this technology is required to improve the accuracy with which the OCT measures retinal nerve fibre layer thickness.
Full Text
The Full Text of this article is available as a PDF (157.9 KB).
Figure 1 .
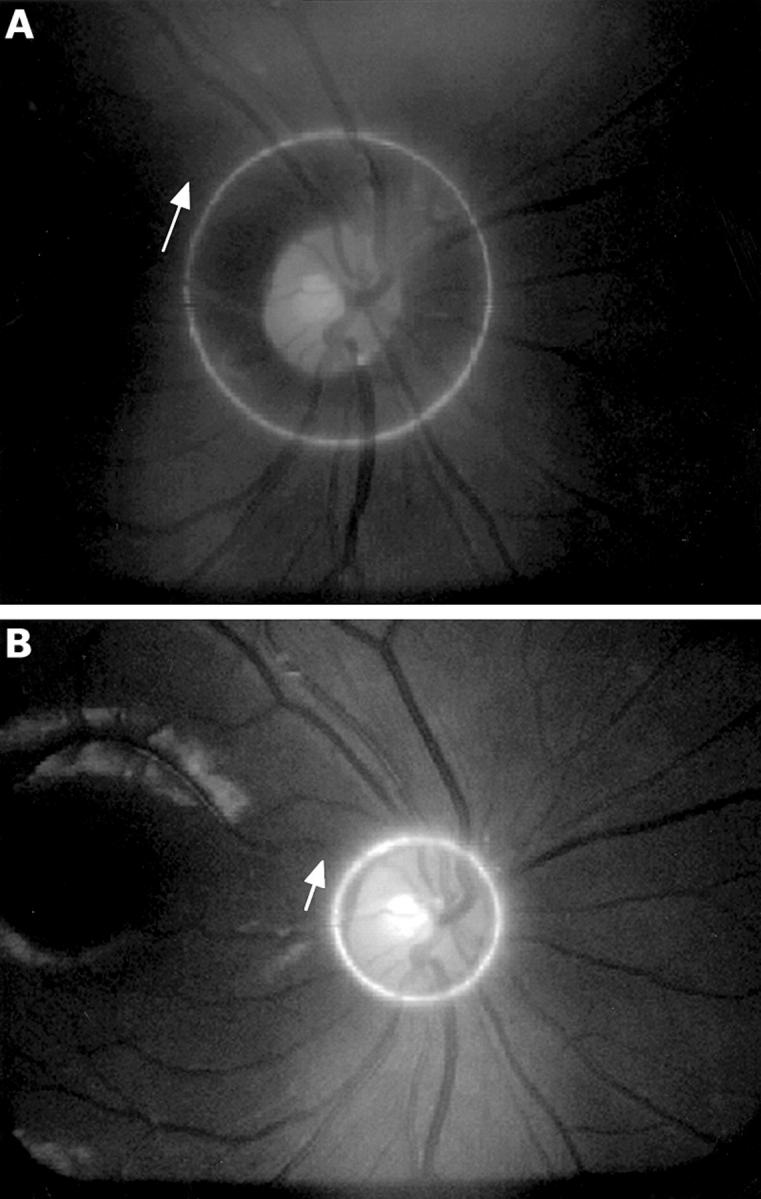
Operator monitor images showing the scan patterns with indication of scan direction (RE), (A) 1.74 mm circle scan, (B) ONH margin scan.
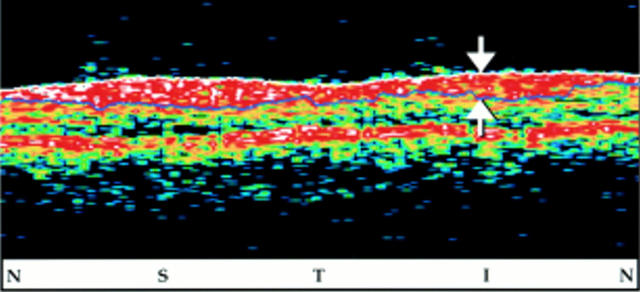
Figure 2 .
Raw data image as supplied by the commercial OCT software, the arrows indicate the RNFL. N = nasal, S = superior, T = temporal, I = inferior.
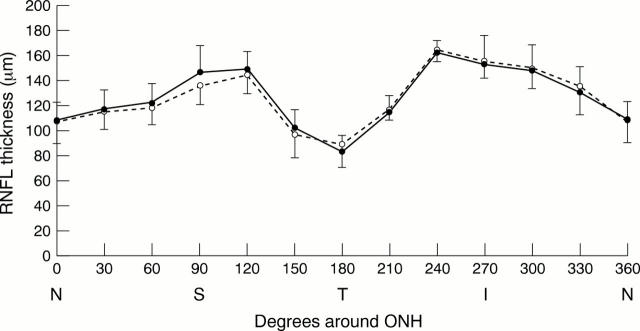
Figure 3 .
Plot of the mean RNFL thickness per segment for each session using the 1.74 mm circle scan, error bars indicate 1 SD from the mean. Open circles represent values from session 1; solid circles from session 2. N = nasal, S = superior, T = temporal, I = inferior.
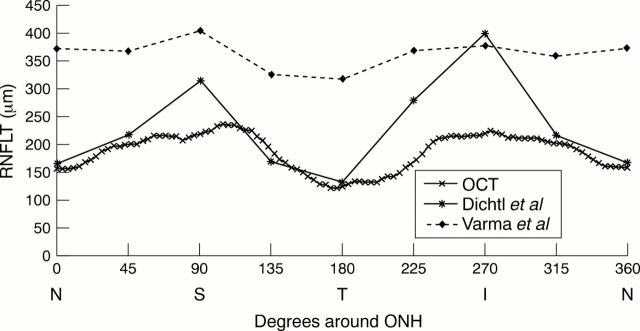
Figure 4 .
Plot of RNFL thickness according to angular location around the optic disc circumference. N = nasal, S = superior, T = temporal, I = inferior. Plots marked "OCT" represent values obtained by the OCT scan at the ONH margin. Those marked "Dichtl et al" and "Varma et al" represent RNFL thickness at the ONH margin as published by Dichtl et al,36 and Varma et al,35 respectively. Note the difference in modulation of the RNFL as measured by histology.
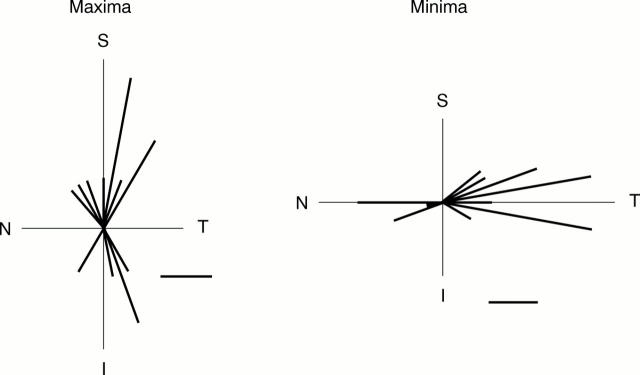
Figure 5 .
Polar frequency histogram showing the distribution of the maxima and minima for RNFL thickness at the ONH margin as measured by the OCT. N = nasal, S = superior, T = temporal, I = inferior. Scale bar shows representation for one subject.
Selected References
These references are in PubMed. This may not be the complete list of references from this article.
- Azuara-Blanco A., Harris A., Cantor L. B. Reproducibility of optic disk topographic measurements with the Topcon ImageNet and the Heidelberg Retina Tomograph. Ophthalmologica. 1998;212(2):95–98. doi: 10.1159/000027286. [DOI] [PubMed] [Google Scholar]
- Baumann M., Gentile R. C., Liebmann J. M., Ritch R. Reproducibility of retinal thickness measurements in normal eyes using optical coherence tomography. Ophthalmic Surg Lasers. 1998 Apr;29(4):280–285. [PubMed] [Google Scholar]
- Bowd C., Weinreb R. N., Williams J. M., Zangwill L. M. The retinal nerve fiber layer thickness in ocular hypertensive, normal, and glaucomatous eyes with optical coherence tomography. Arch Ophthalmol. 2000 Jan;118(1):22–26. doi: 10.1001/archopht.118.1.22. [DOI] [PubMed] [Google Scholar]
- Budde W. M., Jünemann A. Chalcosis oculi. Klin Monbl Augenheilkd. 1998 Mar;212(3):184–185. doi: 10.1055/s-2008-1034861. [DOI] [PubMed] [Google Scholar]
- Burk R. O., Tuulonen A., Airaksinen P. J. Laser scanning tomography of localised nerve fibre layer defects. Br J Ophthalmol. 1998 Oct;82(10):1112–1117. doi: 10.1136/bjo.82.10.1112. [DOI] [PMC free article] [PubMed] [Google Scholar]
- Caprioli J., Park H. J., Ugurlu S., Hoffman D. Slope of the peripapillary nerve fiber layer surface in glaucoma. Invest Ophthalmol Vis Sci. 1998 Nov;39(12):2321–2328. [PubMed] [Google Scholar]
- Chauhan D. S., Marshall J. The interpretation of optical coherence tomography images of the retina. Invest Ophthalmol Vis Sci. 1999 Sep;40(10):2332–2342. [PubMed] [Google Scholar]
- Dichtl A., Jonas J. B., Naumann G. O. Retinal nerve fiber layer thickness in human eyes. Graefes Arch Clin Exp Ophthalmol. 1999 Jun;237(6):474–479. doi: 10.1007/s004170050264. [DOI] [PubMed] [Google Scholar]
- Gan L., Fagerholm P., Kim H. J. Effect of leukocytes on corneal cellular proliferation and wound healing. Invest Ophthalmol Vis Sci. 1999 Mar;40(3):575–581. [PubMed] [Google Scholar]
- Giovannini A., Amato G. P., Mariotti C., Scassellati-Sforzolini B. OCT imaging of choroidal neovascularisation and its role in the determination of patients' eligibility for surgery. Br J Ophthalmol. 1999 Apr;83(4):438–442. doi: 10.1136/bjo.83.4.438. [DOI] [PMC free article] [PubMed] [Google Scholar]
- Gurses-Ozden R., Ishikawa H., Hoh S. T., Liebmann J. M., Mistlberger A., Greenfield D. S., Dou H. L., Ritch R. Increasing sampling density improves reproducibility of optical coherence tomography measurements. J Glaucoma. 1999 Aug;8(4):238–241. [PubMed] [Google Scholar]
- Hee M. R., Izatt J. A., Swanson E. A., Huang D., Schuman J. S., Lin C. P., Puliafito C. A., Fujimoto J. G. Optical coherence tomography of the human retina. Arch Ophthalmol. 1995 Mar;113(3):325–332. doi: 10.1001/archopht.1995.01100030081025. [DOI] [PubMed] [Google Scholar]
- Hee M. R., Puliafito C. A., Wong C., Duker J. S., Reichel E., Schuman J. S., Swanson E. A., Fujimoto J. G. Optical coherence tomography of macular holes. Ophthalmology. 1995 May;102(5):748–756. doi: 10.1016/s0161-6420(95)30959-1. [DOI] [PubMed] [Google Scholar]
- Hee M. R., Puliafito C. A., Wong C., Reichel E., Duker J. S., Schuman J. S., Swanson E. A., Fujimoto J. G. Optical coherence tomography of central serous chorioretinopathy. Am J Ophthalmol. 1995 Jul;120(1):65–74. doi: 10.1016/s0002-9394(14)73760-2. [DOI] [PubMed] [Google Scholar]
- Hoh S. T., Ishikawa H., Greenfield D. S., Liebmann J. M., Chew S. J., Ritch R. Peripapillary nerve fiber layer thickness measurement reproducibility using scanning laser polarimetry. J Glaucoma. 1998 Feb;7(1):12–15. [PubMed] [Google Scholar]
- Huang D., Swanson E. A., Lin C. P., Schuman J. S., Stinson W. G., Chang W., Hee M. R., Flotte T., Gregory K., Puliafito C. A. Optical coherence tomography. Science. 1991 Nov 22;254(5035):1178–1181. doi: 10.1126/science.1957169. [DOI] [PMC free article] [PubMed] [Google Scholar]
- Huang Y., Cideciyan A. V., Papastergiou G. I., Banin E., Semple-Rowland S. L., Milam A. H., Jacobson S. G. Relation of optical coherence tomography to microanatomy in normal and rd chickens. Invest Ophthalmol Vis Sci. 1998 Nov;39(12):2405–2416. [PubMed] [Google Scholar]
- Ip M., Garza-Karren C., Duker J. S., Reichel E., Swartz J. C., Amirikia A., Puliafito C. A. Differentiation of degenerative retinoschisis from retinal detachment using optical coherence tomography. Ophthalmology. 1999 Mar;106(3):600–605. doi: 10.1016/S0161-6420(99)90123-9. [DOI] [PubMed] [Google Scholar]
- Jonas J. B., Gusek G. C., Naumann G. O. Optic disc, cup and neuroretinal rim size, configuration and correlations in normal eyes. Invest Ophthalmol Vis Sci. 1988 Jul;29(7):1151–1158. [PubMed] [Google Scholar]
- Koozekanani D., Roberts C., Katz S. E., Herderick E. E. Intersession repeatability of macular thickness measurements with the Humphrey 2000 OCT. Invest Ophthalmol Vis Sci. 2000 May;41(6):1486–1491. [PubMed] [Google Scholar]
- Mistlberger A., Liebmann J. M., Greenfield D. S., Pons M. E., Hoh S. T., Ishikawa H., Ritch R. Heidelberg retina tomography and optical coherence tomography in normal, ocular-hypertensive, and glaucomatous eyes. Ophthalmology. 1999 Oct;106(10):2027–2032. doi: 10.1016/S0161-6420(99)90419-0. [DOI] [PubMed] [Google Scholar]
- Morgan J. E., Waldock A., Jeffery G., Cowey A. Retinal nerve fibre layer polarimetry: histological and clinical comparison. Br J Ophthalmol. 1998 Jun;82(6):684–690. doi: 10.1136/bjo.82.6.684. [DOI] [PMC free article] [PubMed] [Google Scholar]
- Morgan J. E., Waldock A. Scanning laser polarimetry of the normal human retinal nerve fiber layer: a quantitative analysis. Am J Ophthalmol. 2000 Jan;129(1):76–82. doi: 10.1016/s0002-9394(99)00267-6. [DOI] [PubMed] [Google Scholar]
- Nussenblatt R. B., Kaufman S. C., Palestine A. G., Davis M. D., Ferris F. L., 3rd Macular thickening and visual acuity. Measurement in patients with cystoid macular edema. Ophthalmology. 1987 Sep;94(9):1134–1139. doi: 10.1016/s0161-6420(87)33314-7. [DOI] [PubMed] [Google Scholar]
- Parisi V., Manni G., Gandolfi S. A., Centofanti M., Colacino G., Bucci M. G. Visual function correlates with nerve fiber layer thickness in eyes affected by ocular hypertension. Invest Ophthalmol Vis Sci. 1999 Jul;40(8):1828–1833. [PubMed] [Google Scholar]
- Pieroth L., Schuman J. S., Hertzmark E., Hee M. R., Wilkins J. R., Coker J., Mattox C., Pedut-Kloizman R., Puliafito C. A., Fujimoto J. G. Evaluation of focal defects of the nerve fiber layer using optical coherence tomography. Ophthalmology. 1999 Mar;106(3):570–579. doi: 10.1016/s0161-6420(99)90118-5. [DOI] [PMC free article] [PubMed] [Google Scholar]
- Ripandelli G., Coppé A. M., Bonini S., Giannini R., Curci S., Costi E., Stirpe M. Morphological evaluation of full-thickness idiopathic macular holes by optical coherence tomography. Eur J Ophthalmol. 1999 Jul-Sep;9(3):212–216. doi: 10.1177/112067219900900309. [DOI] [PubMed] [Google Scholar]
- Ripandelli G., Coppé A. M., Capaldo A., Stirpe M. Optical coherence tomography. Semin Ophthalmol. 1998 Dec;13(4):199–202. doi: 10.3109/08820539809056053. [DOI] [PubMed] [Google Scholar]
- Schuman J. S., Hee M. R., Arya A. V., Pedut-Kloizman T., Puliafito C. A., Fujimoto J. G., Swanson E. A. Optical coherence tomography: a new tool for glaucoma diagnosis. Curr Opin Ophthalmol. 1995 Apr;6(2):89–95. doi: 10.1097/00055735-199504000-00014. [DOI] [PubMed] [Google Scholar]
- Schuman J. S., Hee M. R., Puliafito C. A., Wong C., Pedut-Kloizman T., Lin C. P., Hertzmark E., Izatt J. A., Swanson E. A., Fujimoto J. G. Quantification of nerve fiber layer thickness in normal and glaucomatous eyes using optical coherence tomography. Arch Ophthalmol. 1995 May;113(5):586–596. doi: 10.1001/archopht.1995.01100050054031. [DOI] [PubMed] [Google Scholar]
- Schuman J. S., Pedut-Kloizman T., Hertzmark E., Hee M. R., Wilkins J. R., Coker J. G., Puliafito C. A., Fujimoto J. G., Swanson E. A. Reproducibility of nerve fiber layer thickness measurements using optical coherence tomography. Ophthalmology. 1996 Nov;103(11):1889–1898. doi: 10.1016/s0161-6420(96)30410-7. [DOI] [PMC free article] [PubMed] [Google Scholar]
- Tjon-Fo-Sang M. J., Lemij H. G. Retinal nerve fiber layer measurements in normal black subjects as determined with scanning laser polarimetry. Ophthalmology. 1998 Jan;105(1):78–81. doi: 10.1016/s0161-6420(98)91323-9. [DOI] [PubMed] [Google Scholar]
- Toth C. A., Narayan D. G., Boppart S. A., Hee M. R., Fujimoto J. G., Birngruber R., Cain C. P., DiCarlo C. D., Roach W. P. A comparison of retinal morphology viewed by optical coherence tomography and by light microscopy. Arch Ophthalmol. 1997 Nov;115(11):1425–1428. doi: 10.1001/archopht.1997.01100160595012. [DOI] [PubMed] [Google Scholar]
- Varma R., Skaf M., Barron E. Retinal nerve fiber layer thickness in normal human eyes. Ophthalmology. 1996 Dec;103(12):2114–2119. doi: 10.1016/s0161-6420(96)30381-3. [DOI] [PubMed] [Google Scholar]
- Waldock A., Potts M. J., Sparrow J. M., Karwatowski W. S. Clinical evaluation of scanning laser polarimetry: I. Intraoperator reproducibility and design of a blood vessel removal algorithm. Br J Ophthalmol. 1998 Mar;82(3):252–259. doi: 10.1136/bjo.82.3.252. [DOI] [PMC free article] [PubMed] [Google Scholar]
- Weinreb R. N., Lusky M., Bartsch D. U., Morsman D. Effect of repetitive imaging on topographic measurements of the optic nerve head. Arch Ophthalmol. 1993 May;111(5):636–638. doi: 10.1001/archopht.1993.01090050070031. [DOI] [PubMed] [Google Scholar]


