Abstract
In the apoptosis pathway in mammals, cytochrome c and dATP are critical cofactors in the activation of caspase 9 by Apaf-1. Until now, the detailed sequence of events in which these cofactors interact has been unclear. Here, we show through fluorescence polarization experiments that cytochrome c can bind to Apaf-1 in the absence of dATP; when dATP is added to the cytochrome c·Apaf-1 complex, further assembly occurs to produce the apoptosome. These findings, along with the discovery that the exposed heme edge of cytochrome c is involved in the cytochrome c·Apaf-1 interaction, are confirmed through enhanced chemiluminescence visualization of native PAGE gels and through acrylamide fluorescence quenching experiments. We also report here that the cytochrome c·Apaf-1 interaction depends highly on ionic strength, indicating that there is a strong electrostatic interaction between the two proteins.
Apoptosis plays a variety of crucial roles in multicellular organisms, helping to maintain the balance between cell proliferation and cell death, regulating healthy development, and protecting against disease. Because of the critical nature of this pathway, apoptosis is tightly regulated. In mammals, the cytochrome c (Cc)-dependent execution phase of apoptosis requires activation of caspase 9 to produce the active “caspase cascade,” which is responsible for the destruction of the cell (for reviews, refs. 1–4). This activation depends on the protein Apaf-1. Furthermore, Apaf-1 must be activated by other cofactors including Cc and dATP (5–7). Understanding how these cofactors bind and activate the apoptotic response is critical to detailed understanding of the process. In previous work, we have shown that the interaction between Cc and Apaf-1 is very strong. However, the previously published experiments were carried out in the presence of 100 μM dATP (8), so the role that dATP plays in the apoptotic pathway was not directly examined.
It has been proposed that dATP induces a conformational change in Apaf-1, permitting Cc binding (9). In contrast, the present data suggest the reverse scenario. Here, we show that Cc binds strongly to Apaf-1 in the absence of dATP. Addition of dATP to the Cc·Apaf-1 complex results in further assembly to produce a larger structure consisting of 8–10 Apaf-1 molecules along with associated Cc molecules. This larger structure has been referred to as the apoptosome (9). Previous studies have shown that dATP hydrolysis is necessary to form the apoptosome and that the hydrolyzed form of the nucleotide, dADP, is bound to Apaf-1 in the higher-order complex (9, 10).
We also have been interested in determining factors that affect Cc·Apaf-1 binding and in mapping out the binding interface between Cc and Apaf-1. Through a series of ionic strength experiments, we have determined that the Cc·Apaf-1 interaction is very sensitive to ionic conditions, indicating that there is a strong electrostatic component to the binding interaction. We also demonstrate through enhanced chemiluminescence (ECL) of native PAGE gels and fluorescence quenching experiments that the exposed heme edge of Cc is involved in a binding interface with Apaf-1 and is correspondingly less solvent-accessible when bound in the complex.
Materials and Methods
Materials.
Iron Cc (FeCc) from horse heart was obtained from Sigma and then modified to zinc-substituted Cc (ZnCc) and further purified according to published procedures (11, 12). Spodoptera frugiperda (Sf-21) insect cells, Cell-FECTIN reagent, IPL-41 insect medium, all media supplements, and protease inhibitors were obtained from GIBCO/Life Technologies, Grand Island, NY. dATP was obtained from Amersham Pharmacia Biotech. Enzyme grade Hepes, imidazole, MgCl2, Na4EDTA, KCl, NaCl, and DTT also were obtained from Sigma. Distilled water was purified by a Millipore Milli-Q water purification system. ECL reagents were obtained from Amersham Pharmacia Biotech. Acrylamide (99.9%) and all gel electrophoresis chemicals were obtained from Bio-Rad.
Production of Recombinant Apaf-1.
Full-length Apaf-1 cDNA subcloned into the baculovirus expression vector pFastBacI (GIBCO/Life Technologies) and transformed into DH10Bac Escherichia coli cells was generously supplied to us by Xiaodong Wang, University of Texas Southwest Medical Center. Apaf-1 then was isolated and purified according to the procedures given below, which are adapted from Wang's previously published procedure (9).
The recombinant viral DNA was purified according to the Bac-to-Bac Baculovirus Expression System procedure (GIBCO/Life Technologies) and used to transfect Sf-21 insect cells with CellFECTIN reagent. The insect cells were grown in IPL-41 insect media supplemented with 10% FCS, 2.6 g/liter tryptose phosphate broth, 4 g/liter yeastolate, 0.1% Pluronic F-68, and 1× antibiotic/antimycotic. The viral stock was amplified to 200 ml, which was used to infect 2.5 liters of Sf-21 cells at a density of 2 × 10⁶ cells/ml. Infected cells were harvested 36 h postinfection. Cells were centrifuged for 20 min at 5,000 rpm and then resuspended in buffer A, pH 8.0 containing 1 M ethanol (buffer A = 20 mM Hepes/10 mM KCl/1.5 mM MgCl2/1 mM Na4EDTA). For all purification steps, buffer A was supplemented with 1 mM DTT, 0.1 mM PMSF, and 0.1 μM aprotinin. Cells were incubated on ice for 15 min then lysed by homogenization with a tissue grinder. Lysed cells were centrifuged in a Beckman ultracentrifuge at 19,000 rpm for 1 h. The cell supernatant was loaded onto a 4 ml Ni-nitrilotriacetic acid column, and the column was washed with 300 ml of buffer A, pH 7.5 containing 1 M NaCl and 20 mM imidazole. Apaf-1 then was eluted by using 8 ml of buffer A, pH 7.5 containing 250 mM imidazole. Eluted protein was stored at −70°C in buffer A + 20% glycerol. Protein concentration was determined by using a quantitative Bradford assay (Bio-Rad).
Fluorescence Methods.
Steady-state fluorescence experiments were performed by using a Photon Technologies International (S. Brunswick, NJ) Quantamaster fluorometer equipped with a PowerArc xenon arc lamp excitation source. For fluorescence polarization experiments, the instrument was fitted with Glan-Thompson manual polarizers. Data were recorded by using felix software for Windows 3.1.
Polarization experiments were performed in a 10-mm path-length quartz cuvette containing 2 ml of buffer A, pH 7.5. Horse heart ZnCc (ZnHHCc) was excited at 550 nm, and emission was monitored at 587 nm. Apaf-1 in buffer A + 20% glycerol (0.5–2.0 μM) was titrated into a 75 nM solution of ZnHHCc in the presence or in the absence of 100 μM dATP. All polarization data were corrected for the addition of buffer A containing 20% glycerol.
Polarization was calculated according to the following formula:
 |
where I// and I⊥ are the emission intensities when the emission polarizer is aligned parallel or perpendicular to the polarization of the excited light. G is a correction factor accounting for the bias of the detection system for vertically versus horizontally polarized light.
Acrylamide quenching experiments were performed by titrating an 8 M acrylamide (in buffer A, pH 7.5) stock solution into samples of ZnCc, ZnCc + Apaf-1, and ZnCc + Apaf-1 + dATP at similar concentrations to those given above for polarization experiments. Fluorescence quenching data were analyzed according to the Stern-Volmer equation:
 |
where I0 and I are the fluorescence intensities in the absence and presence of acrylamide. KSV is the dynamic quenching constant, Ka is the static quenching constant, and [Q] is the molar concentration of acrylamide (13).
Ionic strength experiments were performed similarly to the polarization experiments described above. However, buffer A was mixed with buffer A + 1 M NaCl to obtain NaCl concentrations of 50 mM, 100 mM, 150 mM, and 200 mM. ZnCc was added to 2 ml of buffer A + NaCl. Apaf-1 was titrated into this solution, and polarization was monitored. Data were fit to a 2:1 Cc·Apaf-1 binding isotherm to obtain binding constants at each ionic strength. Ionic strength concentrations were adjusted for the presence of KCl and MgCl2 present in buffer A. Data were analyzed according to the method of van Leeuwen (14), and the logarithm of Ka was plotted against the square root of the molar ionic strength.
Electrophoresis and ECL.
Protein samples were subjected to native PAGE by using the Ornstein-Davis discontinuous buffer system (15). Chemiluminescent detection of reduced FeCc-induced luminol peroxidase activity was performed with modifications to the manufacturer's procedures. The electrophoretic gels were incubated for exactly 1 min in a 1:1 mixture of ECL reagents 1 and 2. The gels then were wrapped in plastic wrap and exposed to Kodak X-Omat autoradiography film for periods ranging from 30 s to 30 min. Film was developed in a darkroom by first placing film in Kodak GBX developer and replenisher solution for 5 min. Film then was washed for 30 s with running water. Film then was placed in Kodak GBX fixer and replenisher solution for 5 min, washed for 5 min under running water, and then air dried.
Results
In earlier work, we (8) and others (16) showed that the fluorescent protein horse heart ZnCc provides an active surrogate for FeCc in Apaf-1 binding and caspase activation. The fluorescence of ZnCc provides a convenient method to monitor Apaf-1 binding. The relatively small (12.5 kDa) ZnCc protein rotates fairly rapidly on the time scale of fluorescence. Therefore, fluorescence polarized light is largely depolarized during emission. When ZnCc binds to the much larger (130 kDa) Apaf-1, rotation is slower and the net residual polarization increases. Therefore, as previously shown, fluorescence polarization can be used to monitor Cc·Apaf-1 binding (8).
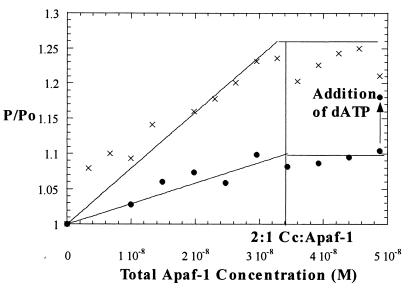
Fig. 1 compares binding curves for ZnCc·Apaf-1 binding in the presence and absence of dATP. It is clear that strong binding occurs under both conditions. One difference is that in the titration performed in the absence of dATP, the polarization ratio increases on dATP addition at the end of the titration, consistent with the formation of a very large adduct, e.g., the apoptosome.
Figure 1.
Fluorescence polarization titrations with (x) and without (●) dATP present. The titration data in the presence of dATP are similar to those previously reported (8). The fits shown assume Ka > 108 M-1 (the association constant is sufficiently great under these conditions that the data do not define a unique value for Ka).
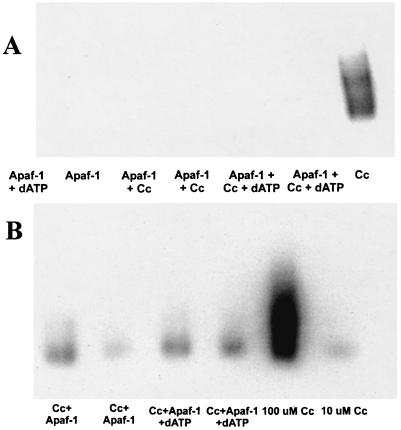
Strong binding of Cc to Apaf-1 was independently confirmed by a set of native PAGE experiments visualized by ECL (Fig. 2). Reduced FeCc reacts with chemiluminescent peroxidase reagents to induce the oxidation of luminol. Immediately after oxidation, luminol is in an excited state, which decays to the ground state via a light- emitting pathway (17). By exposing the luminescent gel to autoradiography film, bands can be visualized where the Cc has reacted with the peroxidase reagents. Apaf-1 alone shows no reactivity with the ECL reagents. Therefore, we could use this method to selectively view Cc in the gel and determine whether it was bound to Apaf-1. After exposure of the native gels to ECL reagents, the gels were silver-stained to determine the position of Apaf-1 on the gels (data not shown).
Figure 2.
ECL visualization of FeCc on native PAGE gels. (A) Stoichiometric Apaf-1·Cc concentrations. No chemiluminescence is observed in the bands in which Apaf-1 is present, indicating that Cc is bound to Apaf-1 in such a way that the heme is no longer exposed to chemiluminescence reagents. (B) Excess Cc is present. Luminescence is restored to the lanes containing Apaf-1, but some smearing is observed in those lanes, indicating exchange of Cc with Apaf-1 as it moved down the gel.
When stoichiometric (1 Apaf-1·2 Cc) Apaf-1 is bound to Cc, the luminescence induced by Cc is abolished. The differential reactivity of Cc in the presence of Apaf-1 signals binding. Apaf-1 binding to Cc apparently sequesters the heme so that the luminescence reaction cannot proceed. When excess Cc is added, luminescence is restored, as shown in Fig. 2. Consistent with the fluorescence results, the observed binding reaction is independent of whether dATP is present.
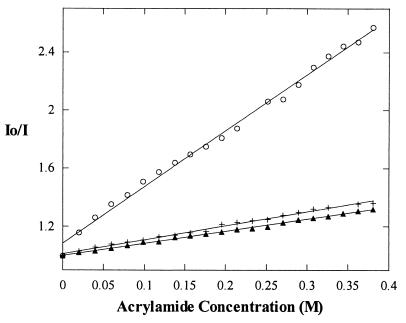
Acrylamide quenching experiments provide another confirmation of strong binding involving the exposed heme edge of Cc to Apaf-1 both in the presence and absence of dATP. Acrylamide is an appropriate choice as a quenching agent because it is a neutral molecule. A charged species may disrupt the binding of Cc and Apaf-1 through ionic interactions, because Cc and Apaf-1 are highly positively and negatively charged, respectively. When a stock solution of 8 M acrylamide is titrated into a solution of 75 nM ZnCc, fluorescence is quenched by approximately 61%. ZnCc in the presence of excess Apaf-1, with or without dATP present, is quenched by less than 26%.
Plots of I0/I versus acrylamide concentration are linear. Therefore, quenching is entirely dynamic, and the dynamic quenching constant, KSV, is reported as the slope of the line (Fig. 3). The KSV value for ZnCc alone is 4.2 ± 0.5 M-1, whereas KSV values for ZnCc + Apaf-1 in the presence and absence of dATP are 1.0 ± 0.2 M-1 and 0.8 ± 0.2 M-1, respectively. The values for KSV for ZnCc + Apaf-1 in the presence and absence of dATP are the same, within the error range of the experiment. Therefore, we conclude that Cc binding to Apaf-1 does not require the cofactor dATP. Quenching of ZnCc alone is more than twice as much as the quenching observed when Apaf-1 is present. This observation supports the ECL result that the heme edge of Cc is no longer exposed to solvent when Cc is bound to Apaf-1.
Figure 3.
Acrylamide quenching data fit to a linear Stern-Volmer plot. ZnCc alone (○) KSV = 4.2 ± 0.5, ZnCc + Apaf-1 + dATP (+) KSV = 1.0 ± 0.2, and ZnCc + Apaf-1 (▴) KSV = 0.8 ± 0.2.
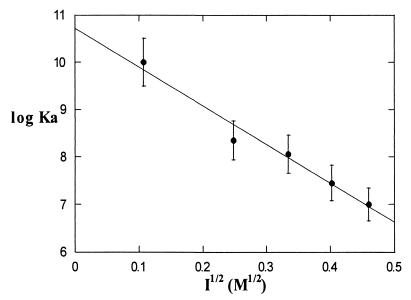
Ionic strength experiments show that the binding interaction between Cc and Apaf-1 depends strongly on ionic strength. When fluorescence polarization experiments were performed in buffer A supplemented with 0–200 mM NaCl, the logarithm of the association constant for 2:1 Cc·Apaf-1 binding decreased linearly with the square root of ion concentration, resulting in Ka at zero NaCl of approximately 1010 M-1 to Ka at 200 mM NaCl of approximately 107 M-1 (Fig. 4). This strong ionic strength dependence of Cc·Apaf-1 binding is consistent with the ionic strength dependence of Cc binding with its other physiological binding partners (18, 19). The strong ionic strength dependence of the Cc·Apaf-1 interaction is also consistent with the involvement of the strongly charged surface of Cc containing the exposed heme edge. This region of Cc contains several positively charged lysine residues that could form electrostatic interactions with negatively charged residues in the WD-40 region of Apaf-1. This finding is also consistent with the recent report that residue lysine 72 appears to be involved in Cc·Apaf-1 binding (20).
Figure 4.
Ionic strength dependence of the association constant for the formation of a 2:1 Cc·Apaf-1 complex. The solid line is a weighted linear least-squares fit to the data.
Discussion
The Role of dATP.
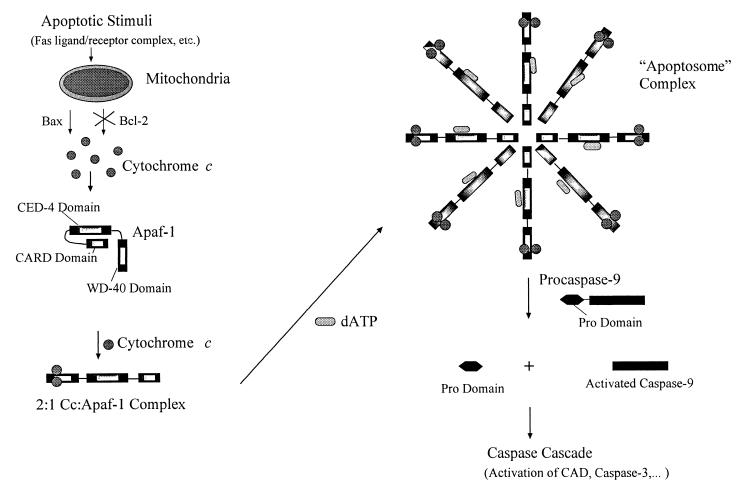
Taken together, fluorescence polarization, ECL, and acrylamide fluorescence quenching results show that Apaf-1 and Cc can form a strong complex with or without dATP present. The stoichiometry of the complex is 2 Cc·1 Apaf-1 and does not change when dATP is added. dATP addition to the preformed Cc·Apaf-1 adduct results in further assembly into a higher molecular weight adduct. We therefore suggest a mechanism like that shown in Fig. 5, indicating the role of dATP may be to facilitate formation of the apoptosome complex.
Figure 5.
Schematic diagram of the apoptotic pathway involving Cc, Apaf-1, and dATP. Upon release from the mitochondria, Cc forms a 2:1 complex with Apaf-1. The presence of micromolar dATP then facilitates the formation of the apoptosome, which binds and activates caspase 9, initiating the caspase cascade.
The Cc·Apaf-1 Binding Interface.
Our ECL and fluorescence quenching results indicate that the exposed heme edge of Cc is much less solvent-accessible when Cc is bound to Apaf-1. The face of the Cc molecule containing the exposed heme edge has 11 positively charged lysine residues. The proposed Cc binding domain on Apaf-1 is the WD-40 region, which contains several negatively charged aspartic acid residues. Based on the strong ionic strength dependence of Cc·Apaf-1 binding, we conclude that electrostatic interactions between the positively charged face of Cc containing the exposed heme edge and the WD-40 region of Apaf-1 are an important component of the Cc·Apaf-1 binding.
Previously, we reported the Cc·Apaf-1 association constant as on the order of 1011 M-1 under the relatively low ionic strength conditions we studied (8). Now, we observe that Cc·Apaf-1 binding is significantly weaker at increased ionic strength. In fact, under physiological conditions, where intracellular potassium and sodium ion concentration is about 150 mM, we estimate that the Cc·Apaf-1 association constant is approximately 4 × 10⁷ M-1.
At this time, many questions remain unaddressed, including the role of additional modulating cofactors and the mechanism by which dATP allows for formation of the apoptosome. However, the present data better clarify the role of dATP and provide important initial information about one region of Cc located at the Apaf-1 binding interface. More detailed information about this interface may allow drug design for the regulation of apoptosis.
Acknowledgments
We gratefully acknowledge the ongoing collaboration of Xiaodong Wang, and the support of the National Institutes of Health (GM 59348).
Abbreviations
- Cc
cytochrome c
- ECL
enhanced chemiluminescence
- ZnCc
zinc-substituted cytochrome c
- FeCc
iron cytochrome c.
Footnotes
Article published online before print: Proc. Natl. Acad. Sci. USA, 10.1073/pnas.220416197.
Article and publication date are at www.pnas.org/cgi/doi/10.1073/pnas.220416197
References
- 1.Mignotte B, Vayssiere J L. Eur J Biochem. 1998;252:1–15. doi: 10.1046/j.1432-1327.1998.2520001.x. [DOI] [PubMed] [Google Scholar]
- 2.Ashkenazi A, Dixit V M. Science. 1998;281:1305–1308. doi: 10.1126/science.281.5381.1305. [DOI] [PubMed] [Google Scholar]
- 3.Green D R, Reed J C. Science. 1998;281:1309–1312. doi: 10.1126/science.281.5381.1309. [DOI] [PubMed] [Google Scholar]
- 4.Thornberry N A, Lazebnik Y. Science. 1998;281:1312–1316. doi: 10.1126/science.281.5381.1312. [DOI] [PubMed] [Google Scholar]
- 5.Liu X, Kim C K, Yang J, Jemmerson R, Wang X. Cell. 1996;86:147–157. doi: 10.1016/s0092-8674(00)80085-9. [DOI] [PubMed] [Google Scholar]
- 6.Li P, Nijhawan D, Budihardjo I, Srinivasa S M, Ahmad M, Alnemri E, Wang X. Cell. 1997;91:479–489. doi: 10.1016/s0092-8674(00)80434-1. [DOI] [PubMed] [Google Scholar]
- 7.Zou H, Henzel W, Liu X, Lutschg A, Wang X. Cell. 1997;90:405–413. doi: 10.1016/s0092-8674(00)80501-2. [DOI] [PubMed] [Google Scholar]
- 8.Purring C, Zou H, Wang X, McLendon G. J Am Chem Soc. 1999;121:7435–7436. [Google Scholar]
- 9.Zou H, Li Y, Liu X, Wang X. J Biol Chem. 1999;274:11549–11556. doi: 10.1074/jbc.274.17.11549. [DOI] [PubMed] [Google Scholar]
- 10.Hu Y, Benedict M A, Ding L, Nunez G. EMBO J. 1999;18:3586–3595. doi: 10.1093/emboj/18.13.3586. [DOI] [PMC free article] [PubMed] [Google Scholar]
- 11.Vanderkooi J M, Adar F, Erecinska M. Eur J Biochem. 1976;64:381–387. doi: 10.1111/j.1432-1033.1976.tb10312.x. [DOI] [PubMed] [Google Scholar]
- 12.Zhou J S, Tran S T, McLendon G, Hoffman B. J Am Chem Soc. 1997;119:269–277. [Google Scholar]
- 13.Eftink M R, Ghiron C A. Anal Biochem. 1981;114:119–227. doi: 10.1016/0003-2697(81)90474-7. [DOI] [PubMed] [Google Scholar]
- 14.Van Leeuwen J W. Biochim Biophys Acta. 1983;743:408–421. doi: 10.1016/0167-4838(83)90400-4. [DOI] [PubMed] [Google Scholar]
- 15.Ornstein L, Davis B J. Anal NY Acad Sci. 1964;121:321. doi: 10.1111/j.1749-6632.1964.tb14207.x. [DOI] [PubMed] [Google Scholar]
- 16.Kluck R M, Martin S J, Hoffman B M, Zhou J S, Green D R, Newmeyer D D. EMBO J. 1997;16:4639–4649. doi: 10.1093/emboj/16.15.4639. [DOI] [PMC free article] [PubMed] [Google Scholar]
- 17.Dorward D W. Anal Biochem. 1993;209:219–223. doi: 10.1006/abio.1993.1110. [DOI] [PubMed] [Google Scholar]
- 18.Mauk M R, Reid L S, Mauk A G. Biochemistry. 1982;21:1843–1846. doi: 10.1021/bi00537a021. [DOI] [PubMed] [Google Scholar]
- 19.English A M, Cheung E. Inorg Chim Acta. 1992;201:243–246. [Google Scholar]
- 20.Kluck R M, Ellerby L M, Ellerby H M, Naiem S, Yaffe M P, Margoliash E, Bredesen D, Mauk A G, Sherman F, Newmeyer D D. J Biol Chem. 2000;275:16127–16133. doi: 10.1074/jbc.275.21.16127. [DOI] [PubMed] [Google Scholar]


