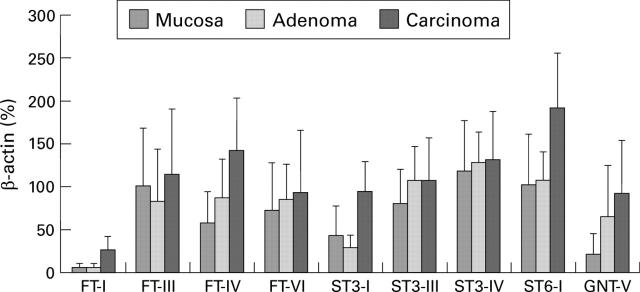
Figure 3 .
Glycosyltransferase expression in human colorectal tissue. For semiquantitative analysis of the reverse transcription-polymerase chain reaction data, fluorescence of each sample was compared with that of β-actin co-amplified in the same tube. Standard deviations describe tumour heterogeneity not the accuracy of the assay system. FT-I, H blood group α1,2-fucosyltransferase I; FTIII-VI, fucosyltransferases III-VI; STI-IV, sialyltransferases ST3Gal-I-IV; ST6-I, sialyltransferase ST6Gal-I; GNT-V, β1,6-N-acetylglucosaminyltransferase V.

