
Figure 2 .
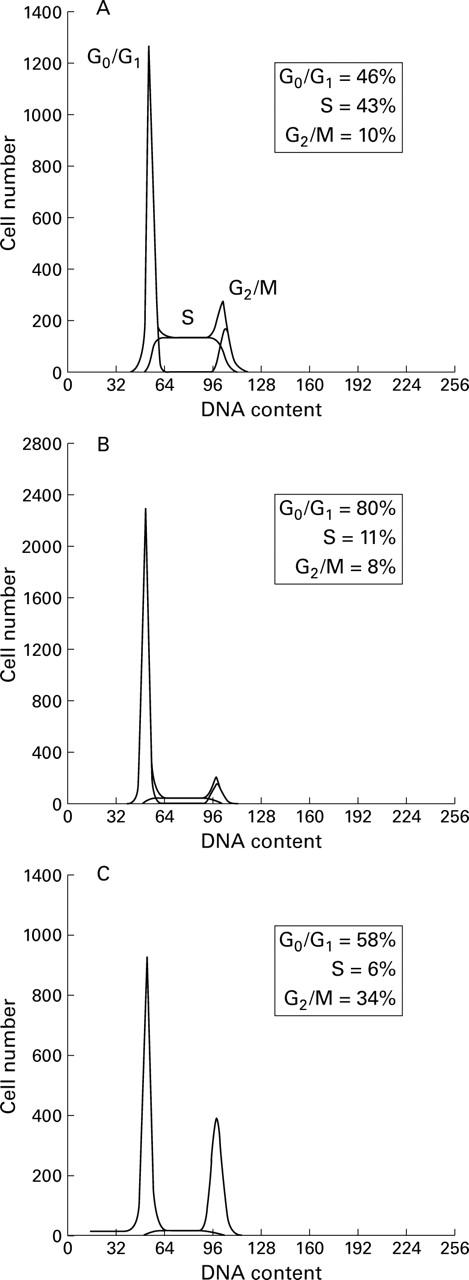
Histograms of DNA content of untreated HT-29 cells (A) and cells treated with 5 mM butyrate (B) or 0.5 µM trichostatin A (C). Cells were treated with each substance for 24 hours, and their DNA content was determined as described in Materials and methods. The cell cycle phase distributions (%) for each treatment are indicated within each panel.